Some of you may have learned of a report indicating a 10% drop in wind speeds across the US. It appears different scientists may have different points of view on aspects of the report. One of the important consequences would be the impact of lower wind speeds on wind power. So, some of you might ask yourself the following:
The author of the wind study estimated the value to be 30%:
Pryor said a 10 percent change in peak winds would translate into a 30 percent change in how much energy is reaped. But because the research is in such early stages, she said, “at this point it would be premature to modify wind energy development plans.”
In contrast, Gavin said,
A naysayer is Gavin Schmidt, a NASA climate scientist in New York who said the results conflict with climate models that show no effect from global warming. He also doubts that any decline in the winds that might be occurring has much of an effect on wind power.
As Gavin has spoken, you might wonder how Prior, who does not blog at Real Climate, came up with an estimate of 30%? Here’s the explanation.
If an existing wind turbine with a fixed design is installed and oriented properly, the power will depend on some geometric factors that are fixed, and the wind velocity.
Power is known to be proportional to the product of a force, F, acting on the turbine blades and the velocityof the fluid relative to the blades. Assuming proper orientation, the velocity relative to the blades will be proportional to the velocity of the wind, V. So, the Power P will vary as P~FV; we could use an equality if we know the constant of proportionality for a particular turbine design.
So far, power appear to be linearly proportional to velocity V. However, this is not so because, for things like large turbines rotating in air, the force, F, is known to proportional to the product of something called dynamic pressure and the cross sectional area swept out by the turbine blades which is fixed geometric feature for the blades. The dynamic pressure associated with the wind is 1/2ρ V2 where ρ is the density of the air.
So, power varies as P ~1/2ρ V3.
Using this relation, we can find that decreasing wind speed to 90% of the original value results in 72% power relative to what is available at the original velocity. Increasing wind to 110% the original value increases power to 133% available at the original velocity. Of course, both estimates assume the turbine maintains the same level of efficiency to convert wind energy to power at both speeds.
As you can see, this value matches Pryor’s estimate. Roughly speaking one can estimate that a US-wide 10% decrease in wind speed will take a 30% bite out of the availability of wind power for the US. Of course, the estimated 30% decrease in available wind power would only occur if the wind velocities have declined more or less uniformly across the US and the wind’s remain low or continue to slacken for any reason.
I have to admit having my doubts that there could possibly be any meaningful effect but the explanation you give is convincing. Thanks!
So is Gavin saying that there is NO decrease in wind velocities, or that any decrease is not due to global warming?
Douggrell– You would have to ask him. That’s the full quote in the article, and it may not fully capture his thoughts on the subject.
If he doubts the decrease exists, and turns out to be correct about that, there will be no effect on power production. Or, he may thinks something more nuanced.
However, the ~10% decrease in wind at the tower results in a ~30% power decrease for that tower is straightforward engineering. There can be details associated with efficiencies, but that’s pretty much the correct value.
Beyond the engineering computation, economic analysis would need someone to estimate the changes in wind velocity by region. So, for example, the article evidently reports the winds haven’t declined so much in Texas, but have in the midwest.
Estimating the real economic impact could get complicated. If you have two towers, and wind declines 0% at one, and 10% at the other, you lose more power than if it declines 10% at both locations. But this might not be so important if places that weren’t windy in the first place saw a decline in wind while windy places did not.
Based on the two sentences we can’t really know what Gavin’s full thinking was. It could range from simply not believing there is a decline to having done a full economic analysis based on precisely which places are showing declines in wind.
Attributed to Gavin:
A naysayer is Gavin Schmidt, a NASA climate scientist in New York who said the results conflict with climate models that show no effect from global warming.
My emphasis.
Its apparent, as I have said before in this forum and others, that Gavin disbelieves the measured results because it conflicts with his models.
This reminds me of a passage from “The Right Stuff”. Some pilots were discussing the crash and death of another pilot, who apparently, totally trusted his instruments….right into the ground, at high speed.
One pilot stated: “He was a good pilot. But he shoulda looked out the window more often.”
The Right Stuff is a great movie!
Former Cincinnati Bengal O. Lineman and Pro Football Hall of Famer, Anthony Munoz made an appearance in that movie. FYI.
That’s my Move Trivia Report for today. Peace! 😉
Andrew
As a former aero engineer, the cubic relationship between power and wind velocity sounds reasonable. It appears similar to the equivalent power of a jet engine being the product of thrust times velocity, with the “thrust” in this case being proportional to the dynamic pressure, which is proportional to the square of the velocity. The part that I’ve forgotten (and my books are all in storage) is the “it can be shown” part of the argument that relates to the proportionality to the area swept out by the blades. I seem to recall that it is true, but I don’t recall why. There would appear to be a rather complicated relationship between the velocity of the wind, the velocity of a blade section as it rotates, and the lift produced by the blade section which produces the resulting torque. Can you suggest an online reference, so that I can satisfy my curiosity? I’m sure it’s a little too involved to get into on your blog.
Les–
I agree that the quote (even without bold) conveys the impression that Gavin
a) Doesn’t believe the measured results, and
b) his reason for doubting them is they disagree with his models.
So, we might infer that the reason he doesn’t believe declining winds that might occur will impact power generation is he simply doesn’t believe he decline could be as large as measured.
However, Gavin frequently complains he is misquoted or misunderstood. I have my theories about why he is misunderstood; my theories likely differ from Gavin’s theories.
Nevertheless, if someone wants to know what idea Gavin meant to communicate to Seth Borenstein, and ultimately Seth’s readers, they will have to ask Gavin to clarify.
Afterwards they can parse Gavin’s words to figure out what Gavin meant. Or, if they wish, they could contact Seth Borenstein and request a word for word transcript to figure out if Seth’s quote mis-represents Gavin’s opinion as communicated to Seth.
In regards to this study on reduced average and peak wind speed:
This would also indicate that storm intensity has reduced, as peak winds would most often be found in storm systems. (heavy emphasis on “indicate”)
This of course, is one the planks of the AGW system; namely, that there will be more, and more intense storms, due to AGHG emissions.
Duane–
The same relation holds for mixers, fans etc. It’s not so much the area of anything specific as a length scale relation. There is some area, “A” that is proportional to the square of some length scale “L” (or the product of two lenght scales– but fixed once you specify the geometry.)
You can pick another area; that changes the constant of proportionality in P~ ρ V3.
Some correlations for mixers use tip velocity and area swept out. Some use velocity at the center of the blade, and area based on the equivalent of a chord for the blade and the blade length. With mixing it can be a pain in the neck to translate them all to the same basis, but it can always be done after you specify the entire geometry.
Regardless of the area you use, the estimate for the effect of changing velocity 10% resulting in a 30% change in power stays the same.
“A naysayer is Gavin Schmidt, a NASA climate scientist in New York who said the results conflict with climate models that show no effect from global warming.”
I read over a list of Gavin’s recent publications. Turns out this is a continuing theme: 1) reported measurements that suggest the GISS model may be incorrect, 2) Gavin (usually with one or more co-authors) writes a paper saying that the measurements are either incorrect or are not measuring what they are said to measure. Quite humorous really, since most people use measurements to validate models, and don’t try to use models to refute measurements. At some point the model’s predictions will be so far for the measured air temperatures and ocean heat contents that Gavin’s paper’s will no longer be credible.
In this case, I read Gavin to be arguing that while empirical measurement in the U.S. might show decreasing wind speeds, there is not necessarily evidence that this decrease is linked to warming temperatures, and that this link is not evident in climate models.
He goes into more detail over at RC:
[Response: It’s not so simple. First off, you need to think of wind as a complex field. Under no reasonable circumstances do winds globally increase or decrease. Factors that set windiness in different regions are different. The tropics are different from the mid-latitudes and are different to coastal or monsoonal regions. In the southern ocean, there has been a very strong increase in winds mainly because of the ozone hole changing upper trop/lower strat temperature gradients, while the surface gradients haven’t changed much. There is a similar effect in the winter in the Northern Hemisphere after volcanic eruptions and possibly as a function of increasing CO2. Winds in tropical situations respond to the convection (at the local scale) and the Hadley Circulation regionally etc. All other things being equal, a reduced equator-pole surface temperature gradient will reduce baroclinic instability and thus storminess in the mid-latitudes, but that is not the same as mean wind speed, and in any case, all else is not equal! You can see what our model suggest for the A1B IPCC scenario at 2090-2099 here (derivable from here) – it’s a complex pattern (strong changes in the southern ocean and tropics), but very little expected change over the US. That is not definitive of course – I haven’t looked at other models or seasons – but it should suffice to demonstrate that simple answers are not going to be very applicable. – gavin]
Mike also adds some thoughts:
[Response: Um, well they quote me too and I note that the trends are likely real. As I explained to the journalist (Seth Borenstein of the AP-he’s quite good), this does not mean that they can be related to anthropogenic climate change. that would require further work, e.g. application of standard detection + attribution approaches to the problem. Seth indeed makes that point in the article. I also pointed out to him that, if there is a climate change connection (and that’s an important if), the irony is that climate change could actually be counteracting the efficacy of alternative energy sources that might be necessary to move to a non-fossil fuel intensive energy economy. That point is made in the first sentence of the article. I was disappointed to see Gavin and me quoted as if we’re in opposition in our views on the study. We’re not–I agree w/ Gavin that there isn’t yet a demonstrated climate change linkage. That of course in no way means that such a linkage does not exist. – mike]
Zeke–
I read that inline comment to Gavin. But I’m not sure it modifies my impression of what Gavin meant by the two sentence quote. The reason is, Gavin is answering this:
Gavin answer appears to say that he doesn’t think a reduced pole-to-equator temperature gradient will result in less wind. It’s a long answer and he also doesn’t seem to thin it will result in more wind either.
So, we are still left with the question: does Gavin believe the measurements will be found inaccurate? If yes, does he believe the measurements will be found inaccurate because the models don’t predict that occuring?
Many get that impression from the two sentence quote in Seth Borenstein’s article. Those who want a specific answer to that need to ask Gavin that specific question. (I’m only modestly curious. My main point is if speeds have declined 10% uniformly, then yes, the amount of power available from wind will diminish 30%. I haven’t read the paper, so I have no opinoin on whether the winds really did decline 10%.)
I see they’ve got their stories straight now…
Andrew: which is why suspects are always interrogated separately.
Someone else caught my “suspects” analogy! Hehe…
Actually, I’m very rarely misquoted in the mainstream media (mostly because journalists take the time to listen to what’s being said and follow-up if something doesn’t appear to make sense)…
But if you want to read more about changing winds, feel free to pass by:
http://www.realclimate.org/index.php/archives/2009/06/winds-of-change/
Gavin, will you allow either myself of Jeff Id to post questions at RC? Both of us have been blocked from doing so in the last few days.
“I’m very rarely misquoted in the mainstream media”
Is there somebody who is misquoted a significant precentage of the time in the mainstream media? Just askin’!
😉
Andrew
“I’m very rarely misquoted in the mainstream mediaâ€
Do you have any model runs to substantiate that claim?
Gavin–
Nice article.
Though, I have to admit, having read the whole thing, I still don’t know if you think the observational results are an artifact that will be to be incorrect in the future. The way Seth assembled your words conveys that notion that you anticipate that to be the case. So, as usual, I think if someone wanted a direct answer to that question, they would have to ask you that specific question. With luck they would get an answer that was either a) I think the results will be shown in error, b) I think the results will be shown incorrect or c) I honestly don’t know.
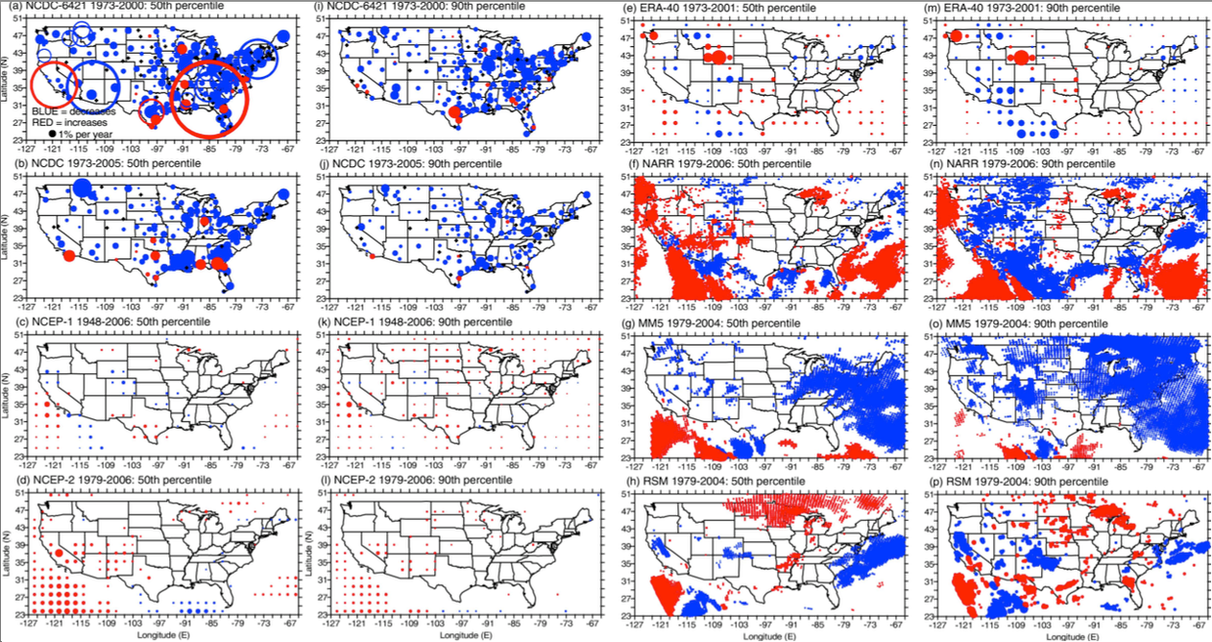
The article did answer the one questions I had which is: it appears that, whether or not you think the results will be shown incorrect, you believe the impact on power generation given the results exactly as reported might be relatively small. The reason is you think the spatial distribution of the decrease in winds shown figure 4(j) of the new paper shows lesser effect in the current high wind areas and greater effects in regions where we already can’t sustain wind generation.
I’m not sure I would come to a similar conclusion based on that figure 4(j) . I’d definitely come to a different one based on Figure 4(i) and a few others. All in all, if I wanted to estimate the impact, I’d need to get some underlying data and do some sort of analysis that accounted for the differential effect in different areas. (But honestly, I’d nominate Zeke to do it. )
It makes me laugh to see the main stream media including Seth Borenstein given kudos by the RC crowd, especially the line “mostly because journalists take the time to listen to what’s being said and follow-up if something doesn’t appear to make sense”. I nearly fell off my chair at that one. If that were really the case, then the coverage of the debate (because the science isn’t settled) would be more balanced. As it is, the skeptical side can hardly get a word in with the MSM.
It looks like GISS Model E was projecting a moderate increase in surface winds at US latitudes from 1975 to 2003.
http://data.giss.nasa.gov/work/modelEt/lat_height/work/tmp.2_E3Af8aeM20_1_0112_1975_2003_1951_1980_-L3AaeoM20D_lin/map.gif
Lots of contradictory material here. I imagine it comes down to the fact the temps are not increasing in the tropics (surface and tropopause) as predicted in the models. Absolute temperature differentials between the tropics and the high arctic are falling and hence winds are declining as well.
Bill-link no worky…
Lucia, Gavin,
Reading over the article certainly makes me a tad cautious about concluding anything firm from their results. The raw in situ data measurements seem to show significant declines in wind speed in many areas. However, the NCEP-1 reanalysis data set does not necessarily. So, the results you get differ substantially if you trust the in situ measurements or the reanalysis. The paper itself dances rather skillfully around supporting one or the other, simply arguing that “in contrast to temperature and precipitation, data sets of wind speed drawn from in situ measurements and reanalysis products exhibit substantial discrepancies both in terms of absolute magnitude and the sign of temporal trends over the last 30-50 years.”
It seems that measuring wind speed changes over time is a somewhat complicated task, and if anything digging into this makes me share Gavin’s skepticism that any firm conclusions should be drawn from these results. It seems a classic case of an errant press release exaggerating the conclusions of a paper that explores contrasting interpretations of complex data sets.
Observations and reanalysis 0000 UTC
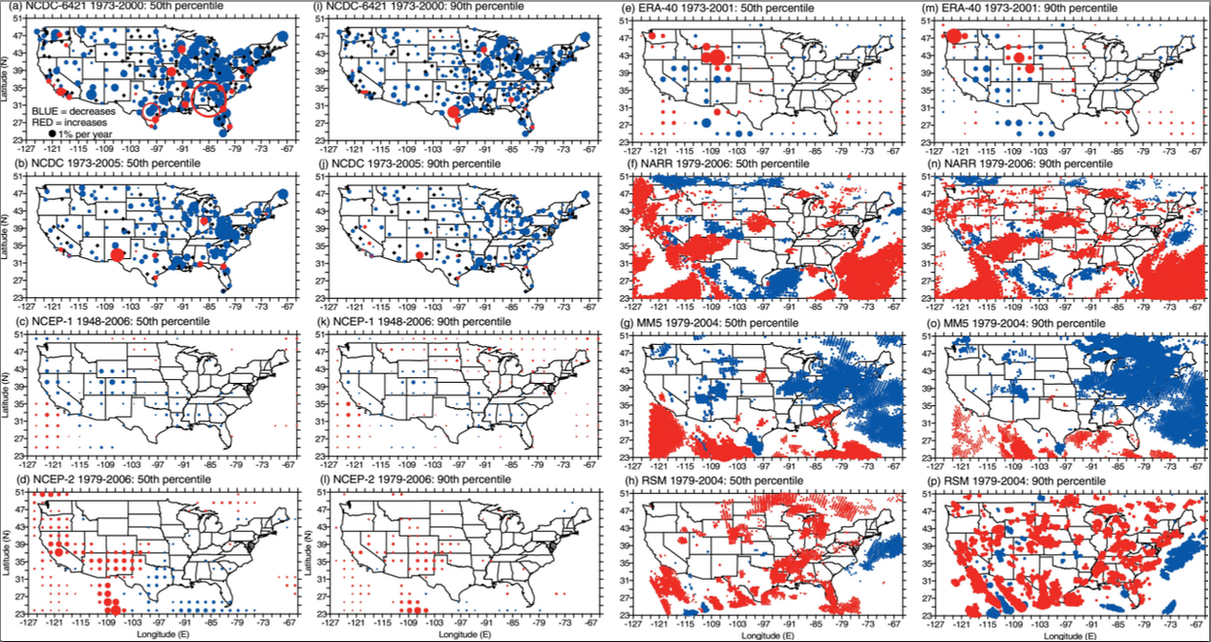
http://i81.photobucket.com/albums/j237/hausfath/Picture17-2.png
Observations and reanalysis 1200 UTC
http://i81.photobucket.com/albums/j237/hausfath/Picture18-3.png
Zeke,
I can absolutely confirm that measuring wind speed at at single locations over time is fraught with difficulty. Trees grow. Tree are chopped down. People erect buildings and no one specifically writes any researcher or inserts anything into the meta-data. I don’t think the wind speed sensors are affected by spiders building nests, but you’d be amazed at the various things that can go wrong with outdoor equipment that is supposed to run 24/7.
Oddly,it’s possible for wind speed to either increase or decrease at some monitoring station. This will be affected by the shape and location of any obstructions.
(BTW: I work on a project that involves met equipment deployed on towers at various military installations across the country. Things stay up and running thanks to efforts of technicians who make regular legally mandated rounds, constant online monitoring and a hotline system that permits local personnel to report problems. Constant outdoor measurements are difficult.)
If the difficulty of doing these measurements is Gavin’s concern, hey, I’m with him on that. I wouldn’t have quite said I doubt “that any decline in the winds that might be occurring has much of an effect on wind power.” Still, it’s not quite clear what Gavin told Seth. Seth wrote two lines which seemed to try to pack too many ideas into too few words. Neither of the lines appear to be quotes.
I’d say something like ” looking at the data we have (including the useful map Gavin provided), the decline in winds that might be occurring could reduce available wind energy by roughly 30% effect. That’s enough to make wind energy uneconomical in some instances. But, the declines indicated in the paper may or may not be occurring, and the regional locations may not dovetail with locations where wind energy is favorable. So, the declines that might be occuring may not have that strong over all effect. ”
But that would have exceeded Seth’s two sentence limit! (And I suspect whatever Gavin said did as well.)
Yes. Researchers are constantly asked to why anyone would fund a study to do this. The program manager at the sponsoring agency will want to explain why this matters. So, the researcher is probably in the habit of noting that a 10% change in wind speed will result in a 30% change in power. That makes it worth spending money on the investigation and it makes it worth reporting the result. The result is worth knowing even if the change in wind speed is determined to be 0. But the press release is going to emphasize the effect on power generation.
Interestingly, Mann jumped in with “the irony is that climate change could actually be counteracting the efficacy of alternative energy sources that might be necessary to move to a non-fossil fuel intensive energy economy.” at RC. Well… it could be affecting this alternative energy source. So… go nuke? 🙂
Zeke,
” It seems a classic case of an errant press release exaggerating the conclusions of a paper that explores contrasting interpretations of complex data sets.”
Doesn’t this happen all the time” in climate science?
Dave– I suspect it happens all the time in all research.
Seems like global warming will make global temperatures more “uniform”. Seems like more “uniform” global temperatures will generally reduce the potential and/or kinetic energy in the atmosphere. Less energy in the atmosphere seems to mean less “wind power” would be available overall.
Seems like one needs empirical evidence to “prove” the case — pro or con.
Yes, why even mess with wind power. Used on a large scale, for much less money, nuclear fission could solve a big chunk of all the “pollution” and energy cost issues for a few centuries — time to get hydrogen fusion on line and solve them forever. Or, so it seems.
I remember during the Paltridge debacle over humidity (See: http://www.climateaudit.org/?p=5416) That some stated in no uncertain terms that reanalysis data is very suspect. I have no opinion but doubtless people have doubts about the reanalyses.
Seems that Gavin won’t reply, I’m not surprised.
I have not read this paper, so I don’t know what instrumentation was used to arrive at the conclusions. That being said I agree with Zeke’s comments about it being a “complicated task”.
I’ll point out that measuring wind accurately over a long period is not easy, particularly because surface anemometers tend to be problematic by the nature of their mechanical design. Aerovanes are better, but still have some of the same issues.
For the traditional anemometer –
1) Cup anemometer accuracy is typically +/- 5% when new some are even less. It depends on cup size and how linear the detector is. Some are very non-linear at low speeds.
2) Anemometers, being mechanical, age, just like automobile engines, they are only good for so many revs of the engine before stuff wears down, affecting accuracy.
3) The most common aging problem of anemometers is dust/dirt accumulation in the bearings, which tends to slow them down. I used to have a collection of dead anemometers from the former California State Climatologist…the vast majority had sticky bearings. I’d use them as a prop then give them away to classrooms when I went out to give talks to kids.
4) Aging tends to affect low wind speeds more, by virtue of friction and by the fact that the lions share of wind measurements are at low speeds below 10mph. 40+ mph winds are not an everyday occurrence in many parts of the world. Easy to see in in plot of wind speed distribution. Of course there are exceptions.
So, depending on how good the instrumentation is to start with, and how well it is maintained, we might see the slowdown in wind caused partly by long term sensor issues.
If maintenance of NWS/NOAA wind equipment used in this study is anything like what we’ve seen for the USHCN network, I think the answer will be self evident.
Hmmm….the edit comment feature seems broken. I tried to fix a spelling error in the word “anemomter”, did so 3 times, none seemed to make any difference.
Odd, now that I added another comment, the fixes I put in during editing suddenly appear. Refreshing Firefox 3.3 browser before made no difference.
Anthony-When I first started commenting here way back in the orange days (very sporadically) I occasionally had the same experience. It’s normal and you get used to it.
Anthony,
I suspect the effect is the WP plugin I use to cache pages. Cacheing pages on the server side lowers CPU but can have “issues”. When a completely new comment is added, that triggers WP-SuperCache to make a new copy.
I miss the orange wiener dog.
A 10% drop in average wind velocity at a windmill site is going to cause more than a 30% drop in generated power. There is a minimum velocity for these thing to generate any power so the time periods of no power will be extended, such as when those big high pressure frigid anti-cyclones settle in in the winter and you really hope your furnace is working.
Gavin trusts the climate models (and he apparently knows more about their wind predictions than I do). But whatever he does with climate models, he’s apparently not involved with physics because it’s obvious that reducing a machine’s input by 10% will reduce the machine’s output by more than 10%. Machines always have losses, and a sail or screw in a thin fluid is always struggling to extract any energy.
I think you are comparing oranges and lemons with regard to Gavins comment.
Pryor is talking about supply Gavin about demand. As he (Gavin) references ‘Archer and Jacobson’, I think he had this section in mind,
Even if only ~20% of this power could be captured, it could satisfy 100% of the world?s energy demand for all purposes (6995-10177 Mtoe) and over seven times the world?s electricity needs (1.6-1.8 TW). Several practical barriers need to be overcome to fully realize this potential.
“Several practical barriers need to be overcome to fully realize this potential.” This is a fancy way of saying very expensive and possibly or probably impossible.
GaryP–
Sure. Turbines, like many types of power generating equipment, have levels of inefficiency that will depend on operating characteristics. I did ignore those here.
Squrrlly– If gavin’s notion is that potential wind power so greatly exceeds needs that a 30% decrease in potential wind power doesn’t matter…. well.. then he made that point, shall we say, indirectly? Maybe that’s what he means; or not. Anyone who wants to know for sure would need to ask him.
Lucia this has some wind farm power curves. It doesn’t appear that it ever gets to a |V|^3 law except at low wind speeds where the effect of overcoming static friction is probably more important, and of course at high winds, the power generated becomes nearly independent of the wind speed.
There’s also this cool calculator power curve calculator…
How about instead of decreased winds due to global warming we have global warming due to decreased winds? In this case “global warming” meaning an increase in temperature based on surface measurements.
It seems that less wind would have an impact on temperature trends due to less mixing.
Does that make any sense?
Well it’s actually a bit more complicated but one only needs to well define the words .
The available wind power is indeed proportional to V^3 what is quite easy to show .
Things complicate when one asks for recoverable wind power which is not only lower than the available wind power but also varies with the wind speed .
Once a turbine has been designed for a particular site , it will try to operate with a constant maximum efficiency for as large part of wind velocities statistically appearing at the site as possible .
So that means that in a curve like Carrick is showing and which shows RECOVERABLE power and not available power , the beginning of the curve will approximately follow the V^3 curve .
But as that implies increasing the rotor angular velocity proportionaly to the wind velocity , the rotor turns faster and faster .
So above a certain wind velocity (generally around 10 m/s) , the turbine goes over to a constant power output mode (constant angular velocity) and the efficiency plummets .
Then above a safety limit , the turbine shuts down .
.
Now as the original question can be understood by how much varies the RECOVERABLE energy (f.ex in a year) when the wind velocities vary by 10% then the right answer is :
It is a time weighted average of the wind interval [0,10 m/s] where the recoverable power drops by approximately 30% and the interval [10 m/s , limit speed] where the recoverable power is constant .
So it is less than 30 % and it depends on the form of the approximate gaussian that gives the wind speed distribution on a particular site .
F.ex if we had a narrow gaussian with a maximum around 10 m/s (what means that the winds blows around 10 m/s all the time and rarely below or above) then the 10 % wind decrease would have a very small impact on recoverable energy and if we had a broad gaussian with a maximum below 10 m/s the loss would be nearer to 30 % .
Bill Jamison
“It seems that less wind would have an impact on temperature trends due to less mixing.
Does that make any sense?”
Of course . Slow down the fans in your computer and you will see what the impact on your global computer temperature and from there on your blog activity will be 🙂
TomVonk:
First it can be anywhere from V^2 to V^3, only an ideal wind turbine would ever give the full V^3 exponent.
And more importantly, not what measurement says.
In the range of wind speeds we are talking about, the wind power is nearly independent of the wind speed.
Also, I understand it, for the eastern slope of the Rocky Mountains, the mountain lee effect (referring here to a stable low pressure zone on the less side of the mountains) is more important for the stable wind flow there than equatorial-polar temperature differences. That’s why they are talking of putting the major wind farms there.
Carrick,
I clipped figure 7 out of the power graph you had and super imposed some lines so I could read the trend. At 5 m/s I read roughly 2,000 kw and at 10 m/s I read roughly 15,000. That’s close to the factor of 8 we’d get for a cubic variation.
In practical installations, the designers do impose a top speed to prevent damage to tower. So, no real machine of any sort ever follows an idea curve. The efficiency of a real turbine will vary with wind speed. In the case of wind turbines, this is designed in, as Tom noted. ( Recognizing this, I tagged on “Of course, both estimates assume the turbine maintains the same level of efficiency to convert wind energy to power at both speeds. ” at the end of the post.” I didn’t go on to explain why this is never true for an already built turbine operating at it’s top capacity.)
So, Tom is correct that I was discussing recoverable power and you are correct that what I was describing was operation of ideal towers.
But it’s difficult to figure out the correct way to simplify a blog discussion. But, the fact is, available power in a location goes as V^3. If wind speeds differ in different locations, engineers will design somewhat different towers. So, if the average wind speed did increase across the US, and engineer designing a new plant would want to take advantage of the higher local velocities and recover that power. To do so, they would design towers that wouldn’t be damaged when operating at higher speeds.
Obviously, another engineer running and existing plant would still need to put the brakes on an existing tower to prevent it from being damaged if the winds get too high. So, the more complete reality is:
* For existing plants if the wind decreases, the turbine will generate less power. (Unless they had been designed to not take advantage of the local wind level in the first place.) If the wind increases, there will be little increase in power generated because the turbines aren’t sturdy enough to take advantage of the potential power.
* For future plants that have yet been developed, the available power goes as V^3. The engineers can design new plants to dovetail with the known wind velocity levels.
Yes. There are two separate questions:
1) What is happening to the wind levels and what causes them to vary? and
2) If they do vary, how does that affect the potential for wind energy.
My post really only addresses (2).
This may sound simple but, why doesn’t someone just ask the power companies with wind turbines to provide their operating rate and turbine speeds over the last few years of operation independent of mechanical breakdowns. If the turbines are experiencing a decline in the amount of wind available to produce power it should show up in their output numbers over time. There must be thousands of turbines in a variety of geographic locations.
Thanks
Ed
Edward–
I suspect the authors of the paper didn’t do it that way for a number of reasons:
1) They want to know the potential for wind energy in places where there are no turbines.
2) The actual conversion rate is affected by the specific design of existing towers. Newer designs are possible. In particular, an engineer designing an brand new plant can optimize for the local wind. So, data on power curves from existing plants isn’t sufficient to find the answer to (1) while data on wind speed does give that information.
I also suspect someone, somewhere does have information on the conversion rates of existing facilities.
Lucia, here is a little more complete analysis of the power-law exponent
for wind generated versus wind velocity.
Note the blue line is the exponent and the red line is the total power generated. (Details on how I generated the exponent forthcoming if need be.]
You see exponents of 3 only for wind speeds below 5 m/s. At the expected operating point of V=10 m/s, the coefficient is only 2.2.
Um… Two corrections. The exponent is roughly 3 for |V| < 8 m/s (not 5 m/s as I stated).
And sorry about the hanging HTML tag.
I tried to fix it but it didn’t stay fixed.
Carrick–
Thanks for the graph.
No one is disagreeing with you that for installed designs, the efficiencies drop with wind speed. The result is the power generated does not vary as V^3 forever for any specific design. In particular, engineers design any individual tower to give constant power above some limit; this is done to prevent damage to the equipment. So, there will always be a velocity above which real power does not vary as V^3. To do otherwise is a waste of materials and energy.
The design speed will be tailored to the amount of wind expected at a location and the available power varies as V^3. You read this value off an operating characteristic for any tower or plant.
The problems of AGW can be summed up in Gavin Schmidt’s apparent assertion that models trump data.
Anthony, I’ve had a similar problem with the edit function. It doesn’t seem to display the changes, but it does take them. Look at the entry for your comment in Recent Changes on the right side of the page and you should see the edits there. Eventually they show up.
On a slightly different topic the VORTEX2 tornado hunters seem to have had a poor hunting season with few targets in their search area. Related?
Seth Borenstein gets a few words in on RealClimate here.
http://www.realclimate.org/index.php/archives/2009/06/winds-of-change/langswitch_lang/bu#comment-126887
It turns out Seth Borenstein’s article was entirely accurate and neither gavin nor mike were quoted out of context.
Bill…. Yes. It appears their first take on the article was not in total agreement.
At least at the time each responded to Seth, they appeared to disagree on whether or not the paper shows the winds slowed, and they disagreed on whether or not this would impact wind energy project.
Do they agree the results may not be due to climate change? Sure. But that’s not quite the same as agreeing on what Seth asked them and it’s not what they focused on in their responses to Seth.
It appears they felt embarrassed to seem to disagree in public. But they did disagree on some issues and those were the ones Seth was writing about.
My estimates propose a ~20% drop in wind power generation when average wind speed drops by 10%. I used standard multi-megawatt wind turbine power curves, v_mean=7m/s and Weibull PDF (shape factor 1.8).
Hi Robert,
This is the article I spoke to you about.
George