In comments, a reader asks me to comment on Tamino’s recent posts about surface temperatures. My first response is that I have been skimming them. The reason is that, while I am interested in the quality of the surface temperature records, I have never been interested in actually doing all the tedious work required to create one myself. I leave that to those motivated to do that.
Due to my interest, I have been reading the various comments about problems that might screw the record up, result in uncertainty or bias, and I do comment from time to time. For example, I commented on why rounding to temperature readings from individual stations to ±1 C should not affect our ability to estimate trends.
So today, I’m going to comment on results posted by two different people: Tamino and Roy Spencer. Each addresses slightly different questions. Both present results that they admit are, in some sense, preliminary. Both are interested in determining whether the loss of stations from 1980-1990 biased the determination of station trends.
- Roy Spencer replicates CRU since 1986.
If I understand his post correctly, Roy has used the satellite to determine temperatures at the locations sampled by CRU and then averaged to discover whether he replicated CRU. This is a useful test to discover whether the satellite replicates surface readings when the satellite samples in the exact locations where surface thermometers are deployed.Update: 6:51 pm. [If I understand his post correctly, Roy intends to devise a method to use satellite measurements to determine the monthly surface temperatures. In what I suspect is a preparatory step, he is computing a surface temperature series based on thermometers. Owing to the controversy surrounding the reduction in stations from 1980-1990, he compared a series he computed using a constant number of thermometer and compared that to CRU. ]
Doing this, he gets a very good replication of with a correlation coefficient of 0.91 for monthly temperature values.
The agreement is illustrated this figure take from Roy Spencer’s blog:
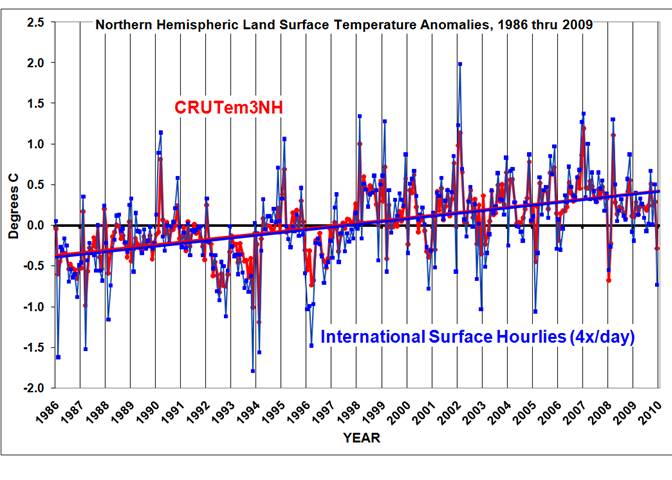
If I understand correctly think Spencer maintained a constant number of stations throughout his computations. If so, his good agreement tends to indicate the loss of stations in 1980-1990 doesn’t matter. Roy himself reports
But at face value, this plot seems to indicate that the rapid decrease in the number of stations included in the GHCN database in recent years has not caused a spurious warming trend in the Jones dataset — at least not since 1986. Also note that December 2009 was, indeed, a cool month in my analysis.
- Tamino appears to have computed pre-1980 trends using the subset of stations retained after 1990 and compared those result to the trends computed using the full complement of stations operating at any time. If removing stations biased the result, you would expect to see these two computed trend diverging.
The two results are compared in this figure taken from Tamino’s blog:

Tamino finds they do not diverge saying:
Of course, I’ll continue processing grids until I cover the entire GHCN, and report the results for the entire globe. But so far, the results flatly contradict the claim that the station dropout has introduced an artificial trend into the global temperature time series. We are not surprised.
I have no particular interest in auditing these results to see whether I would get the same results if I did the exact same thing. What I can note is that we have two completely different people using two approaches, on entirely different points in the “activist-skeptic” spectrum both reporting that loss of thermometers in the 80s and 90s does not appear to have biased the surface temperature record in a way that would bias trends in any significant way.
Am I surprised?
I am not surprised that Tamino discovered dropping out stations did not bias the trends for temperature anomaly. If all other things kept similar (i.e. station quality, measurement system, area averaging, etc.) the first order effect of dropping out samples should be to make an area-averaged temperature anomaly noisy, without introducing any particular bias.
This is not to say that bias cannot possibly be introduced when the number of stations contracts drastically. It was a question worth asking and investigating. However, it is an issue where, betting people should expect to increase noise, not bias.
So even though Tamino reports he is using coarse grids and has not yet analyzed trends for the entire surface of the earth, (as one would expect if the work is being done as an “work at home hobby project on my own personal computer”) the results he is reporting are more-or-less what I would have expect before anyone did all the tedious number crunching. This is not to say that there could never have been any surprise nor that there could not possibly be surprises in the future: Maybe further work will reveal something else.
However, for reasons stated above, I would be surprised if any strong warming or cooling bias had been introduced by station drop out.
I expect that further refinements of grid size, or any other approximation Tamino will continue to find that dropping out the stations did not result in any appreciable bias one way or the other.
I am more surprised that Roy is getting the same results as CRU!
The reason I am a bit surprised is rather subtle: Roy is using an entirely different measurement system. So, in his case, he might have gotten different results because it turned out that the satellite didn’t resolve the temperature at surface stations correctly, or because barbecue grills near the surface thermometers really were affecting the overall trend or for various and sundry reasons.
In addition to suggesting station drop out had little effect on detection of climactic trends, Roy’s close replication of the surface measurements suggests these other issues are also not dramatically affecting the trend since 1986.
Roy reports that he is continuing work and will be reporting more; Tamino says he will also be reporting. Meanwhile Chad seems to be examining station trends as well. We’ll learn more as they each report.
Update: I’m closing comments on this thread. Please continue at:
new thread
The close match with the UAH data is pretty compelling evidence that any UHI effect has not been removed by CRU.
Raven–
Why do you think that? Roy doesn’t think so.
All temperatures measured by the satellite will include any effects from land use change (a.k.a. UHI). If the data that includes UHI effects matches data that claims to not include UHI effects then that must mean that 1) UHI effects don’t exist or 2) The UHI effects were not removed.
BTW: Roy says this:
Of course, an increasing urban heat island effect could still be contaminating both datasets, resulting in a spurious warming trend.
Raven–
Ahh… I see what you mean.
If so, then I imagine when Roy computes surface temperatures without matching CRU stations, we’ll learn a lot about all these UHI arguments. That would be very interesting both from a policy and science perspective.
So…. we’ll see!
Raven (Comment#34949) February 25th, 2010 at 5:49 pm
I would have thought it would lead to the opposite conclusion. The satellites are not ground level readings.
bugs,
Roy is creating ground level measurements from satellite data. It will inlcude UHI.
The analysis was also since 1986, anomolies take care of much of the UHI influences.
Lucia,
Perhaps I’m missing something here or completely misunderstanding, but Roy Spencer says he is creating a surface station data set from the NOAA International Surface Hourly data set –
‘Our new satellite method requires hourly temperature data from surface stations to provide +/- 15 minute time matching between the station and the satellite observations. We are using the NOAA-merged International Surface Hourly (ISH) dataset for this purpose.’
I understand that to mean that this is ground station data that will be used in the future to match against his satellite data, and he is surprised that this matches closely with the CRU dataset when he compares?
Carefully reading Roy’s post, I do not think that this is satellite data at all, but rather the station data which the surface temperature channel would be calibrated with. I note, contrary to Raven’s statement, Roy says:
“Our method will be calibrated once, with no time-dependent changes, using all satellite-surface station data matchups during 2003 through 2007. Using this method, if there is any spurious drift in the surface station temperatures over time (say due to urbanization) this will not cause a drift in the satellite measurements.”
Roy has not yet shown the results of the Aqua analysis compared with the International Surface Hourlies, which of course could still have biases in them as they are stations, not satellites.
So will Watts now apologise for his incompetence and lies about ““SURFACE TEMPERATURE RECORDS: POLICY DRIVEN DECEPTION?—
http://tamino.wordpress.com/2010/02/15/dropouts/
Re: Chuckles (Feb 25 18:27),
Just before the part you quoted, Roy says this:
I have assumed — possibly incorrectly that –the “NOAA-merged International Surface Hourly (ISH) dataset for this purpose.” has something to do with information obtained from “the Aqua satellite AMSU window channels and “dirty-window†channels. These passive microwave estimates of land surface temperature,”
Have I misunderstood?
Andrew_FL & Chuckles.
Yes. I think you are right. He must be doing this in preparation for comparing with his new aqua satellite based method.
He is finding that the change in station numbers doesn’t make much difference. I’ll strike out to reflect this!
[quote bugs (Comment#34976) February 25th, 2010 at 6:33 pm ]
So will Watts now apologise for his incompetence and lies about ““SURFACE TEMPERATURE RECORDS: POLICY DRIVEN DECEPTION?â€â€
[/quote]
.
I believe that Dr. Christy is siding with Watts in the sense that he feels there is concern station siting could be causing bias.
.
If this is the case, it would seem Dr. Christy does not consider Dr. Spencer’s work to be conclusive.
‘Have I misunderstood?’
Lucia,
No idea, but my reading was that he was indeed going to be using that aqua sat data, but that it would require some ground station data to validate/calibrate the sat data, and he was downloading the ISH data in anticipation of that.
The ISH data is apparently from 1901, so if it is a satellite data set, some governments somewhere have REALLY been hiding some stuff from us.
I got the impression that the HADCRU check was simply a sanity check to see that he was getting some sort of real data, and he was surprised at the numbers.
He also made a brief comment –
‘I also recomputed the Jones NH anomalies for the same base period for a more apples-to-apples comparison.’
which might just mean some subsetting rather than subsampling, but who knows?
I just hope as many people read this blog (and other) as watched the prime time TV broadcast where D’Aleo and E.M. Smith said that NOAA “is seriously complicit in data manipulation and fraud†by “creating a strong bias toward warmer temperatures through a system that dramatically trimmed the number and cherry-picked the locations of weather observation stations they use to produce the data set on which temperature record reports are based.â€
Hell, even simply comparing raw station anomalies (without any spatial gridding) would have shown them that they were probably barking up the wrong tree:
http://www.yaleclimatemediaforum.org/pics/0110_Figure-23.jpg

Chuckles–
I now agree with you. It appears “NOAA-merged International Surface Hourly (ISH) dataset for this purpose.” is a ground based thermometer set.
Bugs–
Sorry, but you don’t get to gloat quite a much yet. Since I was mistaken Roy using the Aqua satellite, that means that the agreement doesn’t tells us anything about whether the barbecues, moves to roof-top etc make little difference.
But Roy’s analysis does suggest that the drop in station numbers didn’t result in a bias.
Zeke–
Was the show on cable? I don’t get that. 🙁
Is it on youtube? or Hulu?
Lucia,
Yep, its a cable channel: http://en.wikipedia.org/wiki/KUSI-TV
I blogged a bit about the broadcast at the time: http://www.yaleclimatemediaforum.org/2010/01/kusi-noaa-nasa/
Here is a video of the part in question: http://www.kusi.com/weather/colemanscorner/84174357.html
And the final puzzle was this comment by Dr. Spencer –
‘Note that the linear temperature trends are essentially identical; the correlation between the monthly anomalies is 0.91.
One significant difference is that my temperature anomalies are, on average, magnified by 1.36 compared to Jones. My first suspicion is that Jones has relatively more tropical than high-latitude area in his averages, which would mute the signal. I did not have time to verify this.’
which I will leave for others to interpret.
Isn’t it the case that you can introduce bias by oversampling? If so, perhaps this is the reason so many stations in the U.S. are being dropped. There were far more U.S. stations than anything else before the drop.
.
But regardless of the math, it’d be nice if we were told why they were dropping stations to begin with, rather than trying to guess the reason for it.
magicjava,
Stations aren’t dropped per se. To understand the “dropout” issue in GHCN, you have to look at how GHCN is compiled and where the temperature data comes from. A good portion of the historical temperature data were compiled from around the world during an effort by the WMO during the 80s and 90s to acquire surface temperature records from more remote areas. During that period of time, the WMO worked to identify a network of 1300 or so stations with good spatial coverage that could provide monthly temperature updates (called the Global Surface Network – GSN). Governments of the respective countries are in charge of filing reports (called CLIMAT reports) to the WMO, which supplies the data to the NCDC to incorporate into GHCN after basic quality assurance tests. Since 1990, there has been no major effort to collect data from remote stations outside the GSN network (with the exception of USHCN), though some scientists believe that it is time to do another round of updates. However, numerous studies have found that the GSN faithfully estimates global temperature (with the exception of Antarctica, which has its own network of stations).
So the “drop” in stations around 1990 reflects the date at which the last major effort to collect station data outside the GSN network was undertaken. I would argue that, a decade or two from now, the number of stations available for the 1990s and 2000s will probably exceed the 6,000-station peak reached in the 1970s. I’ve heard through the grapevine about plans to undertake a new effort to collect data from stations outside the GSN to update GHCN with more remote station data.
The key things to remember is the fact that GHCN is a retrospective compilation (e.g. there weren’t 7000 stations reporting to the GHCN in the 1970s) with only a representative subset (GSN) reporting regularly.
Re: magicjava (Feb 25 19:23),
Hypothetically, if you were computing the average surface temperature without doing some sort of reasonable area weighting, and then you added or subtracted thermometers, sure. Or maybe if you suddenly had loads of dropped grids in locations that were warming or cooling more than other places.
But the former really was never much of an issue since CRU, GISS, NOAA etc. did area averaging. The latter is something that could hypothetically occur. That just means you ask the question, then you check. The question was asked. Enough people asked that Roy and Tamino both were motivated to check. Their first cut says the bias isn’t happening. It looks like Zeke did something a bit less elaborate and he finds the same thing.
My guess is budgetary restrictions along with information that suggested the main factors limiting accuracy in whatever they wanted to observe or predict was not improved by increasing the number of thermometers above a certain level. Scientists and engineers optimize number of sample locations, vs. data rates vs. accuracy of individual instruments vs. cost in experiments all the time.
On UHI, see
A Pending American Temperaturegate By Edward R. Long see February 24, 2010
Such pairing of urban vs nearby rural sites may be particularly helpful for establishing ground truth temperatures for Roy’s satellite calibration. The 0.47 C UHI effect is a major portion of the IPCC’s 0.7 C rise for the 20th century.
magicjava (Comment#34981)-I wish more skeptics would make an effort to separate the issues with the surface data out. Spencer has ONLY refuted the argument that station dropout is biasing the trends. This does NOT mean that the data do not have urbanization, siting, and other biases.
John believes that he and his colleagues have shown that the surface data exaggerate the real warming. This is based not on the dropout of stations but extensive analysis of data available in certain regions and comparison with LT satellite data. This is elaborated on in Klotzbach et al and several other papers.
I used GHCN data and CRU gridding and global averaging scripts to do a similar analysis. I saw no reason to believe that dropping high alt, high lat or rural stations caused significant changes in the surface record. And of course, for the last 30 years, we have very similar numbers for both troposphere and surface records.
GHCN: High Alt, High Lat, Rural
http://rhinohide.wordpress.com/2010/02/01/ghcn-high-alt-
high-lat-rural
Welcome to the climate blogging world Ron; I haven’t had the pleasure to visit your site before, but I definitely will in the future.
Nobody should expect dropping stations (even if there is a altitude and latitude bias ) to introduce a bias into the mean.
If GISS does things right ( TEST WITH GISS) the anomaly method should handle this. speculating about this is fun, but the real test should happen with GISS code.
What will change is the noise; the mean??? probably not,
Steven,
I think the mean would be biased over time. If the high northern latitudes are warming faster than anywhere else and the lower atmosphere is warming faster than the surface, then there might be a detectable difference in trend. Might not amount to much though.
Raven:
This comment is based on a misunderstanding on your part about the UHI.
The purpose of the UHI correction in surface temperature measurements is not to remove the influence of urban environments (which is a real effect) but to prevent the introduction of spurious warming, either through shifts in microclimate or through over sampling of the urban environment.
On another point, if you look at the way CRUTEMP grids and averages data, it is easy to show that the drop in stations since 1980 should have no effect on their final answer. One way to do this is to look at mean latitude of the land-based stations using the same weighting they use to compute the global average.
Figure here.

The main effect of shifts in mean latitude is due to the fact that the temperature trend (what I call “Tdot”) increases as you move closer to the North Pole:
If you do an unweighed average (e.g., Smith’s approach), then dropping arctic stations will decrease the temperature trend for the recent years. Isn’t this the opposite of what Smith claims though?
(Note that this figure suggests the CRUTEMP algorithm introduces a positive bias to the the warming trend for the early 20th century.)
Latest post on SPPI regarding UHI effect
http://scienceandpublicpolicy.org/images/stories/papers/originals/Rate_of_Temp_Change_Raw_and_Adjusted_NCDC_Data.pdf“>
Edward R. Long is a physicist who retired from NASA where he led NASA’s Advanced Materials Program,
SUMMARY
Both raw and adjusted data from the NCDC has been examined for a selected Contiguous U. S. set of rural and urban stations, 48 each or one per State. The raw data provides 0.13 and 0.79 oC/century temperature increase for the rural and urban environments. The adjusted data provides 0.64 and 0.77 oC/century respectively. The rates for the raw data appear to correspond to the historical change of rural and urban U. S. populations and indicate warming is due to urban warming. Comparison of the adjusted data for the rural set to that of the raw data shows a systematic treatment that causes the rural adjusted set’s temperature rate of increase to be 5-fold more than that of the raw data. The adjusted urban data set’s and raw urban data set’s rates of temperature increase are the same. This suggests the consequence of the NCDC’s protocol for adjusting the data is to cause historical data to take on the time-line characteristics of urban data. The consequence intended or not, is to report a false rate of temperature increase for the Contiguous U. S.
Surely this is like any other sampling problem.
Lets say we are sampling cities and plotting the incidence of reported diseases. We go from a few tens to a few thousands and back to a few hundreds. As we do so, we plot that the incidence of a certain disease has risen over time, very much in the last 50 years, which also coincidentally is the time of the sharpest decrease in the number of cities reporting. Or at least, included in our sample.
It is a perfectly reasonable question to ask, whether the sample has remained equally representative at all times. Whether over representation of some locations may have occurred. Whether the larger cities may have changed in ways that affect infection rates more than smaller ones, and whether the sampling reflects this.
It seems that the onus is on those who think that homogeneity has been preserved during these large movements of the sample to prove it. Those being asked to spend huge amounts of money partly on the hypothesis that it has, may be excused for saying, show me.
It’s a pity that Tamino didn’t compute (or at least didn’t publish) the 20th century trends for both his data sets. Because I would have thought that cooling the 1920s-1930s by 0.25 degrees and warming the late 1980s by the same amount (as shown in his graph) would indeed introduce a warming bias to any “20th century trend” calculation?
Nobody is saying (except some perhaps as a strawman) that dropout explains the entire warming trend. But if there’s a small trend from dropout, a small trend from UHI and a small trend from “adjustments” then together these could be making a significant part of any observed overall trend.
Personally I’ve no idea whether station dropout is an issue, and it’s marvellous that people are investigating it. And it may well be that when you run the numbers these anomalies don’t make for a significant trend. But if his object is to convince people that it doesn’t, then he probably ought to show it and not just state it.
Haha. Temperaturegate now? Is there any word that climate conspiracy theorists will not add “gate” to?
Edward Long needs to read the literature. Yawngate.
Phil A (Comment#35103) February 26th, 2010 at 5:54 am
There’s the rub. There is no end to the issues that can be raised for investigation. Then demand the scientists prove it wrong.
Lucia:
Thank you for taking a look.
As always, I learned something useful from your work.
Is ground temperature (as opposed to air temperature) measured at a depth of, say, 10 feet a good representation of average air temperature? I’ve been thinking of getting a geothermal heating system and according to the literature I’m looking at someone has mapped the “mean earth temperature” of the US. Chicago is around 51 F. Perhaps ground temps would provide a way of checking whether the adjustments being made to station data were valid.
http://www.geo4va.vt.edu/A1/A1.htm – Figure 2.
Re: Chad (Feb 26 01:30),
Chad– yes. Bias can happen in the way you describe. That’s why I said the first order effect is noise. But Bias can happen. That’s why suggesting the possibility of bias is is not stupid, and checking is wise.
HankHenry (Comment#35113) February 26th, 2010 at 7:00 am
Good question~! especially if you think you can take the temperature of the planet; all that should matter.
You can google for data like that. “soil temperature” http://soils.usda.gov/use/thematic/temp_regimes.html
Steve Short:
“…consequence intended or not, is to report a false rate of temperature increase for the Contiguous U. S.”
Yep!
Seriously I don’t believe anybody can take the planet’s temperature let alone give it an “average” temperature by tenths of a degree. I don’t believe it’s possible to be accurate at all. I think it is misleading people and scaring them for no reason.
Re: Phil A (Feb 26 05:54),
Your right. There are a list of things that could cause bias and uncertainties. Dealing with one at a time makes things more tractable. That’s why I discussed the ±1C rounding issue with a ‘toy’ model (and chad did more involved analysis with data from models– rounding it then computing trends.) This is the easiest one because it can’t affect the computation of climate trends– it’s just buried in noise.
Then people can address the station drop out– Roy, Tamino, Zeke etc. did that. That’s a more difficult issue that the ±1C rounding because while it’s unlikely to be a huge effect, it’s not impossible. So, you really, really have to check. It looks like both Tamino and Roy are doing thorough jobs on that, and Tamino appears to be considering incorporating an suggestion by RomanM.
Urban Heat Island, rural/urban adjustments and station quality are the difficult issues. Addressing the first two just gets us to the point about arguing whether or not these have been dealt with properly (and whether it’s even possible to do it right.)
Re: bugs (Feb 26 06:47),
You know what the process of endlessly raising issues that to be investigated is called? Part of the scientific process!
‘You know what the process of endlessly raising issues that to be investigated is called? Part of the scientific process!’
Lucia,
I would suggest, exactly as we were doing at the beginning of this thread with regard to Dr. Spencers’ work?
Chuckles– Precisely.
Roy Spencer also noted
NOW…in retrospect, I’m surprised no one asked the following question:
If the monthly temperature anomalies are, on average, 36% larger than Jones got…why isn’t the warming trend 36% greater, too? Maybe the agreement isn’t as close as it seems at first.
Steve Short,
This result is very interesting; however, I have a few questions for the author:
1) What was the selection criteria to choose 2 stations per state. Can it be randomly varied to get ensembles?
2) Why “publish” this at SPPI? Did he try GRL and was rejected?
liza (Comment#35119) February 26th, 2010 at 7:27 am
Another curious thing. The average temperature of the oceans (considering total depth) is something like 4 C. We hear a lot about the greenhouse effect. What effect is it that cools oceans below average surface temperatures?
Dear Lucia, I know this is the wrong thread but I hate the fireworks on the others. The question I want to pose is, has Judith Curry opened wounds towards a possibility of civilized discourse or, inadvertently, rubbed salt in those wounds. Some of the rhetoric I find quite upsetting and think ‘is this the best we can do?’ Anyway, sorry for intruding in the quiet space of real thought!
Lewis
Lewis–
Actually, I think she is trying to get voices heard by an audience outside the blogosphere. She recently presented to the NAS(?) or someone. I could be mistaken, but I suspect she is hoping to get people who are positioned where they could possibly influence changes to
a) Recognize that strategies based on the assumption that skeptics are a monolithic block of people funded by the some climate-denial machine are not going to work.
b) At least some of the responsibility for loss of trust lies on the side of funded scientists. (This is true even if all they was act in a way that created a perception of misbehavior.)
c) That many of the steps to fix the loss of trust must be taken by scientists and that those steps and finally,
d) maybe get them to consider steps they could actually take.
As I said, I could be wrong. Maybe I’m projecting what I hope she is trying to do!
[First attempt possibly lost in cyberspace, so please delete if this is a repeat.]
I am much more surprised that Spencer’s result matches CRU so well. Why? Because he used an entirely different source of raw data. He used the rawest of the raw, most likely including some different stations, with no quality control, no adjustments, no nothing, and he still got such a close match to CRU? That’s something.
Tamino, on the other hand, started with the same raw data as GISS, and got about the same results as GISS. This isn’t terribly surprising. The GISS processing is very basic, if tedious. There are differences between Tamino and GISS (how to combine stations, grid coarseness, interpolating to a point or averaging within a box, UHI correction, etc), but we already know that the ‘answers’ are not terribly sensitive to those choices.
Mosher: No, you don’t have to use the exact GISS code to comprehensively show the most basic point. In fact, you don’t have to even do what Tamino did. You just have to know how the reference station method works, and then you’ll know that dropping a cold station won’t automatically make the remaining average warmer.
As for undersampling: I was a little surprised that Tamino’s two subsets matched so well. But that could still allow that both subsets were undersampled in the same way. If Congo/Zaire is missing in both sets, then they’ll both have the same undersampling error. Actually, this is a place where doing a more faithful emulation of GISS would be helpful, as the linear interpolation comes into play.
Speaking of faithful emulations of GISS: http://clearclimatecode.org/the-1990s-station-dropout-does-not-have-a-warming-effect/comment-page-1/
There’s something not quite right about all this concern about trust. In a scientific argument “Trust me” isn’t a great point made. The fact there is now a need says alot.
No, Lucia, I think your right. ( NB I think it was strange we got Leo’s Guardians’ right to reply first before Judiths’ article, which I haven’t actually seen published in the said paper) (My apostrophes are terrible!) In other words, she wishes that the, sometimes, insular world of academia might learn to face outwards to a world that really would trust if they felt they where having it straight. What a sentence! I like her for it. Anyway, this should be on another thread, no? But it all makes me nostalgic for a few years back when one could catch a SteveMc blog and follow the sometimes abstruse, opaque, too and throw of ‘r’ and ‘variant’ this and that. O those quiet days!
Re: carrot eater (Feb 26 10:35),
Looks like the guys at clearcode did it! 🙂
This is actually making the case for transparency. Because GISSTemp was released, the people at CC were able to rewrite it and verify their version gives pretty much the same results. Because they now have a version they like to use, with features that let them easily play around, they have quickly run this test. They don’t have to try to pester people at GISS to drop whatever the GISS staff are expected to do by program managers to fulfill the curiosity of bloggers– they just run their code. They post the results– it shows that dropping stations didn’t bias the trends upward.
This is cross-posting a bit, but:
I see it this way: the ccc guys are building basically a perfect emulation. But there’s also a small army of guys building their own versions from scratch. Which clearly shows that you don’t need to copy somebody else’s code; just be willing to do some work. The different people are making different decisions, adding different features; all adding their own touch.
So whenever a sceptic claim comes up, the response time will be shortened to a matter of days, or even hours. My regret is that the sceptics should also write their own code, so that they are more able to identify real problems, instead of wasting everybody’s time with “dropping cold stations makes it hot”.
The main missing link now is an emulation of the GHCN adjustment. I don’t suggest anybody bother right now, because they’re in the process of changing that adjustment. But it will be similar to the homogenisation in USHCN v2.0, which is a bit complicated, but seems well enough described in Menne/Williams 2009, and the code is now public.
Lucia
See another statistical wiz exploring temperatures:
RomanM at Statistics and Other Things
e.g.,
Comparing Single and Monthly Offsets
(apparently Tamino was not amused.)
David Hagen,
Actually, Tamino agreed with him: http://tamino.wordpress.com/2010/02/25/false-claims-proven-false/#comment-39888
However, its an argument about the best way to improve the method used to combine stations. It has little direct bearing on the whole “dropping” issue, since you will generally get the same result as long as you use any spatially weighted anomaly method.
Re: carrot eater (Feb 26 11:29),
On the ‘release the code’ issue, I’m actually not in the big “release any and all code under any and all circumstances” camp. I think some codes should be released sometimes– and at certain points. There have actually been discussions of that, and Chad, Mosher, Carrick and I all have somewhat different points of view.
On “release the code”, I’ve been a supporter of the notion CRU should release there code– for reasons that are too involved to explain in a comment here.
I don’t think the benefit of releasing code is for people to copy code. It has other benefits. Oddly, some are no more than PR benefits. In other cases, it can enhance communication. Of course only people who add their own work to codes can do anything ultimately useful.
See the benefit? 🙂
I think dealing with the UHI and poor station citing issues may take longer– but still not that long. Someone might want to keep a bullet list of the arguments, and how the have been responded to at blogs and in articles, that will help.
The arguments I know of:
* ±1 rounding of t-min/ t-max means precision in anomalies can’t be better than ±1C.
* Losing thermometers makes a difference.
* Urban vs. Rural — Urban Heat Island:
* Poor station sitings (i.e. the BBQ grill issue)
* How is homogenization done and how much uncertainty is involved in this? Does bias creep in when this is done?
Are there others? To my mind, the final three have always been the difficlut ones. They also interlace!
Re: Zeke Hausfather (Feb 26 11:40),
Your comment sounds about right to me. That’s why I previously said I can’t really comment on whether Roman is “right” or “not right”. Sometimes a method is sufficient for discovering an answer even the method is not perfect and/or someone can think of a better method.
Roman’s method may be much better for gettign minimum noise, low bias time series. That would be very useful for testing whether models are consistent with an observed time series (because noise in the observed series makes it more difficult to get “rejections” with similar amounts of data.) But Tamino may not need to get the lowest noise/ lowest bias time series to show dropping thermometers doesn’t matter, and if he’s on a roll, not worrrying about that for now makes complete sense.
Lucia: I strongly feel that somebody could have easily written a very good GISS emulator, well before they released the code. In fact, releasing the code probably slowed things down, as it was in such a messy condition. Writing a new GISS from scratch would have been faster than doing what the good ccc guys are doing, though it would not have been 100.000% perfectly matching. GISS really doesn’t do anything that sophisticated or complicated. I’m a bit annoyed actually that there wasn’t a high profile attempt to do so; it would have proven the point very nicely. But, better late than never.
As for CRU: they’re just a mess, I think. Some of their extra source data is already pre-homogenised by the providing country; some is not; just a tangle, it seems. And a lot of their older homogenisations were manual and subjective. So there simply is no code for that; it was done using human judgment. But I understand they’ve released some amount of code.
Chad, agreed..I guess my point is this . the claims that there would be some big shift due to dropping stations is one that has been kicking around since I first landed on this planet in 2007. As I said the anomaly method should “fix” all the issues ( agreeing with nick stokes and his comments at various places )
Still, the question of how GISSTEMP handles anomalies and creates them is an interesting little investigation that is best done with GISSTEMP code. I would not expect anything earthshattering out of this. I would not expect anything earth shattering out of any investigation of the temp record. Minor adjustments, improved understanding, better methods, better documentation, all of these, but the global warming seen since
1850 isnt going away. If I were a skeptic the best I would hope for is attributing a bit more warming to UHI (maybe .15C versus Jones .05C ) and more accurate error bars. The expectation that people will find some big error will be dashed. So my advice to them is reign in your wild claims. it’s like alarmism in reverse.
Anyways, we really won’t even need to worry about what GISSTEMP says or hadcru says anymore.
JeffId has put up some code that incorporates roman’s method.
there is your work.
Another blog called whiteboard has somebody committed to opening the code.
It would be cool, very cool if the folks from both sides in this debate worked together on a community effort to produce a
suite of tools and approaches. I’d even suggest an “olive branch” to tamino.
One thing missing ( as you know) is a good facility for managing metadata.
Project needs good database guys.
Re: carrot eater (Feb 26 12:21),
I don’t think releasing the code slowed things down. Releasing showed it was a mess, and then people elected whatever path they wished based on knowledge that the code was a mess. As long at it was not released, some people could imagine having the code would permit short cuts. Plus, why do you assume the only reason people want the code is to create a GISS emulator? There have been a range of reasons for wanting code released.
You get to be annoyed. So do other people.
Of course, you could have resolved your own annoyance and proved your own point by writing your own emulator, right? 🙂
I think releasing production codes like GISSTemp and CRU are useful steps. These things should not have been resisted. I think the same for CRU– even if it is a mess.
I do think part of CRU’s problem is that things very likely are a mess at CRU and Jones didn’t want to admit that. I’m a messy person. I understand that… but still…
carrot eater (Comment#35162) February 26th, 2010 at 12:21 pm
“Lucia: I strongly feel that somebody could have easily written a very good GISS emulator, well before they released the code. In fact, releasing the code probably slowed things down, as it was in such a messy condition. Writing a new GISS from scratch would have been faster than doing what the good ccc guys are doing, though it would not have been 100.000% perfectly matching. ”
Yes, carrot we heard this argument a dozen times in 2007. People arguing that we should work their way. When the code was released people could actually look at it and decide which path THEY wanted to go down. The issue with an emulation is the lack of 100% matching. Especially when the problem we wanted to look at ( UHI) is likely at the edge of the noise floor. The other thing is that ANYTIME you show something with an emulation that contradicts the real code, you will get this answer:
The emulation is wrong. the emulation is not peer reviewed.
So from a practical standpoint emulations can’t show anything
wrong with a package they emulation.
What you would have is two pieces of code that didnt produce
similar results. Like so:
GISS shows a warming of 1C
Emulation shows a warming of .98C
Everyone agrees that the emulation is “valid”
GISS shows no effect from dropping stations.
Emulation shows effect from dropping stations.
Conclusion?
With no code, the GISS fans will say the emulation is wrong.
So, you need the code. more importantly we have a right to the code regardless of our identity, intentions, or ability to do anything with it. full stop right to the code.
Magic
Isn’t it the case that you can introduce bias by oversampling? If so, perhaps this is the reason so many stations in the U.S. are being dropped. There were far more U.S. stations than anything else before the drop.
.
But regardless of the math, it’d be nice if we were told why they were dropping stations to begin with, rather than trying to guess the reason for it.
************
back in 2007 I argued with gavin and others that they should drop stations in the us because it was oversampled and they should drop the stations that didnt meet standards.
that suggestion was booed down. go figure.
carrot eater (Comment#35157) February 26th, 2010 at 11:29 am
This is cross-posting a bit, but:
I see it this way: the ccc guys are building basically a perfect emulation. But there’s also a small army of guys building their own versions from scratch. Which clearly shows that you don’t need to copy somebody else’s code; just be willing to do some work. The different people are making different decisions, adding different features; all adding their own touch.
1. You don’t need the code. Provided the paper in question describes the code well you don’t NEED the code.
But: “need” is the operative word.
A. you need the code to verify that the figures provided are actually results of the current version of the code. You and I both know that there are times when you rerun your code and get
different results due to improper version control. basic QA for
any publication I ever did.
B: you need the code to prove that there are no compiler or platform issues.
C: you need the code if you want to rehost.
D: I read hansen’s papers. they did not describe all the steps.
in particular they did not describe the QA steps taken prior
to applying the algorithms. I requested descriptions of these
undocumented methods. Gavin responded “read the paper”
But the paper was entirely vague. When the code was released
the readme indicated that the QA check was not done via
and algorithm but was human judgement. So, the paper didnt describe the step. Gavin said the paper did. it didnt. code got
released and my question got answered.
But more importantly, we have a right to the code.
From the ICO office:
3.2 … The public must be satisfied that publicly-funded universities, as with any other public authority in receipt of public funding, are properly accountable, adopt systems of good governance and can inspire public trust and confidence in their work and operations. The FOIA, by requiring transparency and open access, allows the public to scrutinize the actions and decisions taken by public institutions. Failure to respond or to respond properly to FOIA requests undermines public confidence in public institutions. The fact that the FOIA requests relate to complex scientific data does not detract from this proposition or excuse non-compliance. The public, even if they can not themselves scrutinize the data, want to ensure that there is a meaningful informed debate especially in respect of issues that are of great public importance currently and for generations to come.
3.3 It can also be said that failure to fulfill FOIA obligations undermines the development of public policy. The CRU is a leading climate research centre and its work has been incorporated into the assessment reports of the Intergovernmental Panel on Climate Change (IPCC).
3.4 Where public policy is based on science, the public expect the science to be the best science available and that the scientists imparting that science act impartially. Scientists must adopt high standards of ethics and scientific integrity, and allow their work to be peer reviewed, subject to appropriate safeguards of intellectual property rights.
3.5 This is especially the case in new areas of science such as climate change research, where it is clear the results are directly influencing the development of public policy. (Indeed, FOIA makes special provision for the easier disclosure of statistical data where the section 36 exemption could otherwise apply – see section 36(4)). Access to the original data, computer models and an explanation of the analytical methods used is necessary to ensure that results are reproducible. Any attempts to limit peer review, to omit or distort scientific data or to limit access to data sets, models or methodologies used and thus frustrating any review of the science would lead to legitimate questioning of the conclusions asserted. In the wider context of public sector transparency, there is a risk that attempts to withhold the disclosure of information without good reason will increasingly be characterised in terms of “something to hide.â€
Lucia: These issues weren’t on my radar screen before GISS released their code. Maybe I would have been the guy to implement it for myself. Maybe not. We’ll never know.
As for not releasing code: in most any field of science, people in other lab groups don’t sit around waiting, just in case the one lab group releases some code and allows a shortcut. This just simply doesn’t happen. Each research group is moving forward on their own projects, in their way.
And it’s this perspective that Mosher just simply lacks. The two competing lab groups don’t have to produce anything that matches within 100.00000%. But when their results do diverge, then people take a closer look to see what’s going on. Maybe a third group jumps in the fray. People work until the reason for the divergence is understood. And then you move on. Maybe it gets to the point where comparing code has to happen, but I don’t think that’s very common.
Now it does make sense for GISS to be public, since it’s something of a public utility. But that doesn’t excuse somebody from writing their own emulation. Or, their own implementation, with improvements as they see fit.
Looking around, there is a small army of amateurs doing their own implementations of something like GISS or GHCN; starting with v2.mean and doing something useful with it. All are sceptics, in that they’re wanting to build tools and see things for themselves. But so far as I can tell, none are ‘climate sceptics’, in that they incessantly blog about how evil scientists are, or how wrong they are, or how corrupt they are, or so on. Why is this?
You tell me. I wish it weren’t this way.
Steve Short (Comment#35094) February 26th, 2010 at 3:57 am
That paper is not a serious effort. It’s a nice blog post that just brings us back to the questions that really havent been addressed:
1. How do you select “rural” stations.
2. How do you insure that “rural” stations are really rural
and that urban stations are in “cool parks” or not in cool parks
3. Are adjustments calculated properly with error propogation.
Mosher: If a minor detail isn’t spelled out in the paper, then just make some decision for your own implementation, play with it to see how much it matters, and move on. This is how science works in the real world, where competing researchers don’t FOI each other. When you then write your own paper, you can put in as much detail as you want in the supplementary info, or the appendix to the thesis, or wherever.
GISS, CRU, NCDC and JMA are all doing the same basic thing, yet using their own implementations; these are actually quite different from each other. They don’t have to match 100.0000%.
“If a minor detail isn’t spelled out in the paper”
CE,
You can’t know if it’s a ‘minor’ detail unless you know what the detail is to begin with.
Andrew
carrot eater,
.
That is not how “climate” science works.
.
In climate science the insiders decide who is worthy of consideration or not. If you have the blessing of the insiders then they will pay attention. If you don’t you will be dismissed as an incompetent stooge of the oil companies.
.
The only way to get around this prejudice is start with the actual code and prove that it is really a problem with their code. Emulations always provide plausible deniability for the insiders and their groupies. This is what they have been doing to SteveMc for years.
Carrot:
” Each research group is moving forward on their own projects, in their way.
And it’s this perspective that Mosher just simply lacks. The two competing lab groups don’t have to produce anything that matches within 100.00000%. ”
I don’t lack that perspective. I have a different perspective. I’m well aware that different “labs” have different approaches.
My approach is the engineering approach using validated models.
I’m designing an aircraft. The science behind radar cross section is pretty clear. Estimating radar cross section is not that easy. There are different approaches. Various R&D organizations each have their go at the problem. But the customer, the air force, needs to decide. One model gets validated. everybody gets that model. You want to improve it? submit your changes. everybody gets the changes.
From my perspective I am the customer of climate science. You want to use the results of science to inform a policy, then I am the customer of that science. I got customer requirements. they may differ from yours. they are my requirements. I will buy your science when you adopt practices of transparency. full stop.
I want a red car. you try to sell me a green car and tell me that color doesnt matter. go away. you try to argue that I dont need to be able to pick the color of my car. go away. it doesnt cost anything to share code. the sky doesnt fall. refusing to share it may have cost CRU an important scientist.
And on point. Jones didnt share code with mcintyre because he thought that Mcintyre should do the code himself.
He specifically refused to share the code because:
1. he didnt think he could find it
2. he thought it was an undocumented mess.
3. he knew the code would SHOW Mcintyre why mcintyre
could not replicate the results from the description in the PAPER.
you see #3 is really insideous. Mc could not replicate the results.
he tried. So he asked for code. Jones says NO. and in a mail to Mann, he said ” I wont give him code, and I know why he cant replicate it”
So, you live in this world where you think people will just share the code when I say I cannot replicate the results. you trust them to be as reasonable as you are. Witness also the problems that GAvin had replicationg scarfettis work. they read the paper, wrote their code. didnt match. they requested code. the answer was NO.
Lucia,
This seems on topic. I’ve incorporated Romans method into a global gridded temperature series.
http://noconsensus.wordpress.com/2010/02/26/global-gridded-ghcn-trend-by-seasonal-offset-anomaly-matching/
carrot eater:
I’ve never had anybody turn down requests for information on “minor details.” Have you?
Nor have I ever turned down others when they have requested information.
Even if I can’t always give them the code, I have provided them with binary versions of the programs so they can test that their own implementations are producing the same results as my code.
Some thought I had on scientific confirmation related somewhat to steven mosher (Comment#35171)
–
1) Given the exact data and exact code, an audit can be made on implementation errors.
–
2) Given the exact data but using independent methods, results of the first team can be bolstered/undermined by the second team.
–
3) Using independent data and independent methods, results of the first team can be bolstered/undermined by the second team.
–
Historically, 3) was the method used most often to advance or correct a previously published work. Satellite data -v- surface records is an example of 3).
–
McIntyre has gotten very good at 2) – that is in taking the original proxy data and using it to reconstruct the proxy results produced by other teams. NASA GISTEMP -v- Hadley CRU is another example of 2) where both take GHCN as input but apply their own methods to produce output. E.M. Smith is struggling with 1). Stokes reimplementation is essentially a version of 1). Whereas the work to reconstruct CRUTEMP from descriptions in published papers is an example of 2).
–
In my limited understanding, in some science fields (sociology, I’ve read), providing complete data and exact code is common. In most, it has not. Traditionally, rather than an exact copy of the code, a description of the methods used along with a few key equations have been provided. That way, a second team could re-implement the method independently, if they so chose. Times are changing.
Andrew_KY
No. You read the papers relevant to the field to get a basic understanding of what’s going on; you collect your own data or in this case, take the publicly available v2.mean (or if you’re brave like Spencer, that massive weather data set he used – it must have taken a month to download), and you implement it for yourself. As you go through the steps of building it up, you’ll make various decisions as to what’s the best way to do something. And at the end, you’ll see what you have. Maybe, because you used different methods for whichever, you’ll have a somewhat different ‘answer’. Maybe not. Just as GISS, NCDC, CRU and JMA each get slightly different ‘answers’.
Raven: In what field of science does a first year grad student get emailed copies of all the code and spreadsheets of all competing lab groups, once (s)he decides on a thesis topic? It doesn’t happen. You have to do your own work.
Now, sometimes a software package does become publicly or commercially available, to help you do whatever you’re doing. As I’ve said, I do think it makes sense for GISS to be publicly available. But not having it available shouldn’t have stopped any motivated person from implementing something similar for themselves, or improving on it.
@ carrot eater (Comment#35162) But I understand they’ve [CRU] released some amount of code.
The CRU code that is released is a clean implementation in perl – which to my eyes looks like a recent implementation of some algorithms used in gridding and averaging. I am dubious of any claim that is “the” CRU code which has been used historically to generate the CRUTEMP tables. To my knowledge, no one in CRU (UEA or MET) has made such a claim. And it uses pre-adjusted station data for its input. No code has been released for those adjustments. Although I can note that the adjustments appear to be in-line with those in GHCN v2.mean_adj and the GIStemp end product.
Carrot–
Of course. But so?
This observation is utterly irrelevant to the question about whether or not some codes ought to be released to the public at certain key stages. No one has ever said that the purpose of publicly funded lab group A’s releasing code is so publicly funded lab group b will no longer have to wait before they can do their work. (Although, oddly, if they work on the same program, the program manager might actually require lab group A to release code so they don’t have to pay for essentially the same work to be done twice. )
Excuse? No member of the public needs an excuse to not write a GISSTemp emulation because other than NASA GISS no one has received funding to create that product. Tax payers doesn’t have any obligation to write their own emulation, so they don’t need a “excuse” not to write one.
I find the idea that any member of the public should even wish to write code before they can see certain code totally incomprehensible.
No idea.
That said, I’m not at all surprised since many asking for code never claimed their reason for wanting access was to build an emulator or do something you, ‘carrot eater’, decree useful.
Steve Mosher read the code and found an answer to a question he’d posed to Gavin, but which gavin hadn’t answered adquately. SteveMosher thought that was useful to SteveMosher. Why would SteveMosher them dash off to write an emulator just to do something ‘carrot eater’ considers useful?
Out of curiosity, what are you doing with the code? (I assume you are doing whatever you think is useful– which may be nothing, right? )
“carrot eater (Comment#35176) February 26th, 2010 at 1:08 pm
Mosher: If a minor detail isn’t spelled out in the paper, then just make some decision for your own implementation, play with it to see how much it matters, and move on. This is how science works in the real world, where competing researchers don’t FOI each other. When you then write your own paper, you can put in as much detail as you want in the supplementary info, or the appendix to the thesis, or wherever.”
You don’t get it. I’m not doing science. I am trying to decide whether to BUY THE SCIENCE or not. So when you tell me that
I have to do my own science if I dont buy the science you are selling, it’s kinda funny.
I’ve said this before. Perhaps it bears repeating. If you want
me to accept a result or an argument, i want to see your work.
I may go through that work, I may not. But, I want to see your work. If you don’t want to show me your work, don’t demand
that I buy it. Dont expect me to buy it because of letters behind
your name. dont expect me to buy it because I havented proved the opposite. Don’t expect me to defend my requirements.
Now, if you dont want to make this customer happy, that is
your choice. Lucia doesnt share code. Do I buy her analysis?
sure. Why? because NOTHING happens to me if I buy or dont buy.
Lets say GISS didnt share code. Would I buy their analysis?
No. why? because it matters more to me.
I
carrot eater,
.
Students often are expected to ‘re-invent the wheel’ because that is how they prove that they know the material. We are not talking about school work. We are a talking about real world science with real world implications. The standards are completely different.
.
Read Mosh’s comment – the scientists are trying to sell us their science. It is their job to convince us to buy. Not our job to prove them wrong.
Mosher: Extremely ironic that you bring up Schmidt vs Scafetta in this context. Schmidt and colleagues read Scafetta’s paper, tried every implementation of it they could think of, spent some time doing it, and just couldn’t get it to work. They contact Scafetta for clarification. That doesn’t help. So only then, after a lot of work they put in, did they publicly ask for code.
I must have missed the part where you guys did all that work to try to independently confirm, BEFORE the public call for code.
Tamino got as far as he got in a month. And he’s not even closely following GISS code, as he’s doing things his own way. Who knows if he’s even really looking at it. For something to be ‘robust’, it shouldn’t be highly sensitive to little decisions of how you choose to implement it.
Broberg: I’ve noted upstream, a lot of CRU adjustments were done by hand. So there is no code for that. It was Jones sitting down with a pencil and paper, and looking at the data before and after a station move.
These are the reasons I prefer objective adjustments to subjective methods.
Moshpit:
1. How about calling out Watts for locking up the Surface Stations data?
2. How about calling out McIntyre for taking several months (and requiring reminders and even a threat to go to GRL) to produce the 10ish lines of code behind his changed RE simulation in his Reply to Comment? (This from the same guy who has spent plenty of time writing blog posts advancing his Replies to Comment).
3. How about calling out Wegman for not responding to requests for code and data?
————————
If one is honest, it should cut both ways. I sense you admire honor. But you need to watch McIntyre and Watts and the like. They have a slippery side. Guys like Zorita, Jollife, even Atmoz, that English computer code guy. Those are ones that really will show it whichever way it cuts. (note, none of this excuses truculence from Mann et al…I believe in unilateral open-ness regardless of the side.)
But I honestly caution you to be careful to look deeply at the skeptic sides. Push your own side and see how they do, when pushed on things (for instance Watts and his solar silliness, white screen paint, Id/Ryan and the negative thermometers, etc.)
Re: carrot eater (Feb 26 13:08),
It’s true researchers rarely FOI each other. But some of your other notions are not quite right.
Often, when details are not spelled out in papers, researchers email, phone write each other and ask.
If things were really done the way you claim, people in other labs would notice that the paper didn’t explain details “a, b, and c “, they’d do “my wild guess at a, my guess at b, and my guess at c”. Then, they get a different result. But somehow, they don’t phone….. So, now, unless the two group communicate, how could the second lab know if the different result was due to “a, b, or c”? And maybe the lab is funded to explore the effect of “d”. How do they know if differences in later results were due to “d” or to having dealt with “a, b or c” differently?
What many real, honest to goodness researcher do is ask the person who failed to explain how he did “a, b or c”. The person who wrote the first paper usually answers questions about pesky details if… they remember… and they aren’t being butt-heads.
Researchers do ask for codes– and often share them, though the level of willingness to share can vary. Sometimes, sharing code is more time efficient, so it’s done rather frequently.
In the case of something like CRU and GISSTemp, where a code is run every month, and zillions of people are curious, making a code publicly accessible is a time efficient method of helping people discover answer to their own questions. The fact that you have some odd notion about how real research is done is not excuse for certain production to not be released.
Lucia, Mosh, Raven:
I’m not buying it.
“I find the idea that any member of the public should even wish to write code before they can see certain code totally incomprehensible. ”
How? With a typical person for whom the code would be meaningful in any way, they could also do a fair job of writing their own. GISS is not complicated; it won’t take you five years to write. For the average person on the street, seeing the code makes no difference to them, as they have no idea what they’re looking at anyway.
Look, I agree that GISS should be public. Yes, it should absolutely be public. And now it is. And then what happened? From the sceptic side, pretty much nothing. They don’t seem any more willing to ‘buy’ anything at all. Maybe some little thing, Mosher now understands. Great. But I know I’d be more willing to ‘buy’ something if multiple different groups, working independently, all came up with similar results.
“Out of curiosity, what are you doing with the code?”
Absolutely nothing. I don’t want to bias myself by looking at somebody else’s code. I am working with v2.mean, on and off. Maybe if I have a blog someday and find something interesting, I’ll share. Maybe not.
But I’m also not making baseless claims like “dropping cold stations makes it hot”. If I were making such claims and publishing them, then the onus would very much be on me to do the analysis to back them up.
“I’m not at all surprised since many asking for code never claimed their reason for wanting access was to build an emulator or do something you, ‘carrot eater’, decree useful. ”
Well, whatever reason they wanted it, they now have it, and so far as I can tell, nothing has changed except for the politics of them not being able to ask for it anymore. Seems like they’ve moved on to asking for emails about the code. Lovely. I’m sorry, but I simply don’t see good faith here.
Re: carrot eater (Feb 26 13:33),
A grad student doing a thesis is a very poor analogy for what’s going on here. The public is not a group of people who are doing work as a learning exercise. They are not funded to create new science for the enjoyment and edification of those at CRU, GISS, NOAA etc.
GISS, NOAA, possibly CRU have received tax payer funding to create products for the benefit of the public. It’s idiotic to suggest that if members of the public have questions, they need to redo repeat publicly funded work from scratch, on evenings and weekends while also doing remunerative work, which is taxed to create produts like GISSTemp etc.
Suggesting members of the public need to do so because grad students don’t arrive to find everything they could possibly need to write their thesis is silly.
What are you going to suggest next? That if I want to receive a letter in my mail box, I need to go spend two years as a letter carrier so I can truly understand what’s involved in mail delivery? Or that if I want to send my kid to public, I need to volunteer a year of my life teaching 1st graders to read because, after all, teachers are expected to teach? Obviously, this standard doesn’t make sense.
lucia (Comment#35196)
Depends on how consequential the detail was. Some things you’d just figure out for yourself; some things you might email about. Case by case thing.
Lucia:
I use the grad student analogy because some claim that climate science isn’t really science because of code availability. You see this on WUWT a lot. Let’s just be clear that this is a red herring.
Now, if you want to say that climate science should be treated differently than other sciences for various reasons, then fine. As I’ve said many times, GISS should indeed be public. But let’s not say that it isn’t science until every last spreadsheet is turned in.
I don’t think the academic analogies are relevant, this not about academic practices and little disagreements.
Possibly slightly off topic, if so forgive me, but this is the Institute of Physics take on the matter:
http://www.publications.parliament.uk/pa/cm200910/cmselect/cmsctech/memo/climatedata/uc3902.htm
Carrot
So what if the code is incomprehensible to the average person in the street? I can read french. Most american’s can’t. My local library would not refuse to let me check out a novel written in french merely because French is incomprehensible to the average person on the street.
The fact that the average person on the street does not understand code is no reason to a member of the public who can read code to replicate publicly funded work before they can access code created at tax payer expense.
Sure. Me too. But this isn’t an either or situation. GISS releasing the code does not prevent CRU or anyone else from creating a surface product, and it doesn’t force them to use the same algorithm.
If your gripe is Anthony, then say so.
However, that gripe is nearly irrelevant to the issue releasing codes like CRU or GISSTemp. Loads of people posting at my blog have been supporting releasing code and saying not only not saying “dropping cold stations makes it hot” but saying that dropping cold stations probably makes very little difference. (That said, releasing the code permitted emulation, and faciliated CCC guys running the GISSTemp code and becoming what I think is the 4th group showing that dropping cold stations does not make it hot.)
Is taking away that talking point a bad thing? Believe it or not, several of us here — including me– have said taking away the talking point is one of the reasons code should be released.
In fact, during the Scafetta/Schmidtt kerfuffle, I exchanged some emails with Schmidt. I asked him for his code precisely do I could report whether he gave it to me. I told him I didn’t run R, but he asked Rasmus to send it to me and Rasmus did. I could have given it to anyone I wanted.
Obviously, if Gavin had refused, I would have had to report that Gavin refused, which would have been pretty bad PR while he was asking for Scaffettas.
(BTW: Gavin’s request for code is very analogous to SteveMc. requests. Steve has generally posted output form his similations with comparisons of the difference between his and other peoples results while also asking for code to track down the differences. So, how is that different?)
Also, as for your claim that “nothing has changed”, didn’t having the GISSTemp code help CCC emulate it and run their recent cases? Isnt that a change since before GISSTemp was released?
You may be wishing for some different set of changes… but the fact is that the GISSTemp code release is starting to bear fruit– for the people who didn’t think it needed to be released. Smile at those silver linings man!
http://www.publications.parliament.uk/pa/cm200910/cmselect/cmsctech/memo/climatedata/uc4702.htm
Carrot
Of course. But your characterization made it sound like people don’t ask, share etc.
Ok… but you may need to learn to state what argument you think you are rebutting. From time to time, people arrive here and start arguing with comments they remember from some post at another blog. Obviously, the rest of us have no idea that they have just been presented with a rebuttal to “common idea I read over at blog Y, by commenter Z”.
FWIW: I don’t think code availability is the defining aspect of science. But code sharing is frequent in “real science”. It has been widely done in computational fluid dynamics. (I’m a mechanical engineer btw.)
Graduate students often benefit from obtaining base code from other groups and heading off from there. Do they arrive at their desks will all the codes form all groups bundled in an email? No.
But there is lots of sharing in engineering sciences and all research. Trying to claim otherwise is going to raise the eyebrows of anyone who has ever done research at a university or national lab.
carrot eater,
GISS is a publicly funded organization. EVERYTHING they do and have ever done (code, email messages, papers, and scribbles on the back of envelopes) is the legal property of the public, down to the last character in the smallest program they have ever written. What is crazy is that everything they do and have ever done has not always been automatically treated as the public property that It is.
.
And as you probably know, Phil Jones has been generously funded by the USA taxpayer as well. It is absurd that he was not contractually compelled to disclose his code and raw data as a condition of receiving that funding.
.
What anyone wants to do with that public property (code and/or raw data) is completely irrelevant.
It’s all in the “adjustments” made to the raw data. Willis Eschenbach has looked at Anchorage, Nashville, UK, Sydney. All have inexplicable adjustments to produce a warming effect where none was appparent in the raw data. Others have done similar examinations of adjustments and reached similar conclusions.
http://wattsupwiththat.com/?s=Guest+Post+by+Willis+Eschenbach
The difference between the raw data trend, and the adjusted data trend equals the alleged Warming.
Ultimately the explanation of why fraudulent adjustments were made to the raw data will be the basis for Criminal Prosecutions. The Scientists concerned can’t very well say they didn’t know what they were doing, so they will have to admit that they deliberately cooked the books.
Secondly Tamino and JohnV etc are only interested in getting their discrediting of Watt’s work in before he publishes his conclusion.
Thirdy: There’s a new paper out by Dr. Edward Long that does some interesting comparisons to NCDC’s raw data (prior to adjustments) that compares rural and urban station data, both raw and adjusted in the CONUS.
The paper is titled Contiguous U.S. Temperature Trends Using NCDC Raw and Adjusted Data for One-Per-State Rural and Urban Station Sets. In it, Dr. Edward Long states:
“The problem would seem to be the methodologies engendered in treatment for a mix of urban and rural locations; that the ‘adjustment’ protocol appears to accent to a warming effect rather than eliminate it. This, if correct, leaves serious doubt for whether the rate of increase in temperature found from the adjusted data is due to natural warming trends or warming because of another reason, such as erroneous consideration of the effects of urban warming.â€
“Dr. Long suggests that NCDC’s adjustments eradicated the difference between rural and urban environments, thus hiding urban heating. The consequence:
“…is a five-fold increase in the rural temperature rate of increase and a slight decrease in the rate of increase of the urban temperature.â€
The analysis concludes that NCDC “…has taken liberty to alter the actual rural measured valuesâ€.
Thus the adjusted rural values are a systematic increase from the raw values, more and more back into time and a decrease for the more current years. At the same time the urban temperatures were little, or not, adjusted from their raw values. The results is an implication of warming that has not occurred in nature, but indeed has occurred in urban surroundings as people gathered more into cities and cities grew in size and became more industrial in nature.” http://wattsupwiththat.com/2010/02/26/a-new-paper-comparing-ncdc-rural-and-urban-us-surface-temperature-data/
I am appalled at the lack of scientific rigour shown by those that suppose any of the adjusted data sets are any use at all. Shocking.
On a somewhat tangential note, there is an interesting secondary result to come out of these GHCN analysis; namely that the net effects of adjustments to the raw data appears to reduce the trend in temperatures.
Tamino showed this for the Northern hemisphere but gave no specific numbers (just a graph). Jeff Id’s analysis had the global raw data land trend at 0.233 C per decade for 1978-2010, compared to 0.19 C per decade for GISS.
.
Also, MarkR, methinks you are a tad out of your element.
“From time to time, people arrive here and start arguing with comments they remember from some post at another blog. ”
I mainly went in that direction because of something raven said at (Comment#35178), though upon re-reading it, she wasn’t quite saying the ‘it isn’t science’ thing.
“But there is lots of sharing in engineering sciences and all research. ”
Yes, but it also isn’t nearly as open source as some would appear to think. Even if I was actively collaborating with somebody, we might do our calculations in parallel, just to make sure. It gives you a lot more confidence when two people working independently find the same thing. In the cases where I got code from an outside group, I didn’t use it; I found it better to write my own.
“If your gripe is Anthony, then say so. ”
Seeing as I followed the links here through a discussion about the EM Smith station dropping thing, then that would be one major thing in mind at the moment. If you make a claim and publish it, do the analysis. If you didn’t do the analysis, don’t publish. Simple. Can we at least agree on that? Watts thinks he’s holding scientists accountable, but he’s got to be accountable as well.
“Is taking away that talking point a bad thing? ”
Just pointing out that it was a talking point. And again, I agree that GISS should be open, regardless of what the sceptics say, and I’m glad that it is.
“Steve has generally posted output form his similations with comparisons of the difference between his and other peoples results while also asking for code to track down the differences. ”
I was not aware of he or any other sceptic doing this for GISS; just the paleoclimate stuff, which I’m not into. I think you’d have to mess up pretty badly to not get a result more or less in line with GISS/GHCN/CRU/JMA, if you sat down to do it. Like, you’d have to use average together absolute temperatures…
“didn’t having the GISSTemp code help CCC emulate it and run their recent cases? Isnt that a change since before GISSTemp was released? ”
It’s helping them re-write it by looking at it. This’ll make sure there’s no simple stupid coding error in there. I maintain you could have started from scratch and done a pretty good of emulation without it; it’s a shame that apparently nobody tried, back then. It seems to me that the zekes, Brobergs and Taminos of the world aren’t heavily looking at the GISS code, but going about things their own way.
But what I’m saying is that nothing has changed from the sceptic camp. They’ve got the code, so then they FOIed for emails related to changes in the code. Really? Where does this end, and is it really related to science and understanding? Or is this a game?
Even with the code in hand, they don’t seem to be using it to answer their own questions.
“Tamino showed this for the Northern hemisphere but gave no specific numbers (just a graph). Jeff Id’s analysis had the global raw data land trend at 0.233 C per decade for 1978-2010, compared to 0.19 C per decade for GISS.”
Zeke,
These kinds of statements may justify something in your mind, but an average person doesn’t know what that is supposed to be, or why they should care about it. I certainly don’t know what difference it makes to the obvious… that the public has been lied to by climate scientists.
How does this help?
Andrew
Zeke: GISS adjustments will reduce the trend slightly. It angers sceptics to no end that some % (<50%) of urban stations are actually adjusted up in the UHI step, but they don't realise that the point of the UHI adjustment is to keep the urban stations from really affecting the trend, at all.
But for the GHCN adjustments: this is your benchmark to reproduce:
Look under Q4.
http://www.ncdc.noaa.gov/cmb-faq/temperature-monitoring.html
Zeke Hausfather (Comment#35208)
“methinks you are a tad out of your element”
.
Your condescension is terribly unflattering.
.
But if you really do plan on getting an advanced degree in climate science, then perhaps you are already well ahead of the syllabus, since condescension seems to be a required behavior for climate scientists.
Wait, so Jeff Id gridded and spatially averaged v2.mean to get a global mean record?
I take it back, then. A sceptic has done something constructive with v2.mean. Hurrah.
Erg, the slopes in my comment at (Comment#35211) will necessarily be lower than Taminos or jeff id’s because it includes the pesky, slow-changing ocean.
So far as I know, none of the bloggers have moved to add in the ocean yet.
SteveF,
I’m sorry, but I find statements like “Ultimately the explanation of why fraudulent adjustments were made to the raw data will be the basis for Criminal Prosecutions” as irritating as the crude metaphor discussed in the prior thread. If you want to contribute something, look at the damn adjustments yourself and see what they are doing.
Anyhow, sorry again for the slip, back to the polite search for common ground 😛
Re: carrot eater (Feb 26 14:51),
Raven’s a guy. I asked….
Depends what you mean by publish. I consider explaining claims made at blogs on a blog, publishing. Explaining the basis for a claim made in an SPPI document in that SPPI document or a document you cited in that SPPI, publishing. So, if you mean that, I agree.
If you mean that all claims *must* be published in a particular type of forum, I disagree.
After we get past that, we can debate whether anyone did or did not explain a claim they made.
Yes, demanding GISSTemp was a talking point The thing to remember is the most effective talking points contain a strong undercurrent of truth. The fact that many good reasons existed for releasing the code gave force to that talking point. That some people repeating the talking point were only making it as a talking point is also true.
A while ago…. Topics go through waves.
Yes. It saves those who want to do something time. Unless your goal is to waste people’s time, this is a good thing.
Sure. I’m sure that could have been done by someone who wanted to invest the time. But how would this have benefited tax payers or the public? But is the goal of not sharing code to waste people’s time? To put them through fraternity hazing? To make then prove they are manly, manly men?
I think you are a very fuzzy on which codes were released, who asked for emails what FOI’s were written for etc.
I think you are also making the mistake of thinking there is one big borg called “them” sharing one brain and one body. SteveMosher got the answer to his questions by reading the GISSTemp code. Of course reading that code did not provide answers about CRU. Most FOIs were about CRU/MET stuff.
Someone will correct me if I’m wrong, but I think Congress forced GISS to provide their code and GISS has been fairly open since then.
Re: carrot eater (Feb 26 15:09),
probably because it’s sort of irrelevant to the “loss of stations” , the “urban heat island” and the ‘station quality” issue.
There are issues with the oceans, you can get more sensitive tests of the other issues by ignoring the ocean for the time being.
Let me see if we can get someplace with carrot eater from a different perspective or frame of thought. I like ravetz work on Post normal science ( bear with me defenders of the scientific method) On Ravetz view climate science is post normal. That is,
facts are uncertain ( they always are) Values are in conflict (duh)
and decision appear necessary and close at hand ( on one view of the facts) What ravetz suggests and I agree with is that when these conditions obtain the dialog needs to be extended; he calls it extended peer review. What I want to focus on is how the concept of uncertainty becomes much more contenious in these matters.
Toyota, as some of you know, is recently under investigation for a recent product defect. 34 people died from uncontrolled acceleration. Toyota recalled the vehicles in question, citing mechanical failures as the culprit. But people are worried about
electrical failures. If other cars share electrical sub systems with the recalled vehicles perhaps they should be recalled:
“House Energy and Commerce Committee Chairman Henry Waxman (D., Calif.) said U.S. auto-safety regulators, including the National Highway Traffic Safety Administration, aren’t equipped to assess electronic problems that some people have speculated may be a cause of Toyota’s issues. He and other lawmakers said new legislation might be needed to address the concern.”
Very simply, in some peoples minds, Toyota’s explanation doesnt go far enough. They want more certainty. They feel more certainty is required because lives are at stake. people are driving cars now that may be dangerous. action is needed. When lives are at stake, when action is needed, then our perception of uncertainity changes. What may be “Statistically significant” for you, may be too little certainty for me. The public may want more certainty. Law makers may oblige. Now, in climate science
one side argues that we have enough certainty to decide. Inaction causes future damage. They are satisfied with the largely coherent facts and theories of climate science. They are willing to decide actions based on “highly likely” evidence or likely evidence. They see the present cost of action outweighing the future cost of inaction. On the other side, you have people who value the present cost more importantly than the future cost.
They have different discount rates. different values with regard to our transgenerational obligations. they view the uncertainty of facts DIFFERENTLY. they want more certainty. You look at 90% confidence and you think 90 is enough to act. Others look at 95% and think it not enough. they want other explainations ( bad electrical systems) ruled out. Uncertainty is just a number. Your attitude twoard that number is something different. that attitude is conditioned by your values. I value my money now more than I value future generations ( I dont, but some do) You think 95% is enough certainty. I don’t. You argue that 95% is traditionally accepted. I say screw your tradition ( for example ).
The point of this is that in these circumstances you have to extend the process of “buy in”. How do you get people to “buy into” a process. My position is that you get people like me to
“buy in” by sharing data and code. If you give people the opportnity to voice their concerns and then close on their objections, you have a better chance of getting buy in.
So: I buy the results of GISS; with the release of hadcru code
I buy the results. Do I think looking at the code will generate some improvements? sure. Will it change the science? no, GHGs warm the planet. will it change how quickly we need to act ?
I dunno, That question could be asked hypothetically.
Suppose that the warming from 1960 to today is .5C according to cru. If it was only .4C what would change in our conclusions?
dunno, .3C ? dunno. It reminds me of a problem we had in doing a model of the F5 performance.
We had a 6DOF. It matched the flight test data. Deep in the code
was a model of an accelerometer. Nobody had good data on it.
hehe. we made it up from guesswork based on other devices.
We did sensitivities. our guess didnt matter to the final results.
At the begining some people thought this Guess was bad bad thing to do. pilots lives and all that. Other people said.. hey the data is lost to history, we have to guess. Planes crash all they time. In the end these conflicts in values were addressed by sharing the code and allowing people to see if their worries held any water.
Oh, the pilots didnt have to write their own damn code or run the model. their concerns needed to be addressed in a way that made THEM comfortible. Climate science proposes a control mechanism ( GHG reduction) of a system that is dominated by feedbacks. I’m a passenger on that plane. I’d like to know that the FCS is quad redundant.
carrot:
“This’ll make sure there’s no simple stupid coding error in there. I maintain you could have started from scratch and done a pretty good of emulation without it; it’s a shame that apparently nobody tried, back then.”
History: the code was released, I spent a couple weeks looking at it trying to remote debug with guys who had fortran knowledge and compilers. very little progress, but some questions were answered. there were no big bugs ( didnt expect any) and it was clear that there were complier dependencies that needed to be sorted by someone with time and experience.
JohnV looked at the mess and decided to do his own emulation.
Maybe he will show up and explain why, but he did a lovely C++ version. I read through his code and it made perfect sense. he and I started to analyze US data. he benchmarked against GISS
and had pretty good agreement. good enough for a PRELIMINARY look what I wanted to do. Let me explain what I wanted to do.
1. Anthony had a sub sample of US stations that he rated
by NOAA criteria– he had a few stations ( 13) that were
pristine and a much larger number of stations that were
rated as poor.
2. I wanted to see if there was a difference between
CRN1 ( best) and CRN5 (worst)
3. My FIRST BEST CHOICE as a tool was GISSTEMP. use anthonys
metadata and GISSTEMP. a standard.
4. I tried to get Gisstemp compliled and running. No joy.
5. JohnV did an emulation:
6. he and I used that.
What we both found was that BAD STATIONS ( CRN5) showed more warming that GOOD STATIONS (CRN1) but, john’s program could not calculate confidence intervals. the difference was small
(.15C) the sample was too small ( 13 stations) the stations were not geographicallt representative. kenneth Fristch tried his own
approach to answer the question relying on his own method.
My option was to wait until Anthony finished his entire survey.
More stations and maybe GISSTEMP could be made to work on my system someday.
So you see MY PURPOSE for having access to the code had a variety of rationale. How do I get mys questions answered and How do I BEST TEST anthony’s contention that CRN1 is better than CRN5? Easy: get an ACCEPTED peice of analytical code running and change the input data sets.
like DUH!
Your solution: I write my own code ( like johnV) match that output against GISSTEMP. then change the input data.
That causes more confusion
Thanks for a good discussion, all.
Carrot Eater has labored under a disadvantage, since s/he has adopted the position, “I’m all in favor of the release of GISS code (but here’s some reasons why it shouldn’t be, or need not be, or why non-release is no big deal)”.
Carrot talks a lot about skeptics. To me and to most of Lucia’s readers, I’ll wager, skeptics (“naysayers” to Michael Tobis; “denialists” to Gavin et al) is a set with two centers of gravity. There are people who reject most/all of the findings of climate science, and are often angry, commenters at Mosher’s Noble Cause Corruption are an example. Then there are people, many conversant in science, math, and engineering disciplines, who are, well, skeptical. Skeptical of some of the AGW Consensus’ way of going about their science, of the blurred line between that science and advocacy, and thus skeptical about some of the results produced by that science. And skeptical about claims as to the associated uncertainties.
Carrot, much of your perspective would be arguably correct. If this was a discussion about some academic labs modeling the atmosphere of Ganymede, or Titan. Something of intrinsic intellectual interest, able to attract NSF or ESA funding. Something where postdocs at parties would be saying, “Wait! This stuff isn’t directly relevant to Current Events here on Earth!”
But that is not the case. Governments, politicians, journalists, members of the public and of parliament, insurers, etc. all act as though Climate Science does matter.
And Climate Scientists agree wholeheartedly. You’ve taken the public’s shilling on that basis. And from Schneider and Hanson to the present, many of you have jumped into advocacy and policy roles.
Part of your profession’s challenge is, bluntly, to grow up. Revisit Mosher’s Comment#35180.
That last sentence is wrong. We might buy your science when you are seen to conform to the proper standards. No guarantees.
One trait of the AGW Consensus Community is the dissonance between
“We have urgent news to communicate about CAGW and What Must Be Done, Now.”
And the disdain you often show to most people outside the charmed circle of the AGW elite.
If I lack the technical competence to evaluate the car, I’m going to look at the salesperson and his/her selling techniques. And at the business practices of the dealership and the manufacturer.
Consensus climate scientists and acolytes often sound enraged about the Stupid Public and the Well-Oiled Conspiracies that snatch sales away. When this is directed at me specifically (often enough, on blogs), I am insulted. When I’m lumped into this category, I am insulted. None of this changes the CO2 forcing — of course — but my buy-in to the Consensus is going to take longer, at best. (1) I’m human, and (2) Why should I trust the judgment of folks who put their poor judgment on extravagant display?
You, collectively, might try thinking a little more about what your behavior signifies to people who are cautious about jumping aboard bandwagons. Yeah, bona fide Denialists are a lost cause, so what. My guess is that if the advocates among you took a more rational and sales-oriented view of things, Climate Science would improve. Because, as it happens, the best marketing push maps to better processes in the applied science (transparency, metadata archiving, code sharing, etc.).
Lucia: Yes, demanding GISSTemp was a talking point
Mosher: 4. I tried to get Gisstemp compliled and running. No joy.
I don’t know how long you guys have been at it, but I had the GISS code running through Step 3 (global grid and ave of land stations) in May 2008. So it was there. And I still hear cries of: release the code! 😆 In fact, some twit on Real Climate claiming that you couldn’t run the GIStemp code kind of pushed me into recording my efforts in a blog.
“Raven’s a guy. I asked…. ”
Oops, sorry. I have no idea why I assumed otherwise, actually.
“There are issues with the oceans, you can get more sensitive tests of the other issues by ignoring the ocean for the time being.”
Gut feeling based on nothing real, but I think the biggest remaining errors (post, say 1900) are in pre-WWII ocean measurements. That will have its day.
” Explaining the basis for a claim made in an SPPI document in that SPPI document or a document you cited in that SPPI, publishing. So, if you mean that, I agree. ”
I think so. They made a half-baked claim in the SPPI document, without doing the analysis to back it up. The SPPI document is meant to have a higher profile than a simple blog post, so we’re going to hold it to higher standards than a simple blog post. Immediately, everybody said it didn’t make conceptual sense. Within a couple months, people were showing numerically that it didn’t make sense. If a serious scientist did something like this, Watts would be all over it. All I’m asking for is accountability the other way. Ask Watts to defend the claims he published, or admit he published claims without doing the required work.
“Sure. I’m sure that could have been done by someone who wanted to invest the time. But how would this have benefited tax payers or the public?”
Does not Tamino’s work bring some benefit? An independent analysis, getting the same results. That’s worth noting. Much more noteworthy than somebody taking the GISS code, hitting ‘run’, and seeing it spit out the same thing GISS gets. In case anybody was still confused about this issue, it (Tamino) again shows that you can start with v2.mean, do any sort of reasonable analysis, and get about the same results.
“But is the goal of not sharing code to waste people’s time?”
I would never start with GISS code for any project of my own. It’s too much of a mess. For others, it could be different, but for me, starting with GISS would itself be a waste. At most, I’d peak for a pointer here and there.
“I think you are a very fuzzy on which codes were released, who asked for emails what FOI’s were written for etc. ”
I’m referring to the FOIs that GISS recently fulfilled, asking for every email relevant to Steve McI finding the y2k bug. How is that helpful to anybody? I’m sorry, but that’s just playing games and going fishing. Steve found an error, good on him, and GISS fixed it. Why do you need to read the internal emails about it?
Again, I think it’s good that GISS code is available.
Re: AMac (Feb 26 16:08),
You refer to carrot eater as a climate scientist. Has s/he told us this? I don’t know carrot’s profession or training, so I would suggest caution suggesting he has been taking the publics shilling etc. For all we know, s/he’s a lawyer or hair dresser!
Let me just give carrot a little history.
In 2007 anthony found some irregularities in surface stations. bad siting. He argued that this bad siting would impact the record in the US.
The right course of action was clear. Since NOAA was supposed to have microsite documentation, since they were supposed to ensure proper siting, NOAA should have surveyed all the sites. They didnt.
Here is what the community of scientists did.
1. They REMOVED the data that allowed anthony to contact
operators of the sites. ( they later were forced to put it back up)
2. they argued that microsite bias didnt matter. Citing literature
Peterson2003 that specifically didnt support their argument, but
rather assumed their argument to be true.
3. They fought releasing the code (gisstemp) that would have been the easiest tool to use to assess the claims. later they would
release the code.
4. They argued that bad stations should not be removed from the record.
5. They later funded an effort to remove bad stations or upgrade them ( USHCN-M)
They picked the hard path. they picked the path that keeps this alive. They had another choice. Acknowledge the potential problem. accept the criticism. close on objection. move forward.
recently they even refused to co author a paper with Anthony when he offered them the entire data set. Instead, they publsihed with an incomplete dataset. Again, the hard path.
Lucia: No, this is not my field. Anyway, if I were to claim any personal authority, I would post under a real name. A pseudonym has no claim to personal authority.
steven, you are seriously and badly misrepresenting events here.
.
anthony has been making constant making claims that hint at a significant effect of the UHI on those bad stations. but every analysis we have seen so far, shows at best a tiny effect.
.
this is anti-science.
Ron Broberg (Comment#35230) February 26th, 2010 at 4:09 pm
Lucia: Yes, demanding GISSTemp was a talking point
Mosher: 4. I tried to get Gisstemp compliled and running. No joy.
I don’t know how long you guys have been at it, but I had the GISS code running through Step 3 (global grid and ave of land stations) in May 2008. So it was there. ”
Ron, I tried for a couple weeks in 2007. Basically, remote debugging. reading the code and making suggestions to other guys who had enviroments set up. We got through step 2 or 3, but I was not happy with the work arounds ( ended up being compiler flag settings ) Anyways, by that time JohnV had something up and working that I could use on my machine. an emulation that gave me enough information about the CR1-5 problem to understand that the microsite effect would be small and that more data would be required. hence, no point in continuing to look at GISSTEMP until anthony’s data colection was done. Volunteer effort. not on your schedule or mine. ho hum.
carrot eater,
.
I would agree that GISS has recently been subjected to nuisance FOIs by people who are fishing for dirt.
.
But all of the FOIs submitted to CRU were legimate requests for information necessary for scientific investigations. The same is true of the FOIs that Santer has been complaining about.
.
You really need to stop assuming that sceptics are this monolithic group with identical objectives and motivations.
PS, ron. I like your stuff! I left you some suggestions for data output with regard to your classification of rural/urban.
Also, back in 2007 I suggested that people look at the columbia data on population. GISSTEMP was susing 1995 nightlights and out of data population data for the ROW Glad you did.
You see with GISSTEMP up and running people can test the senstivity of different “rural” datasets. That’s a reason why having the code up and running is cool. Different data: same tool as hansen; see what pops out.
A neat project would be a interface that allows people to define a “rural” dataset. submit that to GISSTEMP, output the results.
Thanks raven.
I’ve never saw the need to FOIA GISS for dirt or anything else.
hansen released the code. If I wanted to fish for dirt I’d FOIA the mails discussing the release. But I dont care. The code came out.
I went to RC. I posted these words ” thank you for releasing the code”
That comment didnt make it out of moderation.
Carrot–
Each person has their own style of holding people accountable. Certainly, Tamino worded his post pretty harshly. I’m sure Eli Rabett will. Others will just state whether what he claimed is right or wrong. Don’t mistake the fact that some people are more measured in their posts for not holding a blogger (or anyone) accountable for their errors.
Some yes. Some no.
But how in the world does the fact that some of Tamino’s blog work is beneficial mean that refusing to let the public view GISSTemp is beneficial?
You are stuck on either or again. Releasing GISSTemp did not prevent Tamino from posting his recent analysis. So, once again, what benefit come from refusing to release the code? The release doesn’t prevent anyone from doing the other things you admire as beneficial.
You wouldn’t use it. Once again, so what? I would never eat pickled pigs feet. Does that mean the public should not be permitted to read recipes for pickled pigs feet?
You admitted that some people find access to the code saves time. So, why should they be deprived of this just because you wouldn’t do it. Is the goal of depriving people who don’t want to do it your way to force them to do it your way? Why would that be a good thing?
You mean the ones from CEI? The FOI that was filed years ago, ignored but finally filled after the story about CRU blocking FOI’s became big news?
I don’t know if it’s helpful to someone. You’d have to ask the individual at CEI who requested them why he wanted the information way back when he requested it and whether he learned something he found beneficial once he got it. The thing about requesting information from the government: individual get to request things even if they are the only person interested in the information and they get to do so request it even if they are the only person who benefits from the information.
But why do you think releasing the code for GISSTEmp means a guy at CEI can’t request something else for some other reason?
Zeke Hausfather (Comment#35217)
February 26th, 2010 at 3:12 pm
“I’m sorry, but I find statements like “Ultimately the explanation of why fraudulent adjustments were made to the raw data will be the basis for Criminal Prosecutions†as irritating as the crude metaphor discussed in the prior thread. If you want to contribute something, look at the damn adjustments yourself and see what they are doing.
Anyhow, sorry again for the slip, back to the polite search for common ground.”
Newsflash Zeke. If the AGW position is (as I think) wrong and fraudulent, there will be a reckoning. See what happened to the Bankers? That’s what will happen to the Warmers times 10. Think this isn’t going to go legal? Dream on. There will be no “polite search for common ground”, there will be heads on pikes.
sod (Comment#35235) February 26th, 2010 at 4:25 pm
“steven, you are seriously and badly misrepresenting events here.
.
anthony has been making constant making claims that hint at a significant effect of the UHI on those bad stations. but every analysis we have seen so far, shows at best a tiny effect.
.
this is anti-science.”
1. Anthony has been making claims that hint at this.
2. I tried to use GISSTEMP to asses these.
3. We couldnt get it running after 10 days of effort.
4. JohnV published Opentemp
5. JohnV and I used opentemp to assess Anthony’s claims.
6. JohnV found his code emulated GISSTEMP nicely.
7. JohnV looked at CR12 and compared it to the whole record.
8. he found no “big” difference.
9. I compared CRN12 to CRN5. I found a .15C difference.
10. JohnV confirmed this.
11. I think we both agreed that these conclusions needed some more data and definately needed confidence intervals.
Which of these statements do you have issue with?
It’s not anti science. Anthony made a claim. Looked interesting.
in conclusive in my mind, but worth looking at. I think the claim will be hard to establish. the effect is likely to be small and lots of data will be required. The results won’t change climate science. The results may adjust the warming curve. By how much? I put the figure between .15C and .05C. Does that matter?
I dunno, that’s not my question. Dod you want to claim that .1C doesnt matter? ok, make that claim and back it up. How do Santers results change if the observation record has a .1C warm bias?
Chad? Lucia? Nick Stokes?
How much bias in the record matters? depends on what your testing.
proxy recons. They are done against hadcru. Does a .1C bias or .05C bias in the temperature record impact the calibration period statistics? the recon statistics? I dunno, but I do know that Rob wilson didnt like the crutemp version of local temp in one of his papers so he did his own version for that region.
For pete’s sake. I think it’s a good thing that GISS is public. I also think that it’s not a waste of time for somebody like Tamino or Broberg to set GISS aside, and do their own thing. I think it’s quite useful that they do their own thing. So I’m not saying it’s either/or.
OK, so we can at least agree that the CEI FOI is just gamesmanship?
As for Watts and accountability, I want it to hear it from him. He published something under his name. Does he stand by it? This isn’t a matter of a simple error, or an interpretation that changes a bit as more data comes in. This was shoddy work from the beginning.
Re: MarkR (Feb 26 16:44),
Are you channeling Tamino? I think you are supposed threaten using French Revolution metaphors.
More seriously: I think the notion that the entire AGW position is fraudulent is a bit much.
“heads on pikes”
I hope this is meant figuratively!
Andrew
Lucia. I think you have to prepare yourself for AGW “deceit, trickery, sharp practice, or breach of confidence, perpetrated for profit or to gain some unfair or dishonest advantage.” Fraud.
Andrew_KY (Comment#35249)
Figuratively, Politically, Financially, Legally, Morally etc.
My enthusiasm for MarkR’s stance in the AGW Wars is equal to my enthusiasm for Tamino’s. May cooler heads prevail. And remain unpiked.
MarkR (Comment#35242),
“there will be heads on pikes”
There have been no heads on pikes for a long time anywhere on earth, and as far as I know, never at any time in the USA.
.
If I were you, I would calm down a bit and think about what has (and has not) been done by climate science and climate scientists, and carefully consider what are appropriate responses to documented improper activities. In some cases, researchers who behaved improperly will probably lose their positions (like Phil Jones and perhaps others at UEA), and in other cases, they will probably receive some kind of formal reprimand (like Michael Mann). I hope that everyone in climate science will come away from the recent (unauthorized) email disclosures with a better (or perhaps renewed) understanding that unethical behavior, at every level and at all times, is completely unacceptable.
.
But talk of heads on pikes is not terribly constructive.
.
Please keep some perspective. Most climate scientists, even those who have embellish the many ‘scare stories’ about the consequences of future warming, and even those who have behaved like arrogant SOB’s (altogether too many, I’m afraid), are acting based on a sincere desire to do what is ‘right’. While other people (including me!) may not share their notion of what is ‘right’, and may believe they are in fact doing harm rather than good, this does not mean that they are not trying to ‘do good’ as they see it.
.
I am certain that Phil Jones, Mike Mann, and many others are quite aware of the widespread condemnation that the Phil Jones email messages have evoked; I think it best to give them some time to consider this reality.
Steve Mosher – The JohnV Open Temp runs in 2007 found a 0.35C difference in trend per century which was quite significant at the time. That is the reason why I would like to see a newer run of OpenTemp using USHCN2 to see if it still contradicts the Menne 2010 result which showed no significant difference in trend.
In addition the JohnV analysis implied that a relatively small number of stations had a large influence over the majority. If homogenisation by NOAA has raised the values in those stations where lights = 0 then there is real potential for an upward bias in the GISS processing if it uses homogenised data.
I still remain of the view that people are using different input datasets for analysis with no clear view how station data is processed and passed between them and which dataset best represents the “raw” data.
steven mosher (Comment#35169) February 26th, 2010 at 12:47
pm
Because their data processing.
Weighted the stations according to the number in an area.
Adjusted for stations that didn’t meet standards.
Uses anomolies, to allow for stations that don’t meet standards.
Both approaches have their good and bad points, they made their choice, it appears to give a reasonable result.
LOL of the day.
magicjava:
Not if you area-weight correctly.
It’s a lot easier to introduce bias by undersampling, actually.
“It’s a lot easier to introduce bias by undersampling, actually.”
Is dropping stations considered undersampling. What I have read so far in this thread leads me to think dropping stations does not introduce bias. Am I thinking wrong(muddled) here?
Re: SteveF (Feb 26 18:08),
“There have been no heads on pikes for a long time anywhere on earth”
Didn’t you watch the second series of Blackadder?
Okay, y’all inspired me. Well, and Carrot Eater reminded me that I should get off my arse and do it.
5 hours ago I downloaded the v2.mean.Z file for the first time ever.
I wrote the code to parse it, calculate anomalies, assign each station to a 5×5 grid, calculate the size of the grid, average the anomalies of all stations in each grid for each month, and figure out the total global area covered by stations actively reporting data for each month. This last bit was the hardest, because I have to change the weight of each grid based on the total area of available grids for each month when calculating the anomaly.
Here are the results for the Globe and the U.S. for all stations classified by GHCN as rural, small town/suburban, urban, and all stations.
Embiggen: http://i81.photobucket.com/albums/j237/hausfath/Picture103.png
Embiggen: http://i81.photobucket.com/albums/j237/hausfath/Picture102.png
Now I can do all kinds of fun stuff, since the program works for any number of grids (down to one) and any arbitrary selection of stations. And folks don’t have an excuse not to do it themselves, since I’m neither a mathematician nor much of a programmer.
Remaining drawbacks of my initial approach:
1) I rely on a base period from 1960-1970 to calculate anomalies, and end up dumping all stations that don’t have a record spanning this period. If anyone has suggestions on how to calculate anomalies for stations with non-overlapping records, I’m all ears. This brings us to…
2) The method of calculating grid anomalies is simply to average all the anomalies of each station in the grid for each month. This can be improved with the use of methods like those Chad and Tamino have been discussing.
By the way, does anyone know if GHCN uses the adjusted or unadjusted USHCN data in the v2.mean series?
Zeke,
Is that Urban Heat Island bias sticking out over the last 20 years? Interesting!
Here is a replication of Tamino’s analysis of stations with a record post-1992 and those without. Note that this covers the whole globe, not just the Northern Hemisphere.
Embolden: http://i81.photobucket.com/albums/j237/hausfath/Picture104.png
.
ivp0,
Bear in mind that this is the raw unadjusted data, and shows considerably more warming than GISS or Hadley do over land (e.g. 0.24 C per decade for the raw data vs. 0.19 C per decade for GISS).
Hmmm ok. So the eyeball tests suggests rural vs urban does show a difference for global, but obviously, warming in both. Its’ interesting “suburban” shows the lowest current anomaly for the US.
Sure. But still, for now you have these graphs, and I always think the results obtained using simpler methods are worth knowing even if one thinks the more sophisticated methods are an improvement. In gives us an informal notion of how how much “play” there is in the possible range of results people might get when they argue about what’s the absolutely bestests-most- perfect method.
Re: carrot eater (Feb 26 16:24), I didn’t think you were making claims based on authority. Oddly you were being blamed for evils presumed by the person doing the blaming.
Sorry your comments are getting tossed in the trash bin. I don’t know why the spam filter hates you.
Zeke,
Cool! Very clear display of data and trends. Right off the bat, a replication of Tamino’s dropped-station results.
Urban stations (red) are definitely nudging higher than others in recent decades. This could mean a couple of things. First, if the input data are UHI adjusted in later years, the adjustment seems insufficient (but maybe the inputs aren’t adjusted? Is there ambiguity about how raw “unadjusted” data really are?). Second, some skeptics have claimed UHI adjustments have been made by adjustng past decades’ readings on those stations. That would seem to be ruled out by your graphs. Third, I recall reading (somewhere) a claim that UHI adjustments were spread by homogenization to nearby Rural stations. This analysis wouldn’t address that question, it seems.
Quite a haul for 5 hours of work.
Thanks AMac.
If anyone is interested in playing around with it, the source code is (hopefully) well-documented and is available here: http://drop.io/0yhqyon/asset/ghcn-analysis-zip
It requires running STATA however. I still haven’t made the switch to the wonderful world of R 🙁
Re: carrot eater (Feb 26 16:56),
You misunderstand my question about wasting time. You seem to be, on the one hand, saying you think it’s good GISS is public, while also explaining why people in group “B” shouldn’t have been asking it, and why they should have been deprived of it etc. So, in that context, why should people in groups “B” have been deprived of it? That question has nothing to do with whether or not someone Tamino in group “N” was able to do something useful that did not require him ot have the code. The question is: What’s the point of depriving people in group “B” of the code? To waste the time of people in group “B”? That’s the question.
But if you are ok with them getting the code — and even them having asked, then there is no need to answer the question because I am just misunderstanding your comments which seemed to suggest people in group “B” should not get the code because someone in group “N” (like Tamino) did something good without having the code.
I’m not going to go quite that far because I have no idea what the fellow from CEI was actually trying to do. Maybe if that guy explained to me further, I’d say, “Oh, I get that”. But that particular FOI did look a bit more like just fishing. He didn’t catch any big fish.
Carrot Eater Comment#35234 —
I’m the odd blamer Lucia refers to, above.
Re: my Comment#35229, I apologize for presuming things about you that you haven’t claimed, and that aren’t so. That was carelessness on my part.
I therefore also apologize for addressing those thoughts about deficiencies in climate science to “you.” Whether they are correct or not, that state of affairs isn’t your responsibility any more than it is mine.
Okay, one last graph then time to call it a night.
Giganticize: http://i81.photobucket.com/albums/j237/hausfath/Picture107.png
.
Thats v2.mean_adj – v2.mean, the title isn’t clear in retrospect.
I would have been very surprised if Dr. Roy’s result had been much different from Jones.
Here is what he said he did:
“So far, I have obtained data for the last 24 years, since 1986. The distribution of all stations providing fairly complete time coverage since 1986, having observations at least 4 times per day, is shown in the following map.”
The map has almost no tropical or SH stations.
“I computed daily average temperatures at each station from the observations at 00, 06, 12, and 18 UTC. For stations with at least 20 days of such averages per month, I then computed monthly averages throughout the 24 year period of record. I then computed an average annual cycle at each station separately, and then monthly anomalies (departures from the average annual cycle).
Similar to the Jones methodology, I then averaged all station month anomalies in 5 deg. grid squares, and then area-weighted those grids having good data over the Northern Hemisphere. I also recomputed the Jones NH anomalies for the same base period for a more apples-to-apples comparison.”
There was a significant result though:
“One significant difference is that my temperature anomalies are, on average, magnified by 1.36 compared to Jones. My first suspicion is that Jones has relatively more tropical than high-latitude area in his averages, which would mute the signal. I did not have time to verify this.”
My first question is, how could Jones have more tropical if he recomputed Jones anomalies for a more apples to apples??
My whinings are:
He uses homogenised data NOT raw data.
He uses similar gridding and weighting to Jones.
Most of the stations will have UHI effects.
His start date is after about 1000 stations have already been dropped. He does say he will extend his work to about ’75.
I believe McIntrye has shown that the adjustment procedures tend to simply make every station nothing more than combinations of all the other “near-by” stations.
That is, the pot is stirred before Roy begins.
Which is one reason that the drop-out does not appear to matter. The premise of Spencer’s work here is that each station series is an independent measurement, but that is not so.
That’s the rub, plain and simple.
Surely what we need to see to settle the surface stations issue (if there is one) is a record which consists solely of the rural long record stations? Totally unadjusted, simply the raw readings, perhaps with interpolation to fill in a few missed readings, but no more than that.
If it really turns out that such a record shows no difference from the usual indices, there would be something interesting to note.
I don’t believe, having worked with sampling, that you can change the basis of sampling in the way that the number of stations has changed over the years, and not introduce some bias. Or rephrase that, you could do it, with an enormous amount of work and checking and verification. What I don’t believe is that the kind of work needed to do it has in fact been done.
But hey, maybe this is wrong. Just give me a reference. Not a post hoc reference showing that we did it without much method, but it turned out OK as it happened judging by a few tests.
No, some reference that shows that we first defined the characteristics of the sample quantitively. Then that at every change in makeup of the sample, we preserved those characteristics. Don’t believe this exists, but, show me!
All: “heads on pikes” is a figure of speech. Anyone who thinks no Criminal prosecutions will result if AGW Fraud is shown, is not realistic. Lighten up. Complaints about form are usually evidence that no complaints have been found in the substance of a comment. Is the sensitivity because a lot of the Warmers will have to explain to company Chairman etc. how wrong AGW was, and the company Chairman will point out how much that cost, before firing said Warmer? Also. Is there not a collective responsibility for policy mistakes leading to death by starvation, eg. conversion of agricultural production to ethanol?
Zeke,
I was looking looking at the source, specifically GHCN_Controller.do and this may be due to my unfamiliarity with Stata, but I didn’t see how the area weights were calculated. I had searched for sin and cos, but didn’t find anything that I would expect to be present for area-weighting.
Re: Zeke Hausfather (Feb 26 21:18),
Zeke, I believe GHCN gets its data directly from the CLIMAT reports submitted by USHCN stations (as with ROW). The GHCN data is up within a few days of the end of a month, and I don’t believe USHCN is that quick.
Congratulations on getting that gridding working. For anomalies where you’re lacking data in the anomaly period, the GISS method might work for you. You can calculate the anomaly for each grid (they use grid nodes) rather than individual stations. The argument is that you’re aggregating anyway at that level, so instead of subtracting station means and then averaging, you might as well add the temperatures and subtract an aggregate mean, which will have more data in the period.
Re: Lucia #35120
“Then people can address the station drop out– Roy, Tamino, Zeke etc. did that. That’s a more difficult issue that the ±1C rounding because while it’s unlikely to be a huge effect, it’s not impossible. So, you really, really have to check. It looks like both Tamino and Roy are doing thorough jobs on that”
As I said, I just wish Tamino’s job had been a little more thorough! Publishing a graph that shows dropout has cooled the 1920s-1930s by 0.25 degrees or so and warmed the late 1980s by the same amount but then implying no overall warming trend has been introduced seems to me to be an overstatement. These are the largest anomalies (he himself draws attention to them) and they must surely have introduced some warming trend. If he wants people to accept that this trend is insignificant (and I don’t have the stats to say either way) then he ought to show that this is so.
The “Warming” comes from the adjustments. All the main consolidators of Temp data use the same Journal refs for their adjustments
The cumulative effect of all adjustments is approximately a one-half degree Fahrenheit warming in the annual time series over a 50-year period from the 1940’s until the last decade of the century.
The following graph shows how the annual raw (areal edited) mean temperature anomalies compare with the anomalies from the data set containing all adjustments (final). The difference of these two time series is shown below.
OK. Images are shown here. http://www.ncdc.noaa.gov/oa/climate/research/ushcn/ushcn.html
“heads on pikes†is a figure of speech. Anyone who thinks no Criminal prosecutions will result if AGW Fraud is shown, is not realistic. Lighten up.
.
Mark, your comments are perfect examples of denialism:
.
you are obviously completely clueless about the science. willing to ignore all facts. willing to accept every lie that fits your beliefs.
.
and you are giving a really nasty spin to everything.
.
but still a short reply to your most recent false claims:
.
no fraud will be shown. neither will there be criminal prosecution. the warming does NOT come from adjustments. (why not look at satellite data, ones in your lifetime?)
See what happened to the Bankers? That’s what will happen to the Warmers times 10. Think this isn’t going to go legal? Dream on. There will be no “polite search for common groundâ€, there will be heads on pikes.
.
ouch. i actually missed this gem. so climate change scientists would get even higher bonuses, the year after their “fraudulent” behaviour brought the world economy nearly to a collapse?
.
i want the banker treatment as well, and i want it now. it is about as far from “head on a spike” as things can get.
sod. Stop squirming. What’s done is done.
Flashback April 2009: S. African UN Scientist: ‘The whole climate change issue is about to fall apart — Heads will roll!’ http://www.climatedepot.com/a/160/S-African-UN-Scientist-The-whole-climate-change-issue-is-about-to-fall-apart–Heads-will-roll
I guess the science *wasn’t* ever settled: Check out the spinning and backpedaling here
Climate-Change Group IPCC Moves to Fix Crisis Damage – WSJ.com
http://tomnelson.blogspot.com/2010/02/i-guess-science-wasn-ever-settled-check.html
all your “knowledge” is based on denialist sites.
.
you rely on the quote of a bad source, quoted on a worse source, requoted on a even worse source.
.
what you say has zero value.
.
so how does UHI effect satellite data again?
” climate change scientists”
Wow. That says it all.
Is aggregating
Intensive variables
Nonsense, asks Louis?
=================
8.8 Quake rocks Chile.
Tsunami warning for entire Pacific.
California cut funding for Tsunami mitigation. But there’s endless dollars to stop and to “understand” “climate change”. Sheesh.
http://www.hawaii247.org/2010/02/26/earthquake-rocks-chile-tsunami-advisories-for-chile-peru-and-ecuador/
Re: Graph at Zeke Hausfather (Comment#35282) —
Nice! Like any good answer, it brings up questions.
As with Tamino’s and others’ results, the first thing I notice is the modest absolute size of the anomalies.
But the starting point is going to make a pretty sizable difference to the adjustments’ contribution to the perceived long-term trend, in the case of the US (red). Cf. 1890-present and 1905-present.
The variations in the amplitudes and signs of the anomalies over time form two pretty striking patterns, and the US (red) and global (blue) patterns are quite different from one another.
It would be interesting to see what the cause of the 1885-1895 and 1995-2005 “humps” in the US trend are due to. Big adjustments on relatively few stations, or modest adj’s to many?
And post-1995, some major instability is introduced into the global trace, not due to the US contribution.
Naive question, how raw is raw? Suppose the “raw” entry in v2.mean for June 1920 for Plains, Georgia is 30.5 C. Is “30.5” the arithmetical mean of the daily average as originally recorded for that month, simply transcribed from paper to computer-readable format? (Or the mean of the means of the 2, 3, 4 stations in Plains that were active that month?) That would dispose of issues brought up at WUWT (IIRC) about adjustments (sometimes?) taking the form of retrospective changes to prior readings.
aMac
You could read the data sources he names and look it up. I didn’t pay attention to this feature because Tamino did something to specifically focus on the effect on the drop in the number of stations.
Given the total number if isolated criticism, I think it’s actually useful for people to look at the answer to each in isolation. Zeke has, however, been mentioning issues with the adjustments. He has a graph in this comment: Zeke Hausfather (Feb 26 23:30). I think we may need him to wake up and return so we can ask him questions about it.
Amac, I would imagine that GHCN ‘raw’ means ‘as delivered by NCDC’, which then gets you to Dr. Longs paper.
I tend to side with cliveres comment earlier in the thread –
‘I still remain of the view that people are using different input datasets for analysis with no clear view how station data is processed and passed between them and which dataset best represents the “raw†data.’
so Zekes graph has some relevance to Taminos good work, but has no relevance to Dr. Spencers random data validity check of his partial calibration data, nor do any of them contribute anything to a desire by some to demonise Anthony or Chiefio over a completely different data set and approach?
Chuckles–
I don’t see Roy or Zeke demonizing Anthony or Chiefio. Anthony and Chiefio raised a question. On 23 January 2010 , Joe D’Aleo and Anthony published Surface Temperature Records – Policy-driven Deception? The document ask important questions. The questions are being discussed widely and in news channels. Naturally, people want to examine each question and figure out what the answers are.
It’s true that Tamino is deploying his usual level of bile when posting — but that doesn’t mean that Zeke, Roy or the guys at CCC are doing anything other than looking at data and trying to discover what the answer are. If anything, what Zeke and Roy are doing should be seen as flattering to Anthony. These people are devoting hours of their lives to answer the questions Anthony asked.
sod (Comment#35314) “so how does UHI effect satellite data again?”
The satellite record has been adjusted for years to fit the surface temp record. Therefor if the Surface Temp is not correct in any respect, the error is transferred to the Satelllite dat by adjustment. Next.
If you’re a “climate scientiste” data is only data if it fits your theory. Follow the link in 35306 to see how NOAA mess with the data.
Lucia, Indeed, it is simply my usual bad phrasing that you are seeing. I had no intention of casting any aspersions at Roy, Tamino, Zek, the guys at CCC, Chiefio, Anthony or anybody.
I was actually trying to point out that Roy uses a certain dataset for his purposes, ditto Tamino for his with a different dataset. And so on through the list. And I was trying to suggest that it is unwise to suppose that any inferences can be drawn from one set of results to another. Taminos results say nothing about Roys, or vice versa. Zekes on the other hand seem at first glance to confirm Taminos, but also say nothing about Roys.
On the demonising side, a from number of comments in the thread, there are people keen that these results be extrapolated to Anthony and Chiefio, and I was trying to caution that that extrapolation may be unjustifed.
Re: Chuckles (Feb 27 07:59),
I don’t think it’s unwise to draw inferences about the answer to the questions: Does the drop in stations during the 80-90s result in a strong bias in surface trends? And is the bias showing more warming? Three people (actually, now 4 including ccc) have computed it three different ways with different data sets, and found that a drop in stations does not result in any strong bias in the trends. To the extent that all four analyses answer the two questions, “Does the drop in stations during the 80-90s result in a strong bias in surface trends? And is the bias showing more warming?” all have relevance to each other and we can draw inferences about the answer to that question.
Of course, one may look at it a different way, not each analyst used different data sets and to that extent, we don’t expect each to be relevant to the other in the sense of “doing exactly the same thing”. So, if someone wants to ask: Should their results for monthly temperatures match to 8 significant figures? The answer is no. Moreover, if they don’t we can’t infer much of anything other than there is measurement uncertainty in the data (which we already knew.)
Lucia, There you see, you phrase it much better than me.
I was cautioning that It is quite common for people to assume that what is being answered, and what they would like answered are the same thing.
Chuckles–
The question people think they asked is often not the one the answerer answers. This can happen for many reasons including:
a) the questioner understands the question but wants to answer something different and
b) the questioner doesn’t understand the question, and honestly thinks they are answering it.
There are probably other reasons too!
lucia (Comment#35346)
February 27th, 2010 at 9:19 am
In a) and b), I think you mean answerer when you say questioner.
Should I put that in the form of a question? 🙂
But when you disagreed with what you thought I said, it was because you misunderstood what I intended to say.
The answer is 42. 🙂
You don’t need to post the question!
Mice may not know the questions, but every knitter can tell you t hey are, “How many stitches do you cast on for a scarf?” and “How many stitches do you cast on for a hat?” or “How many ounces of yarn do I need for a sweater?”
( Some beginning knitters don’t know what information to include in a question, so the answer involves asking a series of questions. Or just borrowing the well known answer to everything. 🙂 )
Chad,
The gridding process is done in the GHCN_Metadata.do file. I probably should have been clearer about that… The equation I use for grid weights is:
gen grid_weight = 4 * _pi^2 * 6378.1^2 * cos(lat*_pi/180) * 5/360 * 5/360
AMac,
I’m pretty sure I’m looking at the rawest of raw data in v2.mean for the U.S. since the difference between v2.mean and v2.mean_adj for U.S. stations is nearly identical to the adjustment chart given by NCDC for USHCN data:
http://www.ncdc.noaa.gov/img/climate/research/ushcn/ts.ushcn_anom25_diffs_urb-raw_pg.gif
Zeke,
“I rely on a base period from 1960-1970 to calculate anomalies.”
I am a bit puzzled by this. Your graphs of anomalies (comment 35372) all show that this period averages well below the baseline. How can this be correct if that is the period used as the baseline?
Nick Stokes,
Thanks; I’ll play around with trying to calculate grid-level anomalies instead of station-specific anomalies and see how well it works.
SteveF,
That was the baseline for each individual station; I guess after aggregating by grid and weighting it no longer averages 0 for the whole series. That is somewhat unexpected though, I’ll look to make sure nothing buggy is happening…
Zeke,
A doubt on adjustments: your graph at comment #35282 shows the adjustment range for the lower 48 data covers almost 0.4C (maximum to minimum), yet your graph of “Difference Between Raw and Final USHCN Data Sets” (another measure of adjustments to the raw data) shows a full adjustment range closer to 0.6C, and quite different in shape from the graph of comment #35282. Should they not be just about the same in size and shape?
.
A further doubt on adjustments: the adjustments appear to represent the majority of the overall warming, yet your ‘raw’ data shows a temperature trend which is very comparable to the ‘adjusted trend’; are you certain that the data you are using has not already gone through some kind of adjustment process?
Re my earlier post in which I stated Stokes reimplementation is essentially a version of 1). I was referring to Nick Barnes, et al,‘ “bug-by-bug” reimplementation of GIStemp in Clear Climate Code (ccc-gistemp). Sorry about the Nick confusion.
And they have a post up regarding the station drop-off as well:
http://clearclimatecode.org/the-1990s-station-dropout-does-not-have-a-warming-effect/
Zeke Hausfather (Comment#35356),
“I guess after aggregating by grid and weighting it no longer averages 0 for the whole series.”
.
What? Any weighting/combination of zero should be zero. This looks fishy to me.
Roy Spencer has weighed in on the bias in temperature records and appears to confirm suspicions:
http://www.drroyspencer.com/2010/02/spurious-warming-in-the-jones-u-s-temperatures-since-1973/
One interesting ascpect is Roy does not use Min-Max for his average temps. He uses actual measurements at 00, 06, 12 and 18
SteveF,
You are right, there was a bug 🙁
I forgot to uncomment out
*drop if year > 1970
*drop if year < 1960
when calculating individual station anomaly base periods (I was playing around with some other methods initially), so it was giving the anomaly for each station relative to the full record for that station, rather than the anomaly relative to the base period. This is problematic because grids with older stations would often show lower temps than grids with newer stations. Oddly enough, fixing it slightly increases the warming trend globally. Need to check the U.S. now…
http://i81.photobucket.com/albums/j237/hausfath/Picture43.png
Zeke,
I figured out the big discrepancy in the size of the adjustment: you used C and they used F (silly me, always thinking in C). The range of adjustments is just about the same when converted to C.
Re: Zeke Hausfather (Feb 27 10:05),
I’m asking a question for clarity. The title in this figure says Difference between Raw and Final. The note below the title says “Final-Raw”:
So, is this “Tanomaly_based_on_final_adjusted – Tanomaly_based_on_Raw” ? If yes, does this mean the Tanomaly_based_on_final_adjusted in 2000 is roughly .6F warmer than computed based on raw data? Because it sounds like you suggested the opposite in comments above.
I admit to not wanting to dowload various gridded sources of temperature data– and would prefer to know to just understand the notation on the graphs I’m looking at.
lucia (Comment#35365),
You are right (was just about to say the same thing). The adjustment goes the other way. Nobody really believes the globe has warmed by >1C over the past 100 years.
Lucia,
The graph I posted earlier was v2.mean_adj – v2.mean (raw)
The USHCN graph is USHCN_adj – USHCN_raw
So it should be apples to apples.
Zeke,
Something is not right. If you add the adjustment to your raw data curve for the lower 48, you get a crazy warming that just can’t be right… the adjustment has to go the other way (UHI, economic growth, etc.).
Zeke–
I interpreted your graph that way. The problem is the “word vs math” issue in NOAA’s graph. I’m googling to see if I misunderstand the convention of “Difference between A and B”. Is it “A-B” or “B-A”? Or is there is no standard. I actually don’t know!
The info uner the title seems clear.
(Although, I thought I knew and seemed to know in 8th grade. The web discussions are confirming what I thought I knew…)
SteveF,
The initial U.S. graph I posted was for the whole U.S., not just the lower 48. This one of just the lower 48 might make things clearer:
http://i81.photobucket.com/albums/j237/hausfath/Picture44.png
Also, source code updated with the bug fix: http://drop.io/0yhqyon
Zeke–
Much better graph. No possibility of confusion when writing titles! The most recent anomalies are slightly larger using adjusted data rather than raw.
Oh, and just to make sure I’m getting realistic data from my method, here is the lower 48 for GHCN raw, GHCN adjusted, and GISS:
http://i81.photobucket.com/albums/j237/hausfath/Picture45.png
“Gareth” gave an interesting quote on WUWT with regard to the counter intuitive NOAA adjustment:
Application of the Station History Adjustment Procedure (yellow line) resulted in an average increase in US temperatures, especially from 1950 to 1980. During this time, many sites were relocated from city locations to airports and from roof tops to grassy areas. This often resulted in cooler readings than were observed at the previous sites. When adjustments were applied to correct for these artificial changes, average US temperature anomalies were cooler in the first half of the 20th century and effectively warmed throughout the later half.
http://www.ncdc.noaa.gov/oa/climate/research/ushcn/ushcn.html
Zeke,
Thanks for the additional graphs. But I remain surprised. How can the adjustment process raise temperatures relative to raw temperatures during a period of substantial economic growth/development? How can UHI not be the dominating adjustment? Your graph of continuous land station raw data (Comment#35272) shows that the increase in temperature in urban stations has been higher than in rural stations, and it seems to me that both would have to be subject to some UHI effects, yet the adjustment curve (your Comment#35282) are opposite a correction for UHI effects. This really puzzles me.
I need to do some early spring cleaning today, but before I run off I’ll discuss one more set of graphs.
As most folks are aware, SPPI released a report last week by one Dr. Edward Long that was discussed on WUWT here: http://wattsupwiththat.com/2010/02/26/a-new-paper-comparing-ncdc-rural-and-urban-us-surface-temperature-data/
His major point was encapsulated in this graph of U.S. raw and adjusted station data:
http://wattsupwiththat.files.wordpress.com/2010/02/long_rural_urban_raw.png
Now, his method was described as “Both raw and adjusted data from the NCDC has been examined for a selected Contiguous U. S. set of rural and urban stations, 48 each or one per State.” Immediately this should set off some suspicion that the sample size is a tad small, and ripe for potential cherry picking. Using the raw GHCN data from U.S. stations and the adjusted data (which, as shown above, reflects the USHCN adjustments), we can replicate Dr. Long’s method using ALL U.S. stations in GHCN gridded in 5×5 lat/lon cells. Each station provides an indication if it is Urban, Small Town, or Rural in the metadata, as well as the population density of the region where it is located.
Comparing raw rural and urban data in the lower 48 we get:
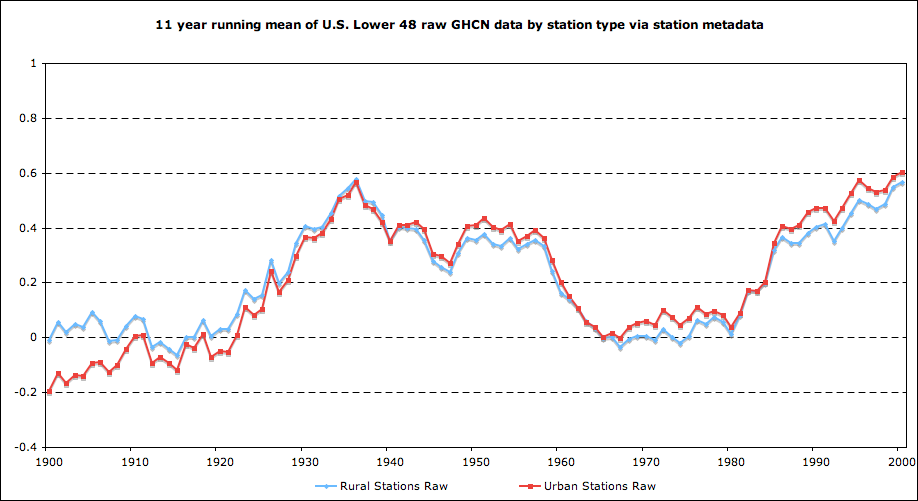
http://i81.photobucket.com/albums/j237/hausfath/Picture49.png
And adjusted rural and urban data:
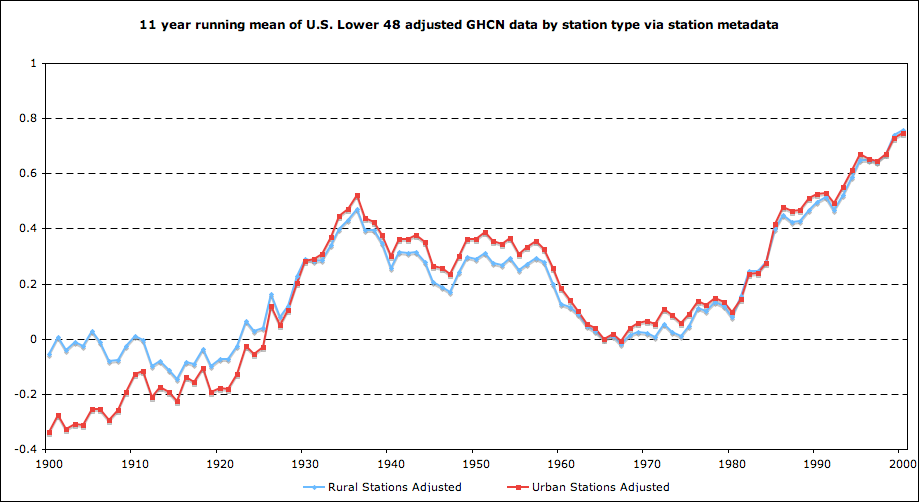
http://i81.photobucket.com/albums/j237/hausfath/Picture48.png
Looks like Dr. Long was off by a moderate shot (sorry, couldn’t resist :P). Anyhow, I’ll probably expand this a bit into a blog post next week.
.
SteveF,
USHCN describe why the do adjustments the way they do over at http://www.ncdc.noaa.gov/oa/climate/research/ushcn/ushcn.html#QUAL . The GHCN adjustments increasing global temperature slightly was a tad more surprising for me, since I didn’t know that previously.
SteveF
In comment harold (Feb 27 11:42), you’ll find this link.
http://www.ncdc.noaa.gov/oa/climate/research/ushcn/ushcn.html
Scroll down to read the discussion near this graph:
harold (Comment#35380),
Thanks for the comment and web page address. The adjustment process used by NOAA is much more complicated than I imagined.
Lucia #35384,
The yellow line is the Station History Adjustment Procedure graph – relocations and environmental changes.
I’d also note that your/Harolds link is to the GHCN version 1 procedures/info. Zeke is using the version 2 data.
Chuckles,
The link is to USHCN version 1, not GHCN version 1. They are completely different, since USHCN v2 came out last year (or sometime recently) and GHCN v2 was released in 1997.
Zeke, Indeed, I swap USHCN and GHCN every time, what would one call that? Acronymic dyslexia perhaps?
Not helped by the fact that the link was to USHCN, with a V1 lurking on the page, which was what triggered the thought.
Zeke, Lucia,
Detailed descriptions of the adjustment procedures used on the GHCN raw data are all (apparently) only available behind pay walls. I just love it when taxpayer funded research results don’t belong to tax payers (like me!). I’m not going to pony up $100 or more to see if the procedures used actually make any sense to me. So there is noting more to be said, except that I sure wish Congress would do something to ensure publicly funded research results are freely available to the public.
SteveF
That does bite. It should also change.
If NOAA, NASA, NSF, DOE,DOD etc. all made it a policy that they would never pay page charges unless a paper was available to the public, I suspect journals might modify their business model.
Alternatively, these agencies could insists that copyright was not exclusive and they would retain the right to post original unformatted-by-the journal versions at their sites. Or, the clearance process at DOE, NASA and NOAA could insist that papers cleared to submit to journals would all also be available at the labs. (This means we would have access the the version *submitted*– which actually might be a GOOD thing.)
I actually don’t know why they agencies don’t do this– other than the fact that the ‘system’ thinks only academics and those working at research labs with libraries that subscribe to journals “matter”. This is clearly wrong.
SteveF are you referring to a publication?
If so, just contact the first author and request a reprint. His secretary will handle the request for you.
Lucia,
“I actually don’t know why they agencies don’t do this– other than the fact that the ’system’ thinks only academics and those working at research labs with libraries that subscribe to journals “matterâ€. This is clearly wrong.”
We completely agree. I could do an end around and ask my oldest son (soon finishing grad school) to grab a copy of the .pdf’s (he has free access to everything), but that would be “theft of intellectual property”. I find it all rather sad.
Carrick (Comment#35396),
Well maybe things are different for these authors, but whenever I have published anything, I have had to pay for copies.
Zeke, it would be tremendously helpful if you could add a legend to your figures! Which is light-blue what is red? When you say difference between two curves, spell it out using math. E.g.,
adjusted — raw
lucia: the question of the adjustments is not separable from the station drop out question, and neither of the methods presented serve to actually test the station drop out question.
First there needs to be the leg-work to definitively conclude that the raw data is independent.
As I understand it, the GISS “raw” dataset is already cross contaminated; for instance, US stations match the USHCN FILNET data not the ‘raw’ data. FILNET, remember, is a procedure which essentially makes every temperature series a linear combination of near-by ones.
So the failure here to establish what “raw” “raw” is and use that to perform the analysis makes Zeke’s and Tamino’s work unconvincing.
SteveF:
In most journals I’ve published in, you get a certain number of reprints for free.
(That’s also what our overhead accounts are for, when it isn’t free.)
Carrick,
I’m not sure what you are asking for; there are legends beneath each of the graphs. The one for the U.S. GHCN adjustments even says “Adj – Raw”.
Perhaps they aren’t loading completely for you? In that case, try the link below them.
.
Jon,
GHCN v2.mean data is the raw data from CLIMAT reports filed by governments that includes the mean, max, and min temp for that station for the month. There are no adjustments, only some rudimentary QC to throw out stations in Texas, for example, that are reporting temperatures colder than Siberia (to give a recent example 😛 )
Carrick,
Yes, but the number given to me was very small (like 20 – 25), and I always ended up either having to buy more (at a king’s ransom) or refusing people a copy.
Thanks Zeke, I’m just blind (nearly true, presbyopic is a bitch). I’m used to seeing them at the top or in the interior of the graph. My bad.
[Actually I would put an axis label there, and adjust the font sizes a bit larger.]
For some reason, many people like graphs with type and line sizes that make sense inserted in journal articles with two-column formats and use them everywhere. I think some are used to the notion that certain things look more “scholarly”, and that’s the way the present them.
Given resolution of monitors, size of screen, and the large number of readers wearing eyeglasses, on the web, font sizes, lines and symbols that look like a madison avenue PR guy was presenting to a people sitting on couches drinking beer often make more sense.
Zeke,
.
You are making the assumption that what NCDC calls rural and what Dr. Long calls rural are the same thing.
.
From the SPPI paper:
.
.
Those definitions require that a large percentage of the stations are classified as neither urban nor rural. You need to check each station that you picked and make sure it meets that criteria before you can claim to have rebutted anything that Dr. Long said.
Raven:
If Long didn’t geographically weight his average, there is nothing to rebut.
Okay, apartment is clean, back to graphing. Lucia, let me know if I’m cluttering this up too much…
When I posted my initial analysis of dropped stations, I was somewhat bothered by how different it was from Tamino’s. Luckily, SteveF helped identify a bug in my initial implementation that involved the way station anomalies were calculated, and had the effect of giving stations with longer histories baselines that were further in the past. This was particularly significant when comparing data series selected by length (e.g. post-cutoff vs. pre-cutoff stations).
So, here is the new version of that chart, which matches Tamino’s rather well (though again, its for the whole globe and not the N. Hemisphere):
http://i81.photobucket.com/albums/j237/hausfath/Picture55-2.png
Now, what else was there to the whole dropped stations arguement? Oh, Canada! Lets take a look at geographically weighted Canadian temp records pre and post-cutoff.
Here is what we get for the whole of Canada:
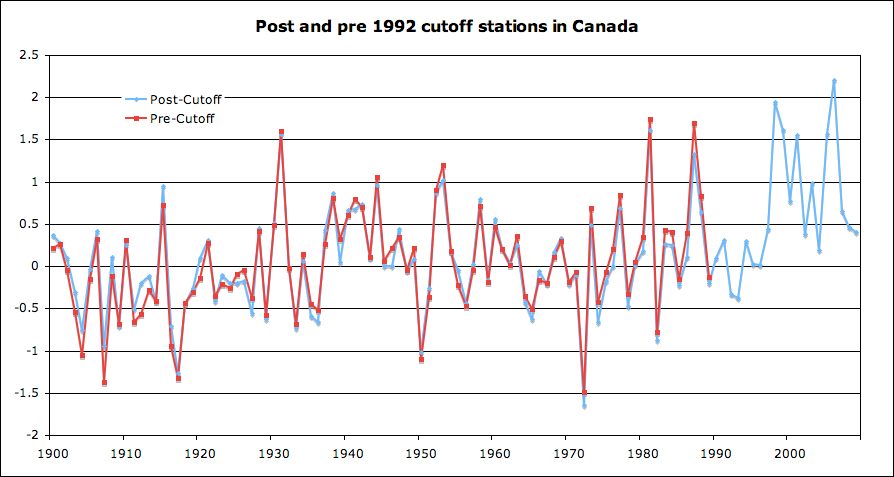
http://i81.photobucket.com/albums/j237/hausfath/Picture56-3.png
And here is > 60 degrees latitude:
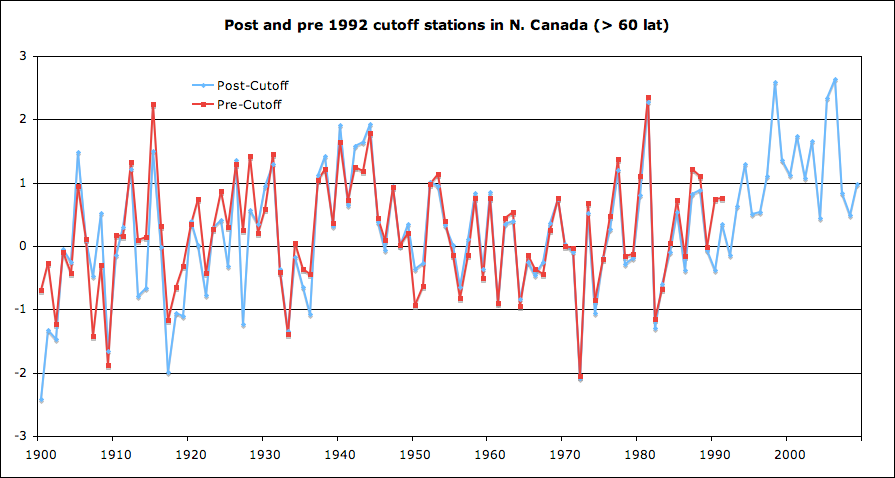
http://i81.photobucket.com/albums/j237/hausfath/Picture57-2.png
What is interesting is how similar the series are despite the relatively small number of stations in both. I would argue that this indicates that micro-site biases probably aren’t huge for any individual station, and that temperatures are strongly correlated within regions, but of course these graphs cannot in-and-of-themselves show that.
.
Raven,
Rural is rural. If you want an analysis of microsite biases, try Menne, but I’m not planning on visiting hundreds of stations to count the number of sheds close by. I rely on the metadata for the basic designation.
Zeke,
.
1) Your choice. But don’t make claims that you can’t support with the analysis that your are willing do to.
.
2) Rural is not necessarily rural and you cannot assume that the NCDC classification is correct.
.
3) Menne’s analysis is completely meaningless because it compared adjusted data – not raw.
Carrick,
.
You don’t need to use spatial weighting if all you are doing is demonstrating a bias in the adjustment algorithms. i.e. even if the the bias is the result of a subset of the stations that happen to be geographically concentrated the claim that the adjustments look wrong is still valid.
Raven,
When Menne wrote:
“[E]stimates were calculated using both the unadjusted and adjusted (homogenized) monthly temperatures” he was being pretty clear. And the tables are pretty straightforward. If you don’t believe me, email him and ask him what “unadjusted” data was used.
> Lucia, let me know if I’m cluttering this up too much…
Keep posting and discussing! (sez one pseudonymous reader).
the “sceptic” argument works like this:
.
it is the adjustments. use unadjusted data.
.
people use unadjusted data, same effect.
.
it is an UHI effect. only use rural stations.
.
people use rural stations, same outcome.
.
but the microsite effect! only use class 1 stations.
.
class one stations are used, results stay the same.
.
final sceptic argument: the sample numbers are too small. you don t have enough raw, rural class 1 stations. and there is darwin station…
the values are meaningless!!! it is a fraud. how else could so many different approaches give the same result!
sod,
.
You are missing the point. If a meat grinder homiginization algorithm adds adjustments to a site that don’t make sense then there is a problem with the algorithm.
.
If different tests seem to show that homiginization problems ‘make no difference’ then the question is why those homiginizations are used in the first place (i.e. the only possible rational for doing homiginization is because it *does* make a difference).
Zeke (#35383),
In the raw and adj graphs the urban starts lower than rural. Any thoughts on why?
Raven:
This is only partly true.
What matters is how large the effect of the adjustment of a given station is on the weighted data, and in particular how large the magnitude of that adjustment is in comparison to the uncertainty in your final answer.
Suppose hypothetically 90% of your stations were urban, but had a net geographical weighting of 10%. By using the unweighted average you would be exaggerating by a factor of 9 the effect of the urban stations.
I choose these numbers to illustrate the issue here.
It is completely farcical to use unweighted data to discuss what effect it would have on the weighted data.
Tony,
Good question! There are only 30 odd urban stations with records back that far, so it might be regional effects cropping up. Remember that GHCN only uses 400 of the 1200-odd USHCN stations, so its a bit of a smaller sample (the U.S. being rather over-sampled as it is). If I have time later, I’ll try to run some numbers with raw and adjusted USHCN data (and perhaps USHCN raw vs. USHCN v1 vs. USHCN v2), but that data is in a bit of a different format so it would take some work.
.
sod,
That made me chuckle.
.
Raven,
Menne et al compared both unadjusted (e.g. non-homogenized) data to adjusted (homogenized). If you are still convinced that he somehow used unadjusted homogenized data (which is a bit of an oxymoron), email him and ask.
.
By the way, if anyone wants a specific temperature record to look at (say, suburban stations in India vs. rural stations every second February in Bolivia), let me know. I’m out of interesting things to look at for the moment.
Thanks Zeke,
Some of your charts are 1900-2000 when the data runs 1880 to present. Could you post the full run?
Tony,
Full run of which chart? Technically the data runs back to 1760 or so, but you start assuming a few stations represent the whole world at that point, and god only knows what the equipment was like 😛
I’ve thought about weighted versus unweighted comparisons of urban versus rural and the problems are even worse than I originally anticipated.
If the urban stations have a different average latitude (and possibly even longitude) than the rural stations, you’d still expect a difference in average trend just due to the dependence of the trend on latitude.
Any analysis of the urban versus rural has to correct for this, especially if you want to go back into the early records when you had a very sparse geographical sampling. [I know for a fact that CRUTEMP3 has a problem with the way it weights the average when the spatial sampling of stations becomes too sparse.]
Also there are reasons to expect significant differences between coastal locations versus inland and (smaller) effects from the altitude of the station.
Doing the comparison “right” appears to me to be non-trivial, and while the fast-and-furious approach of just doing unweighted averages gets you an answer quickly, it has absolutely zero probative value for the effect of UHI.
Carrick,
.
Why would the differences change over time?
The rural/urban stations matched up well until the 60s.
The unweighted comparison suggests that something fishy is going on that needs to be explained.
.
In any case, geographical weighting depends on the grid cell size. Why is an unweighted average in a 5×5 block fine but wrong for 25×25 block? It is the same algorithm applied at a courser scale.
To expand on my further point:
What if we use a tiny grid size e.g. 1kmx1km?
What is done with the grid points with no data?
Leave them out?
How is that mathematically different from an unweighted average?
I am starting to wonder if the bias can be introduced by the weighting algorithm rather than the homoginization algorithm.
You are starting to appreciate the extent of the conspiracy at last.
Glad that we agree that this point matters. Once you validate your claim by comparing the data you extract from that dataset and the original data prior to being collated you’re on your way to building a compelling case.
Is that so?
The GHCN rural metadata is grossly out of date–and questionable whether the GHCN definition of rural was ever useful. This a point even agreed to by Hansen–which was the very motivation behind his night-lights methodology.
Jon,
Give me a list of truly rural stations and I’d be happy to give you a grid-weighted anomaly for the U.S.
However, all I have at the moment is the station metadata designation. Oddly enough, Dr. Long used that exact same metadata designation to choose the rural stations for his analysis, if you read his manuscript.
Furthermore, there is no evidence that microsite issues cause any structural bias in the temperature record. Nada. Zilch. Every paper published so far on the subject or attempt to model it at scale (Menne, John V, Peterson) have found no significant difference between the “best” stations and the adjusted record.
Zeke, Thanks for the reply.
In your comment(#35378) you have a chart from 1880 – present.
In #35383 from 1900-2000.
In#35416 from 1900- present.
I was wondering if it might be possible to have a consistent time axis to help those more challenged ( such as myself).
I was also thinking of the TOBS adjustments which theoretically produce a bias. Seems to me if theoretically real microsite issues cannot be shown to have bias that shows up in the results then it is odd to say that the theoretical TOBS bias show up in results since the magnitude of the TOBS bias is small compared to the magnitude of the microsite issues.
.
I suspect the TOBS adjustments are only accepted as ‘real’ by climate scientists because they allow them to increase warming trends. If the theoretical bias reduced the trends you can bet they would use the ‘it does not make any difference’ argument that they use with microsite issues.
Raven:
I’d be willing to bet that the latitude effect is much larger than the UHI one. If you aren’t controlling for latitude effect, everything else you do is meaningless with respect to UHI effects and other very likely small corrections to global mean temperature.
5°x5° isn’t optimal either, though it would be easy to show that 25° is entirely too coarse.
Optimally you set the sampling size by the correlation length (east-west as well as north-south) between adjacent temperature stations.
Most of the dependence is in latitude not in longitude,
e.g., see this,
so at first blush what you would do is average over bands of constant latitude, then average over latitude using an appropriate weighting function [cos(latitude) is not correct either if you are integrating over just land surface temperature].
If you had missing grid points at your selected grid resolution, you’d normalize each latitude band by the number of non-zero cells at that latitude. [You could get more sophisticated than this but given the overall uncertainty in the measurements, I’d be surprised it if lead to a statistically significant shift in the central value of the estimate.]
If you have a really dense set of points (say uniformly sampled) you just average over them. As soon as you do nonuniform you are left with some form of resampling.
I can put this up in equation form if that would be helpful.
Spencer’s latest blog (eg: http://wattsupwiththat.com/2010/02/27/spencer-spurious-warming-demonstrated-in-cru-surface-data/)
shows
a) that most of the US warming is in Jan/Feb
b) that CRU’s trend is greater than continuous raw station data unadjusted for UHI
Why?
Looks like Spencer discovered the difference between GHCN raw and adjusted data for U.S. stations : http://wattsupwiththat.com/2010/02/27/spencer-spurious-warming-demonstrated-in-cru-surface-data/
😛
I think comparing GHCN raw data to his ISH data would be more interesting.
Zeke: I’ve only spent time looking through Vliet’s work.
Nonetheless, the basic problem with all of these studies revolves around the issue of classifying stations as rural. I think we can agree that if we were to randomly assign a station as rural or urban, than we would not expect to find a distinction between the data.
As I understand Long’s his list of stations is small because he did his own QC in selecting his stations. I’ve not dug into his work too deeply as of yet. So I’m reluctant to say more or be nearly so dismissive as you appear to be.
John Vliet’s work was marred by the use of GISS “raw”. GISS “raw” is not raw. It incorporates the USHCN FILNET dataset. The problem with FILNET is that it basically stirs all stations together to a degree.
Consequently when you attempt to fracture the dataset using the Surface Station rankings you get… nothing.
Everyone who touches this subjects seems deliberately obtuse about this issue. Thus, for instance, the importance in establishing first and foremost that the dataset is “raw” before beginning any comparative analysis.
Zeke:
I was curious about your “whole Canada”/post-cutoff plot in comment #35416, so I downloaded v2.mean, pulled out all RURAL Canadian stations that reported in/after 1993 AND had the full 11 years (1960-1970) available to compute a base mean. I plotted all of the individual anomaly time series on one plot.
I get the big drop in 1972 and the spikes in 1981 and 1988 like you do, but after the spike in 1998, the rural stations all appear to be cooling. My initial impression is that the spike you show in 2006 may be coming from the urban stations. Also notice that all stations break in the early 1990s and when they come back, they are “stepped up”. This may be real, but sure makes one go hmmm.
Re: Jon (Feb 27 21:47),
GISS “raw†is not raw. It incorporates the USHCN FILNET dataset.
Actually, that isn’t true, at least according to statements output by their code.
From do_comb_step0.sh:
“echo “replacing USHCN station data in $1 by USHCN_noFIL data (Tobs+maxmin adj+SHAPadj+noFIL)””
and sure enough, their program USHCN2v2.f does just that.
On the issue of gridbox size, NCDC has this interesting read. 2.5° x 3.5° looks good for the U.S.
torn8o,
Here is Canada raw rural:
http://i81.photobucket.com/albums/j237/hausfath/Picture58-1.png
I suspect the differences can mostly be explained by looking at the y axis (well, and maybe a bit by spatial weighting). Your 2000ish spike has some really high values but also some not so high ones. Try doing a simple mean of all the stations for each year and see how those two spikes look.
Also, I managed to replicate Long’s method somewhat:
http://i81.photobucket.com/albums/j237/hausfath/Picture60.png
Anyone happen to have his email handy so I can ask him a bit more about his selection criteria? The paper isn’t particularly clear, and I smell a bit of a cherry, especially since not all the stations he used in his rural set were, shall we say, particularly rural.
http://i81.photobucket.com/albums/j237/hausfath/Picture59.png
Nick: how does that contradict what I said? It does not. GISTemp downloads the USHCNv2 data including the FILNET adjustments and then removes them.
USHCN2v2.f is the program used to do that, and its existence confirms rather than denies what I said.
I *did not* say that the GISS adjusted series contains the FILNET corrections. GISS has their algorithm to stir the pot, and that’s an independent issue.
Does anyone happen to know the latitude/longitude extent for “North America” as defined in the snow extent data from the Rutgers Global Snow Lab? I’ve downloaded all the model data available for snow cover and need to figure what areas to mask out.
Chad,
Allan Frei suggested I use:
“About 20.7 million sq km without Greenland for the area from 20_N–90_N and 190_E–340_E.”
When I asked him that question. He also mentioned that:
“The units are “the fraction of the land area from 20_N–90_N and 190_E–340_E covered with snow.†This is essentially N. American north of 20N. The reason we kept the units as fractional, rather than absolute, area is that the models have different resolutions, and therefore different total land areas for North America.”
Re: Jon (Feb 28 00:15),
Well, OK, they import a file which has data before and after applying FILnet. But USHCNv2.f is just an editing program, which selects the noFIL data from the file. No arithmetic is done (except converting F to C). You said “The problem with FILNET is that it basically stirs all stations together to a degree.”. Maybe so, but that’s not a problem for GISS – they don’t use that data.
Also, here is a fun replication of Spencer’s analysis using v2.mean and v2.mean_adj:
http://i81.photobucket.com/albums/j237/hausfath/Picture62.png
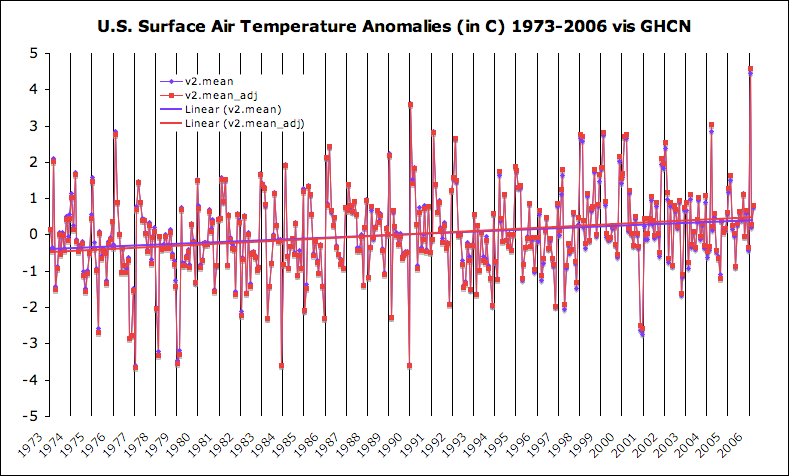
http://i81.photobucket.com/albums/j237/hausfath/Picture63-1.png
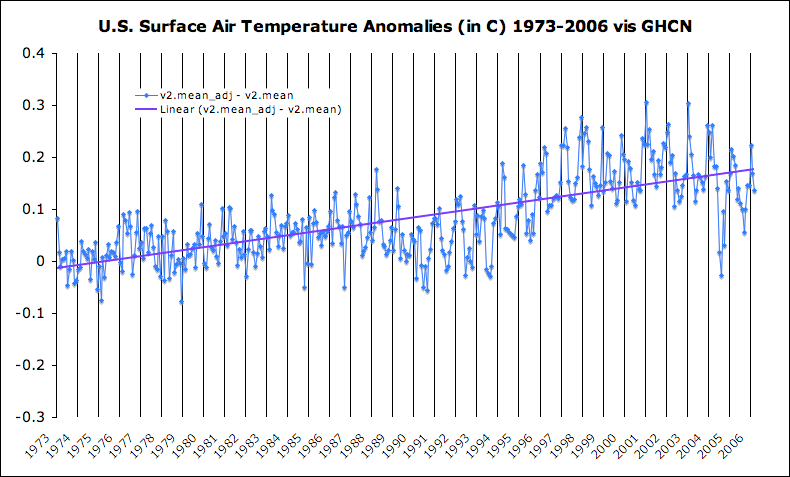
http://i81.photobucket.com/albums/j237/hausfath/Picture65-1.png
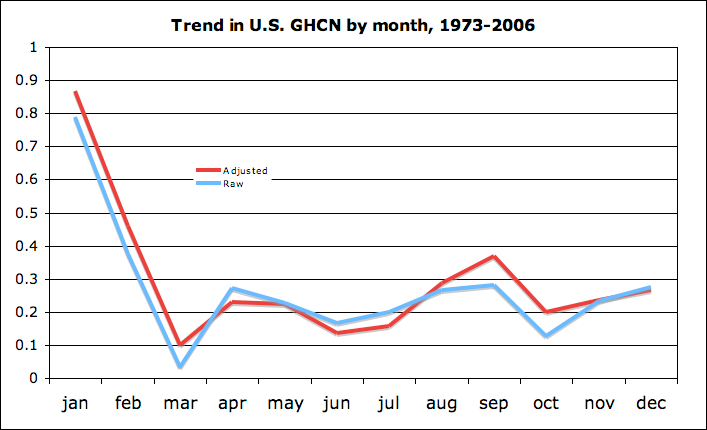
Thanks Zeke. That answers my question. I’ve got the bulk of my F90 program written. Now that I have that information, I can finish it up tomorrow and we’ll see what 49 model runs have to say.
Chad,
Looking forward to seeing what you get. I took the lazy route and just used the data from Frei and Gong to do a first pass: http://i81.photobucket.com/albums/j237/hausfath/SnowCover1967-2010band-1.png
I tried to download gridded data from GISS-E one month at a time, but it got tedious rather fast 😛
Zeke,
HA! Tedious! When I first started doing this research over a year ago, I had no idea how to use netCDF. I used Panoply by Robert Schmunk of NASA to extract one month of gridded data at a time. I very tediously copied it into a spreadsheet. I Imported it into Matlab and did whatever I had to do. My have I come a long way.
Latest from Roy Spencer:
Spurious Warming in the Jones U.S. Temperatures Since 1973
“..The recent paper by McKitrick and Michaels suggests that a substantial UHI influence continues to infect the GISS and CRU temperature datasets.
In fact, the results for the U.S. I have presented above almost seem to suggest that the Jones CRUTem3 dataset has a UHI adjustment that is in the wrong direction. Coincidentally, this is also the conclusion of a recent post on Anthony Watts’ blog, discussing a new paper published by SPPI.
It is increasingly apparent that we do not even know how much the world has warmed in recent decades, let alone the reason(s) why. It seems to me we are back to square one.” http://wattsupwiththat.com/2010/02/27/spencer-spurious-warming-demonstrated-in-cru-surface-data/
MarkR (Comment#35537)
“It is increasingly apparent that we do not even know how much the world has warmed in recent decades, let alone the reason(s) why.”
Yep. Question is, will scientists, professionals, the public who have been brainwashed by it all let it go or not?
Is there some kind of constraint associated with a statement like, “Dropping stations doesn’t make any difference”. It seems to me that the location of the dropped / retained stations, and the time of year for the data dropped / retained coupled make a difference. I can manufacture such conditions. But maybe it’s a case of highly specialized manufacturing.
As for dependence on grid size. The results are not correct until they are independent of grid size; data wise and GCM-model wise.
All corrections to incorrectos appreciated.
http://www.ncdc.noaa.gov/oa/climate/research/ushcn/ is a very interesting read. It includes a discussion of UHI effects:
.
“In the original HCN, the regression-based approach of Karl et al. (1988) was employed to account for urban heat islands. In contrast, no specific urban correction is applied in HCN version 2 because the change-point detection algorithm effectively accounts for any “local” trend at any individual station. In other words, the impact of urbanization and other changes in land use is likely small in HCN version 2.”
.
Which means that they do not make any specific adjustments for UHI. So a station that has had no abrupt siting changes but which sits in an area of gradual growth over 50 years has had no adjustments to account for gradually increasing UHI! This doesn’t seem very rigorous to me. After all, the UHI in a developed area ought to be (more of less) proportional to the extent of development, and lots of small-ish towns/cities have become big-ish towns/cities over the past 50+ years. Can gradual urbanization be properly accounted for by the NCDC method? It doesn’t seem to me like it can.
SteveF (Comment#35553)
Jones of CRU co-wrote a paper alleging there was no Urban Heat Island Effect. I’d like to see a table of all the Temp databases setting out what has actually been done to each one.
At the moment no-one seems to know.
“It is increasingly apparent that we do not even know how much the world has warmed in recent decades, let alone the reason(s) why.â€
@MarkR,
Thats the same feeling I get, but a careful reading of the Apocrypha seems to suggest that
‘It’s not the temperature, it’s the trend’
is the message that one is supposed to embrace.
Zeke:
Here’s my simple mean plot. Still pretty different and I can’t get an anomaly value for 1994 because all of the stations have missing data. I’m not discounting my doing something wrong here. This is the list of stations is used: 71043000, 71733000, 71913000, 71072000, 71815000, 71915000, 71081000, 71816000, 71924000, 71090000, 71818000, 71925000, 71101000, 71826000, 71926000, 71109000, 71828000, 71934000, 71120000, 71836000, 71938000, 71122000, 71844000, 71945000, 71185000, 71867000, 71950000, 71197000, 71894000, 71957000, 71600000, 71906000, 71966000, 71603000, 71907000, 71722000, 71909000
MarkR:
Non quantifiable statements have little probative value.
The question is how much is the uncertainty in the trend increased by? That’s a meaningful comment. This is not, especially given we have other independent temperature records, e.g., RSS and UAH to compare against.
That sets a lower limit on how much downward adjustment can be made on the data.
Chuckles:
The question I have is, if you’re trying to relate climate change to CO2 increase, why would you look at anything other than trend? That’s not a “new message”, it’s just a fact of how you test the science from day one.
“Question is, will scientists, professionals, the public who have been brainwashed by it all let it go or not?”
Will otherwise intelligent bloggers and commenters let it go?
I guess we’ll see. 😉
Andrew
@Carrick,
I was not trying to relate anything to anything, or send out any new messages.
I was just alerting MarkR to something that you kindly explained to me some time ago, (I think at the Air Vent) that in this instance we are focused on the trend, not absolute or normalised temperatures or short term variances therein.
As you have explained far better than I, above.
MarkR:
That’s not what he said.
He said the effect is small on the global average, around 0.03°C/century if my memory serves me.
If you look at 1978-current temperature trends CRUTEMP3VGL (global average of CRU) you have 2.11°C/century and for GISTEMP (land only, no UHI correction) you have around 1.83°C/century.
That’s a difference in trends of 0.18°C/century for land, or 0.054°C/century on the global mean temperature.
HadCRUT (SST+CRU) gives a trend over the same interval around 1.6±0.2°C/century, with the error bar coming from the fluctuations in the measurements only (I.e., it doesn’t include an estimate of systematic uncertainties).
Given the uncertainties, this seems to suggest that Jones was right, that this wasn’t a critical correction to make.
Chuckles:
Fair enough.
I was just making sure MarkR and the others recognized that this isn’t part of some “retrenchment” on the part of the AGW community, like renaming “global warming” to “climate change”.
I also went back and looked at HADCRUT–GISTEMP (global values).
That removes a lot of the serial correlation (making the statistical error bars much tighter for one thing), you get around —0.04±0.05°C/century for the difference between the two series. That is HADCRUT has a lower global temperature trend than GISTEMP.
If I remember right, there are issues with how HADCRUT does SST that tend to underestimate the temperature trend from SST.
If nothing else, this demonstrates the folly of spending too much energy on just the land record, when 70% of the Earth’s surface is ocean.
Carrick (Comment#35567)
February 28th, 2010 at 10:34 am
MarkR:
“It is increasingly apparent that we do not even know how much the world has warmed in recent decades, let alone the reason(s) why.â€
Non quantifiable statements have little probative value.
The question is how much is the uncertainty in the trend increased by?
You can’t do any meaningful anaysis if all your data sets are adulterated.
Carrick (Comment#35571)
February 28th, 2010 at 11:02 am
MarkR:
Jones of CRU co-wrote a paper alleging there was no Urban Heat Island Effect
That’s not what he said.
He said the effect is small on the global average, around 0.03°C/century if my memory serves me.
So how is 0.03 (in your recollection), and zero materially different in this context. Don’t split silly hairs.
MarkR:
There are problems with the data sets, but those errors can be quantified.
This “you can’t know anything unless you know everything perfectly” meme just complete piffle, as is the meme that the data have been deliberately manipulated.
That’s not splitting hairs, MarkR.
It’s how experimental numbers are correctly treated. 0.03 compared to the statistical uncertainty says it’s not a major correction.
Arguing to ignore the range of uncertainty in a value is a lot like writing out to 15 decimal places the central value of a number significant to only two digits.
A 0.03 correction is not important compared to an uncertainty of 0.2.
Re: Carrick (Feb 28 11:41),
I’ve got to agree with Carrick on this. Even without perfect data and even knowing there are factors like TOBS, station changes, UHI, we still know something from the data.
lucia,
“we still know something from the data.”
What would that be?
Andrew
Andrew_KY:
That the planet has been warming dramatically since 1850, and that the warming 1980-current is the most dramatic warming over that period.
If I had to bet quatloos on it, the various errors you fussers fuss about amount to maybe a 10% correction on the overall trend.
Now that MarkR has made a big deal of UHI, has anybody else noticed that Roy Spencer thought that CRU was making a UHI correction?
And didn’t SPPI address USHCN and GISTEMP not CRUTEMP3?
Seems like Spencer is back to square one here. >.<
Carrick,
Lucia and yourself are getting sloppy with the language again. Not scientific.
Neither of you ‘know’ that the ‘world is getting dramatically warmer.’
You ‘believe’ the world is getting warmer. Lucia thinks someone a.k.a. ‘we’, ‘know’ something by looking at a subjective analysis.
You guys seems to be stuck in a rut on this. I know in Lucia’s case, she has been saying meaningless stuff like this for a long time.
Andrew
Lucia. If you have one piece of incorrect data X, what does that tell you about reality Y? Nothing. If you have 98 pieces of correct data referring to 100 items what does that tell you? Not a lot if you don’t know how much data is correct. If the Temperature database contains n pieces of information, and an unknown number of pieces of data are incorrect, what does the data tell you?
Andrew_KY:
Actually I know with absolutely no doubt that it’s getting “dramatically” warmer, and going from a “Little Ice Age” in 1950 to a more optimal temperature where people don’t have to struggle so hard to make do… is dramatic to me.
It may not be a scientific word, but it’s a legitimate use of the word in this case
The fact you are willfully ignorant on this isn’t my problem.
Re: MarkR (Feb 28 12:29),
Please define “incorrect data”. All data contain uncertainties. Absolutely, positivity, freakin’ all. As far as I can tell, the argument over bias and uncertainty in the surface temperature records has nothing to do with anything I would call incorrect data. It has to do with estimating the bias and uncertainty, and also trying to determine whether we can know the direction of a bias in raw data and correct it.
Identifying biases and correcting them is a tricky thing. The mere fact of biases of sufficient magnitude to requiring “correcting” is always somewhat of a problem in any experiment. That said, the biases suggested are not of a magnitude I would call sufficient to decree the data “incorrect”.
MarkR:
This is easily done.
If you can set a bound the error in the 2% of the data, you can calculate a bound its effect on the global mean.
For example, suppose we could say that the bound on the errors in the 2% of the data was less than 100% the global trend in the remaining data. That amounts to a 2% shift in the global trend.
So it tells you a lot actually.
“The fact you are willfully ignorant on this isn’t my problem.”
I disagree that I am willfully ignorant. 😉
“Actually I know with absolutely no doubt that it’s getting “dramatically†warmer”
You ‘believe’ with absolutely no doubt, would be more of a correct characterization. Although I think ‘absolutely’ is a bit of a stretch.
Andrew
Carrick,
HadCRUT and GISS both use HadISST however, GISS uses Reynolds SST from 1981 onward. Might explain some of the difference.
Carrick (Comment#35579) February 28th, 2010 at 12:14 pm
Andrew_KY:
What would that be?
That the planet has been warming dramatically since 1850, and that the warming 1980-current is the most dramatic warming over that period.
If I had to bet quatloos on it, the various errors you fussers fuss about amount to maybe a 10% correction on the overall trend.
Yup! but you have to be specific about what part of the data.
The land is as people keep forgeting roughly 30% of the overall trend.
Per GISS;
from a roughly zero baseline at 1980, we have a rise of .55C
to 2010.
Land alone is roughly .65C Ocean roughly .5C
Turning to MM04, MM07, they estimate a UHI of .1C per decade
since 1980. so .3C UHI contamination. from 80 to 2010
If the land is WRONG by 50% and is roughly .35C since 1980, then
you got the global average dropping to .45C or roughly 20%.
If the land is wrong by 20% ( if I had to guess worst case ) then the global moves down to roughly .5C or 10%
Assuming of course the ocean is right from 1980 on.
So just to remind folks. The temperature record is worth auditing. It is worth doing right. It is worth being open.
When that is all said and done, the warming since 1850 WONT
DISAPPEAR. RTE’s will still be valid. GHGs will still warm the planet. The final number will likely be different from .55C
( thereabouts, eyeballing the chart) The most you can hope for
is a 20% reduction based on Mckittricks work, and much more likely something like 10% as Carrick suggests.
If you expect that the maximum signal you are looking for
is a UHI signal in the range of .1C to .15C from 1980 to present
Then you better be on your statistical toes to find it and verify it.
If the signal were HIGHER than this it would be relatively easy to find.
MAth in head, so subject to rounding errors and too little coffee confusion.
Bottomline: Don’t overplay your hand. There aint no fraud.
Nobody calculated the right number and then said ” a crap” we have to change that. At best you have a sloppy process that doesnt look at certain things ( like microsite etc) with a critical eye. Dont expect a lot. If you do, you’ll likely be wrong and discredited.
Off topic, Judith Curry responded yesterday on the 24 Feb thread devoted to her recent essay. Link to her comment.
“There aint no fraud.”
Steven Mosher,
fraud
   
–noun
1. deceit, trickery, sharp practice, or breach of confidence, perpetrated for profit or to gain some unfair or dishonest advantage.
Yes, there is fraud. The textbook definition of it.
Andrew
Carrick (Comment#35571) February 28th, 2010 at 11:02 am
MarkR:
Jones of CRU co-wrote a paper alleging there was no Urban Heat Island Effect
That’s not what he said.
He said the effect is small on the global average, around 0.03°C/century if my memory serves me.
**************************
Brohan 06 is not an example of clarity on this matter.
Jones cites his own work which puts the century trend
ince 1900 at .055C. Cites another study that puts it at .3C.
Cites perterson which puts it at 0 for the US, cites parker who puts it at zero ( wacky work parker) Then complains about metadata.. PUNTS and puts UHI in the error bars.. REALLY WACKY
HERE IS JONES…
to 0.05â—¦ C in 1990 (linearly extrapolated af-
ter 1990) [Jones et al., 1990]. Since then, re-
search has been published suggesting both that
the urbanisation effect is too small to de-
tect [Parker, 2004, Peterson, 2004], and that
the effect is as large as
≈ 0.3◦ C /century
[Kalnay & Cai, 2003, Zhou et al., 2004].
he cites jones 1990 which puts the figure at .05C
( area china, australia, siberia)
he cites a .3C figure and then parker peterson
who say its too small to detect.
JONES:
The studies ï¬nding a large urbanisation
effect [Kalnay & Cai, 2003, Zhou et al., 2004]
are based on comparison of observations with
reanalyses, and assume that any difference is
entirely due to biases in the observations. A
comparison of HadCRUT data with the ERA-
40 reanalysis [Simmons et al., 2004] demon-
strated that there were sizable biases in the
reanalysis, so this assumption cannot be made,
and the most reliable way to investigate possi-
ble urbanisation biases is to compare rural and
urban station series.
*******************************
this literature may bear some re examination.
JONES:
A recent study of rural/urban station
comparisons [Peterson & Owen, 2005] sup-
ported the previously used recommendation
[Jones et al., 1990], and also demonstrated
that assessments of urbanisation were very
dependent on the choice of meta-data used
to make the rural/urban classiï¬cation.
*************************
peterson and Owen ( owen on board means
using nightlights probably) AGREE with Jones
1990… .05C
BUt note that the REAL ISSUE is metadata. the
best approach ( comparing urban to rural) requires
good metadata ( this is why I like the surface stations
project.. not the wild claims but the attention to metadata)
JONES:
“To
make an urbanisation assessment for all the
stations used in the HadCRUT dataset would
require suitable meta-data for each station
for the whole period since 1850. No such
complete meta-data are available, so in this
analysis the same value for urbanisation
uncertainty is used as in the previous analysis ”
***********************
That is a huge leap in logic. we dont have complete metadata
SO rather than compute the average from those stations
that do, rather than develop meta data, we use the same answer
as last time. Note this is not an error on his part, but I point out
the funny leap of logic/ justification
JONES:
“[Folland et al., 2001]; that is, a 1σ value of
0.0055â—¦ C /decade, starting in 1900. Recent
research suggests that this value is reasonable,
or possibly a little conservative [Parker, 2004,
Peterson, 2004, Peterson & Owen, 2005]. The
same value is used over the whole land surface,
and it is one-sided: recent temperatures may
be too high due to urbanisation, but they will
not be too low. ”
the figure is not SUBTRACTED from the data, it is added
to the lower side of the 1sd CI. you can plainly see this in
the graphs.
lucia (Comment#35584)
February 28th, 2010 at 12:37 pm
Re: MarkR (Feb 28 12:29),
If you have one piece of incorrect data X, what does that tell you about reality Y?
Please define “incorrect dataâ€.
Lucia. “incorrect data†is defined as data that does not reflect reality. In the example above say X=378 and Y=934. The data 378 would tell you absolutely nothing about the reality 934. Sure sometimes one can estimate bias, but only if an educated guess can be made about the amount of bias, that is, a statistical sample can be made to quantify the bias. Uncertainty is something else, and has to do with sampling theory, and has been quantified.
What we have with the Temp datasets is incorrect data which may be unquantified bias, but no-one has done the work to quantify it. Willis Eschenbach sets the example by comparing raw data and the adulterated versions for individual weather stations and estimating a correction. Obviously a larger sample would need to be taken to see if there was a pattern of bias, or if the adulteration of the data is random. Ideally a correct algorythm should be designed, and the raw data readjusted in a proper way. I wish some of the programming wizzes would do that. Alternatively, take the hundred best weather stations and work with their data. That should be a big enough sample.
MarkR
Based on your example, the thermometer data cannot be deemed “incorrect”. You have claimed it’s incorrect, but failed to demonstrate this.
MarkR:
That’s a not a very useful definition.
The measurements are of temperature, so they are “correct” by your definition. They have errors in them, we know the true value can’t be -273.15°K and we are pretty sure it’s lower than +5000°C.
Even if the numbers are fraudulent you can bracket them with the range of values of the other 98% of the data at that same latitude. If you do that, again you find that you have shifted the median of the data by maybe 2-3%, though can get this to 10% if all of the errors are in the north Arctic.
10% is a substantial error compared to measurement uncertainty, but we are still left with statistically significant warming since 1980.
There simply isn’t enough wiggle-room here to shift the trend from e.g., 1.6°C/century 1980-current to 0°C/century. If you agree to that, then you can’t argue “we don’t know anything.”
Stephen Mosher:
The error is a bit higher that I remembered, I suspect the “real” error is not so large.
It’s very conservative to assume the UHI correction to temperature trend is to only increase it. As I’ve pointed out before UHI is a real effect: There are heat sources in urban environments, and they do tend to warm the Earth.
The main sources of bias in the global temperature trend comes from oversampling urban environments and from micro-site issues.
If you move the sensor from a bad site to an improved one (e.g., from a nearby heat source to a grassy park), you’ll end up with a net negative “UHI” correction.
So micro-site corrections don’t always have to boost the observed temperature trend, and even an accurate global mean temperature will have a real UHI effect in them.
Andrew_KY (Comment#35591) February 28th, 2010 at 12:55 pm
I’m not impressed by dictionary definitions. Itry to be precise about what I mean by fraud. I’m not talking about a common dictionary definition which is likely to contain imprecise meanings.
But let’s look at yours because it will show you the difference
I am looking at.:
1. deceit, trickery, sharp practice, or breach of confidence, perpetrated for profit or to gain some unfair or dishonest advantage.
Let’s just take it one item
A. Deceit: for there to be deceit the fraudster has to know
that the true answer is different than he presents. Jones
and others believe that they are calculating the numbers
correctly. They do not believe that there is a better method
than they use which wil give the RIGHT answer. They make
some assumptions. The assumptions have prima facia validity.
NOTE: I am talking SPECIFICALLY about the temperature record.
Now look at the other examples: trickery, sharp practice, loss
of confidence.
What I have argued is that these words are far better decriptions. , in particular a loss of confidence. let’s look at that. People can lose
confidence for a variety of reasons. Finding out that someone wont share data, loses data, etc etc, can lead to a loss of confidence. Not every loss of confidence requires a deceit.
that is a willful presentation of things you know to be wrong
Simply: fraud is an imprecise word. I would rather describe exactly what jones did and didnt do in precise terms
and avoid the highly charged term “fraud”
WRT temp record: sharp practice? yes, ignoring the issues with China data. Trickery? maybe with “hide the decline” but THATS
NOT the subject here. loss of confidence? yup. deceit? Not clear in my book. This is why I focus on the terms I do. I can demonstrate the loss of confidence and sharp practice.
I know this won’t make you happy. I want to be more precise in my claims about jones than he is in his claims about temps.
Steven Mosher,
“I know this won’t make you happy.”
You are right. It makes me sad.
“I’m not impressed by dictionary definitions.”
This demonstrates (in the very first sentence) why AGW’ers, even the lukewarmers, cannot be trusted.
The dictionary is the thing we are all supposed to agree on. It’s what words mean to real people. You claim you are trying to find common ground and you pull the rug out from under it. The mindset that disagrees with common meanings of words (on which our laws are meant to be based) is a divisive one. Contorting to avoid the word ‘fraud’, calls into question what you are actually trying to accomplish here. If you really want to clean up science (which now I doubt) you have to get rid of the dirt. You are just making muddy water, which is not very helpful.
Andrew
Andrew_KY:
You are a complete nut.
“As Charlie Martin of Pajamas Media reports, Inhofe is asking the Department of Justice to look into possible research misconduct or even outright criminal actions by scientists involved in questionable research and data manipulation. These include Michael Mann of Pennsylvania State University and James Hansen, head of NASA’s Goddard Institute for Space Studies.
Inhofe’s report suggests that the products of such scientific misconduct, used by the EPA and Congress to support draconian legislation and regulations, may violate the Shelby Amendment requiring open access to federally funded research, as well as the Office of Science and Technology Policy rules on scientific misconduct.
The report notes potential violations of the Federal False Statements and False Claims acts, which involve both civil and criminal penalties. Charges of obstructing Congress in its official proceedings are possible as well.” http://www.investors.com/NewsAndAnalysis/Article.aspx?id=522120
a meaningful discussion with denialists like Andrew and Mark is impossible.
.
both simply lack the most basic understanding of the topic and any will to accept any fact that contradicts their believes..
.
ps: Inhofe says it, so it must be right. Mark were you trying to make my point for me? confirmation of your complete lack of understanding received!
Lucia: “the thermometer data cannot be deemed “incorrectâ€.” The trouble is, you don’t know whether the data reflects the actual thermometer reading or some “adjusted” version. The data pool is corrupted in an undefined way unmeasured way.
Nick Stokes writes: “The problem with FILNET is that it basically stirs all stations together to a degree.â€. Maybe so, but that’s not a problem for GISS – they don’t use that data.”
Again, you have not contradicted anything I’ve said–which was in the first a criticism of OpenTemp not of GISS.
Nonetheless, perhaps your attitude is backward here? GISS stirs the the temperature series in its own ways. On top of which perhaps you’re being just much too much dismissive here and reaching to special pleading. For instance the SHAP corrections also stir together station data in a way that makes it difficult to meaningfully shatter rural and urban data.
Using the words fraud or hoax to describe what is at worst group think is not particularly helpful. Those words are the rhetorical equivalent of denier or ‘flat earther’ and simply polarize the debate.
Okay, I’ve adapted my model to work with either GHCN or USHCN data.
However, I can’t seem to find any sort of urbanity designation in the USHCN metadata, not even the population density of the location!
ftp://ftp.ncdc.noaa.gov/pub/data/ushcn/v2/monthly/
Anyone have any leads?
Anyhow, off to compare USHCN raw, USHCN v2 adjusted, GHCN raw, GHCN adjusted, and GISS estimates of U.S. temps 😛
Sod,
Other people before Imhoff may have filed claims against
Mann under the legislation he notes. I was aware of this pathway
quite a while ago and decided it was not a good idea.
basically, if you apply for federal funds to perform a study you have to make certain representations to the government. If you dont want federal money DONT APPLY. if you do apply you are
subject to the law. If you misrepresent things in your proposal there are CONSEQUENCES. I worked in defense. Mishandling a Classified document was a crime. Mislabelling a document was a crime. Carrying a paper copy of your safe combination was a violation. firing offense maybe a crime. Losing a document, a crime. Filling out your time card wrong? crime.
Don’t like that? don’t work in that environment.
Ps. I think it’s a mistake to persue this line with mann. it’s legal to look at it, but it’s a huge mistake.
Thanks raven.
Zeke Hausfather (Comment#35615) February 28th, 2010 at 2:25 pm
Urbanity in ushcn.
Start here:
ftp://ftp.ncdc.noaa.gov/pub/data/ushcn/
ftp://ftp.ncdc.noaa.gov/pub/data/ushcn/README.TXT
ftp://ftp.ncdc.noaa.gov/pub/data/ushcn/readme_gridpop.txt
It will be in station inventories.
urban classification is the crux of the matter.
From GISS they use this file:
For US: USHCN – ftp://ftp.ncdc.noaa.gov/pub/data/ushcn/v2/monthly
9641C_200907_F52.avg.gz
ushcn-v2-stations.txt
You will have to parse the .txt file.
there are many approaches used to classify urban/rural.
Population, nightlights.
Doing something with data from Columbia as Ron has done
is interesting. ISA is even more interesting.
A suggestion: make one of your outputs the list of stations
that you classified as Rural/urban.
Thanks Mosh, I discovered the relevant file:
ftp://ftp.ncdc.noaa.gov/pub/data/ushcn/station.landuse.Z
STATION AREA LAND USE/LAND COVER FILE
NOAA’s National Climatic Data Center (NCDC) implemented a Global
Baseline Data Project in 1990. The purpose of the international
project was to gather long-term Climatological data for research in
global climate change.
Some 1300 1st order stations, airports (city/rural), cooperative
weather observation stations and all stations of the United States
Historical Climatological Network (HCN) a special group of stations
with long-term records of climate data, were included.
Each station was requested to enter a code 0-9 (codes listed below)
which best describe todays predominant land use within a circle
around their station at each radius (100 meters, 1 kilometer, 10
kilometers). More than one code may be used if necessary to
describe several predominant characteristics within each circle.
The importance here was to code the predominant land use, not all
land use.
The project, coordinated by NCDC’s Lewis France, Anne Lazar, Elaine
Mason, Alvin McGahee and Ken Weathers, is now available on diskette
and will soon be included as part of an On-Line Relational station
history data base at NCDC.
Codes:
O UNKNOWN
1 NON-VEGETATED (barren, desert)
2 COASTAL OR ISLAND
3 FOREST
4 OPEN FARMLAND, GRASSLAND OR TUNDRA
5 SMALL TOWN, LESS THAN 1000 POPULATION
6 TOWN 1000 TO 10,000 POPULATION
7 CITY AREA WITH BUILDINGS LESS THAN 10 METERS*
8 CITY AREA WITH BUILDINGS GREATER THAN 10 METERS*
9 AIRPORT
*30 feet or 3 stories tall
.
.
Here is the problem, however: these categories are not mutually exclusive nor cumulative across distance. E.g. at 100 meters it might be 1/5, at 1km it would be 3/4/6, and at 10 km 3/4/5/6/7
Now, which permutation of those possible factors at which difference do we collapse together into a single “urban” or “rural” designation?
I guess the most strict check would be to look at them all, and only classify stations with no small towns or any larger grouping within 10 km…
Oh, and for those interested, here are the raw vs. adjusted data for the U.S. for all the different series:
http://i81.photobucket.com/albums/j237/hausfath/Picture68.png
And comparing USHCN adjusted to GISS:
http://i81.photobucket.com/albums/j237/hausfath/Picture69-2.png
Zeke – in addition to Steven Moshers suggestions see if you can get a copy of the sites classified as good (ie 1 and 2) by Anthony Watts as used by John V for Open Temp. The file of good stations used by Menne would be an alternative if it is available.
Andrew KY.
When I am accusing jones of wrong doing I owe it to him to be precise. more precise than your dictionary which merely catalogues some peoples description of the varities of common or standard usage. If you want to use the word fraud what EXACTLY do you mean?
1. deceit? prove it.
2. sharp practice? prove it.
3. loss of confidence? prove it.
I have tried to stick to the facts. Sloppiness? yes jones confirms that? sharp practice? i think so. Loss of confidence? yes.
I can’t prove deceit. In my book to deceive me you have to believe the answer you are giving me is false. false on purpose.
being sloppy, being imprecise, making assumptions that serve your purpose is shady. obstructionist? yes.
clivere (Comment#35623) February 28th, 2010 at 3:18 pm
That dataset was way too small.
But if Zeke is up for it he could post up a classification of all USHCN stations. Anybody who wants can look at the 1200 ushcn stations and look at the photos and do there own assessment.
Zeke Hausfather (Comment#35620) February 28th, 2010 at 3:12 pm
there are other fields as well.
A cool thing to do would be to pull the lat lon and then
google map it.
the metadata needs a big audit.
Check out Ron’s work. He used gridded pop from columbia.
MAybe he can output a list of that data.
For a superfine screen you want:
1. Nightlights = Dark
2. Population <5K
3. Airport = False
4. Coast = False.
That should give you a pretty good chance of picking stations that have a high probablity of being "rural" for a finer screen you would have to look at the CRN12 sites.. that data aint public yet
but people can go look at the photos and tae the sites themselves.
Zeke Hausfather (Comment#35620) February 28th, 2010 at 3:12 pm
Check the station file referenced at GISS. it contains many feilds
including population, land use, nightlights, brightness index..
hey, its been two years and I lost the data in a move.
Steven – it would help to confirm that Zeke gets similar results. Given he has already done the hard work it should be relatively straight forward and he will probably want to do a run with Anthony’s full dataset when Anthony makes it available!
Zeke – will you please list the actual dataset names/source locations you have used for this latest output.
The output is helpful so thanks for running it.
Does the USHCN V2 in your run include the NOAA estimated values from their homogenisation?
Can you run your comparison of long lived vs short lived stations using USHCN?
Okay, I redid Menne’s analysis with an added twist; I compared the gridded resulting temperature to the temperature record for all stations contained in those grids (since the 71 CRN12 stations in Menne don’t cover all the grids in the U.S.).
Here is CRN12 raw vs all stations in grid raw. Like Menne, I find that “good” CRN12 stations are -warmer- than the average station (I’ll compare them to CRN345 later):
http://i81.photobucket.com/albums/j237/hausfath/Picture70.png
We can take the annual difference between CRN12 stations and all stations in grid to show this more clearly:
http://i81.photobucket.com/albums/j237/hausfath/Picture71.png
.
Mosh, criticizing Menne for the sample size is fine (though I’d argue its representative enough). However, since Menne used 71 stations in 32 5×5 grids while Long used 48 stations in 27 5×5 grids, I’d say that argument also undermines his analysis 😛
.
The raw data files used in all my graphs are:
GHCN raw: ftp://ftp.ncdc.noaa.gov/pub/data/ghcn/v2/v2.mean.Z
GHCN adjusted: ftp://ftp.ncdc.noaa.gov/pub/data/ghcn/v2/v2.mean_adj.Z
USHCN raw: ftp://ftp.ncdc.noaa.gov/pub/data/ushcn/v2/monthly/9641C_201002_raw.avg.gz
USHCN v2 adjusted: ftp://ftp.ncdc.noaa.gov/pub/data/ushcn/v2/monthly/9641C_201002_F52.avg.gz
GISS: http://data.giss.nasa.gov/gistemp/
And CRN12 vs. CRN345:
http://i81.photobucket.com/albums/j237/hausfath/Picture73.png
This thread is loading slowly. Please continue the discussion on the new thread