Over at WUWT, Willis takes issue with some of the numbers Dr. Muller presented in his congressional testimony. Specifically, Willis argues that the 1900-present land temperature rise of around 1.2 C claimed by Muller is higher than that actually present in any of the three major land temperature records (NCDC, Hadley/CRUTEM3, GISTemp). There are fundamental underlying issues in comparing these three series, as both Hadley and GISTemp use zonal weightings (0.68 × NH + 0.32 × SH for CRUTEM3, the average of the anomalies for the zones 90°N to 23.6°N, 23.6°N to 23.6°S and 23.6°S to 90°S with weightings 0.3, 0.4 and 0.3, respectively, for GISTemp) while NCDC uses simple spatial gridding combined with a land mask. Still, even comparing the relatively straightforward NCDC land record to the numbers mentioned in Dr. Muller’s testimony, we see some oddities.
These odd numbers appear to have been due to eyeballing the data rather than calculating trends per se, as the data shown the chart in Muller’s testimony seems to be largely correct.

Compare the chart above, taken from Muller’s congressional testimony, to the one below showing annual temperatures from NCDC, CRUTEM3, and GISTemp:

They appear to be functionally identical, though my version uses annual values rather than smoothed monthly values. One can easily see how, when simply eyeballing the chart, you could conclude that the temperature rise has been 1.2 C over the period. However, this somewhat overestimates the actual trends.
For the periods in question, we find the following amount of warming in the land records (using the coefficient of the OLS linear regression multiplied by the time period):
Similarly, Muller’s 0.7 C warming since 1957 seems a tad low, and is inconsistent with the data in the chart shown in his testimony.
So what does this mean at the end of the day? Well, one should try to be more rigorous when preparing congressional testimony and not simply eyeball graphs to try and extract trends. That said, it doesn’t really have any bearing on the actual BEST results presented.
I’ll refrain from commenting much on the BEST analysis of station siting/CRN rating for the moment, as I don’t really have any information apart from the statement that the BEST results show “our preliminary analysis the good stations report more warming in the U.S. than the poor stations by 0.009 ± 0.009 degrees per decade, opposite to what might be expected, but also consistent with zero.†I do suspect that the relative warming of good stations relative to poor stations is due at least in part to the cooling bias introduced by MMTS transitions, which Menne et al 2010 identified as more likely to occur in poorly sited stations than well sited stations. I sent over some data on sensor type and transition dates to the BEST folks, and hopefully they can factor it into their analysis.
As a parting note, here are the various blogger reconstructions compared to NCDC:

(click to embiggen)
Update:
Some folks have suggested that the 1.2 C number might refer to something different than the data in the chart shown in his testimony, e.g. GHCN data ran through BEST’s spatial interpolation process, which would be the closest analogue to what existing records would show if spatial covered is treated the same way. This would explain the discrepancy, though its still slightly odd to show a chart with the regular CRUTEM3/NCDC/GISS data that show slightly less warming.
Zeke, you neglected to mention:
Our upcoming paper, Fall et al 2011 titled “Analysis of the impacts of station exposure on the U.S. Historical Climatology Network temperatures and temperature trends†has this abstract:
The recently concluded Surface Stations Project surveyed 82.5% of the U.S. Historical Climatology Network (USHCN) stations and provided a classification based on exposure conditions of each surveyed station, using a rating system employed by the National Oceanic and Atmospheric Administration (NOAA) to develop the U.S. Climate Reference Network (USCRN). The unique opportunity offered by this completed survey permits an examination of the relationship between USHCN station siting characteristics and temperature trends at national and regional scales and on differences between USHCN temperatures and North American Regional Reanalysis (NARR) temperatures. This initial study examines temperature differences among different levels of siting quality without controlling for other factors such as instrument type.
Temperature trend estimates vary according to site classification, with poor siting leading to an overestimate of minimum temperature trends and an underestimate of maximum temperature trends, resulting in particular in a substantial difference in estimates of the diurnal temperature range trends. The opposite-signed differences of maximum and minimum temperature trends are similar in magnitude, so that the overall mean temperature trends are nearly identical across site classifications. Homogeneity adjustments tend to reduce trend differences, but statistically significant differences remain for all but average temperature trends. Comparison of observed temperatures with NARR shows that the most poorly-sited stations are warmer compared to NARR than are other stations, and a major portion of this bias is associated with the siting classification rather than the geographical distribution of stations. According to the best-sited stations, the diurnal temperature range in the lower 48 states has no century-scale trend.
Anthony,
Thanks for the abstract; I wasn’t aware that it was available yet. By “according to the best-sited stations, the diurnal temperature range in the lower 48 states has no century-scale trend” do you mean that the confidence intervals of the 1895-2010 trend in daily mean anomalies for CRN1 stations overlaps with 0? I’m not sure what you mean by “diurnal temperature range” in this context.
Anthony/Zeke–
The word diurnal range is more-or-less the difference between maximum and minimum temperatures,right? If so, then what we learn is days and nights both warmed up the same amount.
If Lucia’s interpretation is correct, that seems reasonably consistent with the limited data available that Menne used:
http://i81.photobucket.com/albums/j237/hausfath/Screenshot2011-03-31at41154PM.png
Are diurnal ranges supposed to change? (My impression was yes– nights were supposed to warm more than days, right? In a way somewhat similar to poles warming more than the tropics, right? I’m asking because this isn’t a detail I’ve paid much attention to.)
Anthony,
Looks like your abstract was available in your letter to congress. I apologize for missing it; thats what I get for trying to skim the post quickly.
AGW says diurnal range should narrow, as I recall
If those stations used in the Menne linked graph are the CRN12 Watt’s classified stations at the time of the Menne paper being published, I would say the the numbers will be woefully small to make reasonable comparisons given the variations that occur from station to station.
There must be analyses with more data points than this one – if I understand what is being graphed.
http://pds.lib.harvard.edu/pds/view/7788063?n=25&imagesize=2400&jp2Res=0.5&printThumbnails=no
review comments 10-127
“…Almost everywhere, daily minimum temperatures increase faster than daily maximum temperatures, therefore diurnal temperature ranges decrease..†…..Accepted
Kenneth,
I’m somewhat unconvinced that a semi-random sample of 50% of the stations will have results that different than 87%, given how oversampled USHCN is (QA issues notwithstanding). But I agree its possible that the results could change, and I look forward to playing around with the rankings once Anthony publishes. Some analysis, looking at only MMTS stations for example, will be a lot easier to do with more ranking data.
Ed Forbes,
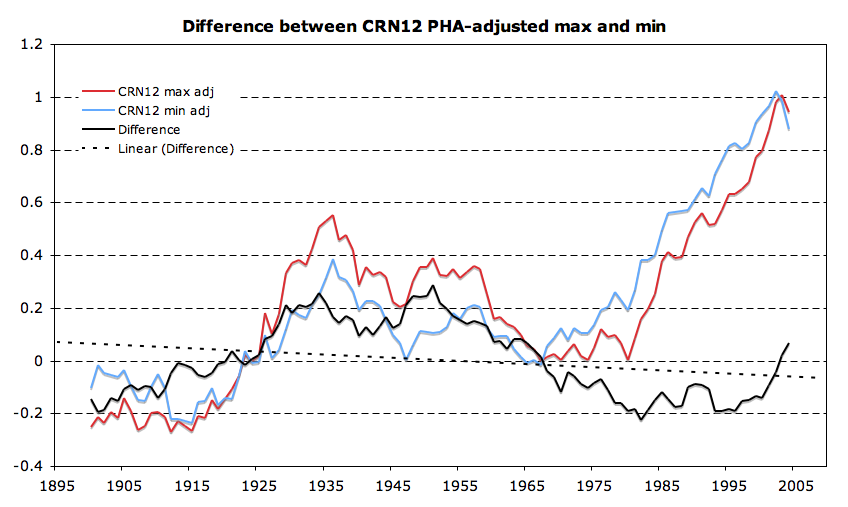
In the U.S. at least, min warming is much greater than max in the raw data but not much different in the homogenized data:
http://rankexploits.com/musings/wp-content/uploads/2010/03/Picture-1372.png

Most of the post-1980 deviation between min and max is almost certainly due to the switch to MMTS sensors, and their associated max cooling bias: http://rankexploits.com/musings/2010/a-cooling-bias-due-to-mmts/
[edit] a far bit of the difference is also due to TOB changes, though the MMTS switch still dominates post-1980.
Zeke
My comment was only to confirm that per the review, diurnal temperature ranges were to decrease.
Personally, I think this is the first that this prediction has came to my attention.
If said ranges were not to decrease, that says something also.
Where is the evidence that AGW warming started in 1957?
I have never heard that before. If someone has evidence of that being stated, I’d like to see it.
1970 maybe, given that GHG forcing finally overcame that other negative forcings (mostly aerosols) around that time if one believes the estimated aerosols forcings.
Secondly, I hate these annual averages. So much varibility and changes in the real climate are lost using these annual averages.
Crutem3 (Land) temperatures since 1880. Land temperatures were significantly lower in 1975 versus 1944 or 1932.
http://img863.imageshack.us/img863/424/hadcrut3crutem3componen.png

Ed Forbes
Yes. That said: if the total warming is 1.0C, and the expectation was that for this level of increase, lows would increase by 1.1C while highs would increase 0.9C, then you might not really see the 0.2 C difference in the data even if you could dig the 1C out of the noise.
Still, it is worth knowing whether a change in the diurnal range was or was not detectable and it’s interesting to learn that none can be detected.
Bill,
Muller is referring to the broad IPCC consensus statement of “most warming of the last 50 years.” i.e. 2007 – 50 = 1957.
AGW now as of 1957 ??
Temperature increases of 1.2C ??
Could someone “out there” please provide some verifiable evidence for these rather novel assertions?
Anyone? And verifiable, please.
Whatever happened to “no statistically relevant warming since 1998” and Lucia’s ongoing tracking of the 0.2/decade increase, that does not appear to be happening?
Is BEST yet another boondoggle, another example of “climate science”? Presenting “preliminary findings” at a congressional hearing with an oblique reference to research in progress/publication that Muller and Co know does not necessarily support those “preliminary findings”? We’ve seen that sort of well timed disinformation before, haven’t we? Like the release of Steig’s Antarctica paper a few days before Gore giving congressional testimony, so Gore could tell Congress that there was now proof too that the last hold-out was warming as well?
So, just maybe BEST has credibility issues already.
We already knew about the range closing on MMTS sensors from Quayle. Since they are by far the majority of sensors, there is no doubt there will be a change in the range. The cute little trick by Watts et al here is they did not break down their study by sensor type, just like Quayle et al did not try to determine why the range closed or why there was a need for an MMTS adjustment. Not to mention, Watts et al seems to avoid the issue of the lack of difference in trends when comparing different CRN groups to the whole… gotta keep the BS runnin.
tetris, Please read… it is not global temps but land temps which increased by that much… ocean, which Lucia includes in her analysis, has warmed at a much slower pace.
MikeC
Yes. I can read.
I also know from professional experience how “messages” are communicated. Do you think that based on past performance the MSM will make the distinction between “land temperatures” and “global temperatures” when they read the press release? In particular when the very same testimony explicitly absolves GISS, NOAA, CRU, etc., etc. from any of the pretty serious criticism that has come their way over the years and actually states that their data are the absolute “bees knees”?
Whitewash?
And do you have a verifiable explanation for the 1957 date?
The lack of narrowing in the diurnal range is interesting. Note that the AVERAGE temp is not effected.
Narrowing of diurnal range?
I’ll suspect that the models that show this may have boundary layer simulation problems..
Re: tetris (Mar 31 22:02),
it amuses me the way people believe that the temperature record has to be wrong. Like I’ve said , the biggest issue is the uncertainty. There isnt any significant bias in the record, not anything that would change our understanding of sensitivity. Maybe .1C or .15C at best.
1. When did 3% of the world’s surface (US) become global?
2. Giving a site a rating is fine, but when we’re dealing with century-long records, what was the site rating of Wattsville in 1880? In 1900? In 1956? In 1986? In what year did it change from a 2 to a 3? Or from a 3 to a 4? If you don’t know that, you don’t have enough data to do meaningful analysis based on site rating over a century timescale.
3. Decreasing DTR has been noted in North American records pre-1980, pre-MMTS. See T. R. Karl, G. Kukla, J. Gavin, J. Clim. Appl. Meteorol. 23, 1489 (1984). This is confirmed by the graph posted by Zeke in comment #72473. It’s interesting to note from that graph that (a) the decline in DTR has reversed since the switch to MMTS; and (b) the 1900-1935 increase in DTR was accompanied by a global temperature increase generally attributed to increasing solar irradiance during that period. Since increasing solar irradiance is expected to increase DTR, this is not surprising. Therefore, by going back a full century, Fall et. al. are (deliberately?) weakening the AGW signal by averaging it in with NGW anti-signal. Cute trick: hide the decline, indeed.
Anthony:
It’s complete poppycock to suggest, as you appear to be trying, that there has been no century wide trend either in the lower 48 states, or in the world data, or that this trend is artificial.
You have your head stuck pretty far in the sand if you really believe such farcical nonsense.
OTH, Zeke why are you using CRUTEMP rather than HADCRUT?
Is there something I missed? I thought Muller was referring to global, rather than regional temperatures. In fact he seems to single out HADCRUT. Comparison with the other series in that context is not meaningful in vetting that claim.
Here are my OLS temperature changes for HADCRUT3VGL:
1880-now 0.75°C (130 years x 0.058°C/year)
1900-now 0.73°C (110 years x 0.067°C/year)
1957-now 0.64°C (53 years x 0.012°C/year)
1980-now 0.65°C (40 years x 0.016°C/year)
I also think (and these data suggest) that the IPCC is doing a little underhanded game by using 1957. Their models and data suggest the warming started in circa 1975, 1957-1975 is pretty much flat, or slightly dropping temperatures. Folding that in artificially inflates the period for the warming:
Image.
Edit: What Bill said.
Re: Carrick (Apr 1 01:44),
“OTH, Zeke why are you using CRUTEMP rather than HADCRUT?”
This arises from the rather confusing idea of Muller (read his testimony) that the land temperature rise is what we call global warming. Of course most of us would say that global warming should be land+ocean.
Also you might need to rethink your rude remark to Anthony, after carefully reading what he said.
Re: KAP (Apr 1 00:52), My assumption was that increased TSI would give you both an increased Tave and an increased DTR.
And I assumed that AGW would give you a increased Tave and a decreased DTR
conceptually at least.
probably need to do more reading. Thanks for the cites you provided
So BEST comes up with the same narrative that the rest have produced. Much sound and fury signifying nothing, as far as they are concerned.
And this is why Anthony is so put out.
“We have also studied station quality. Many US stations have low quality rankings according to a study led by Anthony Watts. However, we find that the warming seen in the “poor†stations is virtually indistinguishable from that seen in the “good†stations.”
BEST has also come up with the same answer that others already have in regards to the good vs poor stations. WUWT, for all it’s bluster, has nothing to offer. Muller, and several others, have already told Anthony that, too. I think it’s time he packed up his mutual admiration society and went home.
MikeC (Comment#72494) March 31st, 2011 at 10:15 pm
quote
tetris, Please read… it is not global temps but land temps which increased by that much… ocean, which Lucia includes in her analysis, has warmed at a much slower pace.
unquote
What do you make of:
A 2008 study – “Oceanic Influences on Recent Continental Warmingâ€, by Compo, G.P., and P.D. Sardeshmukh, (Climate Diagnostics Center, Cooperative Institute for Research in Environmental Sciences, University of Colorado, and Physical Sciences Division, Earth System Research Laboratory, National Oceanic and Atmospheric Administration), Climate Dynamics, 2008)
[http://www.cdc.noaa.gov/people/gilbert.p.compo/CompoSardeshmukh2007a.pdf] states: “Evidence is presented that the recent worldwide land warming has occurred largely in response to a worldwide warming of the oceans rather than as a direct response to increasing greenhouse gases (GHGs) over land. Atmospheric model simulations of the last half-century with prescribed observed ocean temperature changes, but without prescribed GHG changes, account for most of the land warming. … Several recent studies suggest that the observed SST variability may be misrepresented in the coupled models used in preparing the IPCC’s Fourth Assessment Report, with substantial errors on interannual and decadal scales. There is a hint of an underestimation of simulated decadal SST variability even in the published IPCC Report.â€
JF
Wasn’t Tetris the one who was really talking up Muller a few weeks ago?
Re: steven mosher (Apr 1 00:38), Probably those models that use hyperviscosity to keep from having negative mass and energy in their cells.
Re: bugs (Apr 1 03:50), Bugs, what Anthony is doing is real science and it was acknowledged by the BEST team. And even though I believe as Mosher does that it is about .1C difference at the most, all could be wrong. In a sense all are wrong. Because the work with the surface stations has not been completed and published. Your quipping is premature. Does not mean that you are incorrect that it will make little difference, it does mean you should forgo the snark until after the work is complete. Or as has been pointed out by the Team, do your own. At least Anthony is doing something and it is real.
“I’m somewhat unconvinced that a semi-random sample of 50% of the stations will have results that different than 87%, given how oversampled USHCN is (QA issues notwithstanding).”
You miss the point that I have been making all along about the Menne paper dividing the CRN12345 ratings at CRN12 vs CRN345. There just are not that many CRN12 stations. A divide at CRN123 vs CRN45 makes more sense if one is attempting to get sufficient numbers for some reasonable statistical significance. I have been through the calculations and given the station to station variability it is difficult to get a meaningful comparisons with the small number of CRN12 stations – that was, of course, long before the evaluations were completed.
My other point was that if you are looking at changes in diurnal trends why use the small numbers in the CRN12 stations, because surely there exist studies with larger samples.
PaulM (Comment#72501)
April 1st, 2011 at 3:02 am
Re: Carrick (Apr 1 01:44),
“OTH, Zeke why are you using CRUTEMP rather than HADCRUT?â€
This arises from the rather confusing idea of Muller (read his testimony) that the land temperature rise is what we call global warming. Of course most of us would say that global warming should be land+ocean.
Also you might need to rethink your rude remark to Anthony, after carefully reading what he said.
I think he should apologise profusely and then explain himself
and then decide not to do it again.
John F. Pittman (Comment#72509)
April 1st, 2011 at 6:20 am
Anthony hasn’t done anything yet, he just keeps talking about. It is interesting that Muller mentioned him specifically. Did he realise that, after making a huge fuss, after setting up best, after publishing what is essentially the same conclusion as everyone else, that he was led down a dead end by some people who don’t actually practice science at all.
PaulM:
He did specifically mention HADCRUT in the comment that Zeke was criticizing. If you’re going to be parsimonious, I think you have to take the words as stated, not try and divinate some other meaning from them, and criticize that instead of what was actually said.
I’m not sure how blunt truth can be rephrased, but sometimes it needs to be said:
There’s a big difference between saying things could be improved, which they can, and the suggestion that this improvement would lead to drastically different conclusions, which I know to be highly unlikely.
I think BEST is an important contribution, as I think it will pin down the accuracy of the reconstructions, especially during the period that has especially poor converge and is least well explained by models and data (pre 1950 warming). The mostly likely outcome of a careful study is it will remove a talking point from naysayers to global warming.
I think Anthony has flown off the handle a bit on this one in his comments to Muller, I don’ think that’s called for, and I don’t see any problem responding sharply to people who themselves are crafting sharply worded criticisms. Were I in Anthony’s shoes, I would register disappointment with inaccuracies in Muller’s narrative (while recognizing the enormous difficulty in making truly accurate statements in a statement at a congressional hearing).
bugs:
No, you’re completely wrong on this. But then you don’t practice science yourself, so you have no idea at all relating to the the importance of the exercise. What Anthony and his group at http://www.surfacestations.org/ is doing is important, even if it doesn’t change conclusions about the data that you personally find interesting.
steven richards:
I think you should learn how to include quote so people know what you’re trying to even say. It’s pretty simple…. <blockquote> quoted material </blockquote>
Carrick,
BEST has only done a land temperature reconstruction, and compared their results to the three main land temperature reconstructions (NCDC, CRUTEM, GISTemp). This is somewhat problematic, as the three show rather large differences due to methodological choices in how land area is defined, but it gives you a broad sense of how they compare.
But yes, Muller misidentifies it as HadCRU in his testimony.
Kenneth,
Fair enough; using the partial series will give an incomplete picture, and the old CRN12 group is a tad small (so a few station moves in the 40s, for example, have an outsized impact). I look forward to playing around with the full data set once it comes out.
Well A few points.
1. The complaint about bad siting has been going on since at least 2007
2. The whole thrust of the skeptical argument was that sites where being warmed by non climatic influences. In short we cannot trust the record
of the average global temperature. It is biased warm.
3. Some of us have been arguing that the Bias MUST be small, but that the
added variance might be higher with poorly sited stations. We (err me)
have been denied access to the data backing up the claims made in #2.
we wait patiently for data to back up the claims.
4. Muller takes a preliminary look at the data and reports that there is no substantial bias. but that work is preliminary.
5. Anthony publishes the abstract to a submitted paper that finds NO bias
in Tave. Tave is what is used to determine the Global temperature Index.
The topic gets changes to DTR.
So, to be clear. In the preliminary results of BEST and in the yet to be published results of Anthony, Poor siting did not bias Tave.
well, Duh.
I wish Sod were still around. he deserves some credit
Steven Mosher,
Conceptually, you are correct: solar increases should increase DTR, greenhouse increases should decrease DTR. I would point out, however, that decreased cloudiness, which has been recently observed as a strong positive feedback for global temp, is a negative feedback for DTR, because it results in higher daytime temps. This is probably a better explanation for the flat-ish DTR curve since 1980 than the MMTS change. So like everything else in the climate system, there’s more here than meets the eye.
Mosh: or JohnV. I miss that guy.
Steve Mosher @ Comment # 72524:
Your observations are without the necessary details:
What was being compared?
What is the statistical significance?
What time period was used for the comparison?
I would not judge that the mean temperature trends will change much from any of these findings (and particularly so over the past 30 years), even though it is the relative change given the US trend over time that is important, but certainly poor sitings would have to add to the plus/minus of a trend even when the trend is not biased.
This quote by Pielke Sr on Muller’s testimony is on point I think
“..All his study has accomplished so far is to confirm that NCDC, GISS and CRU honestly used the raw observed data as the starting point for their analyses. This is not a surprising result. We have never questioned this aspect of their analyses…”
http://pielkeclimatesci.wordpress.com/2011/04/01/comments-on-the-testimony-of-richard-muller-at-the-united-states-house-of-representatives-committee-on-energy-and-the-environment/
the issues include:
â– a systematic bias in the use of multi-decadal trends in minimum air temperatures
â– the use of surface observing sites that are not spatially representative of the region
â– the failure to consider the variation of surface air temperature trends with height above the surface
â– the lack of incorporation of the effect of concurrent multi-decadal trends in the surface air absolute humidity
■the absence of the statistical documentation of the uncertainty of each step in the adjustment of raw data to a “homogenized data set†(e.g. time of observation bias; equipment changes; station moves)
â– the need to assess the absolute temperatures at which a temperature trend occurs, since a temperature anomaly at a cold temperature has less of an effect on outgoing long wave radiation than the same temperature anomaly at a warmer temperature.
Ed Forbes,
I agree that nothing in his testimony was particularly surprising (though I didn’t expect him to announce the results of their station siting analysis).
However, plenty of people -have- questioned whether or not NCDC/GISS/CRU honestly used raw observed data. Indeed, quite a few of the older threads on WUWT involve discussions of how nefarious adjustments are being cooked up by Hansen et al, though its died down a bit since various bloggers put out their own reconstructions.
Zeke: “..However, plenty of people -have- questioned whether or not NCDC/GISS/CRU honestly used raw observed data..”
The Harry Readme File is what caught my attention the most on how the raw data was used by “the experts”.
Which “..the absence of the statistical documentation of the uncertainty of each step in the adjustment of raw data to a “homogenized data set†(e.g. time of observation bias; equipment changes; station moves)…” covers
I believe it would be more fair to say that others ( me included ) have quite a bit of trouble with what they (may?) have done with the raw data.
I can not help myself 🙂
“..“What the hell is supposed to happen here? Oh yeah- there is no ’supposed,’ I can make it up. So I have : – )â€
Carrick (Comment#72499)
April 1st, 2011 at 1:32 am
Anthony:
. According to the best-sited stations, the diurnal temperature range in the lower 48 states has no century-scale trend.
It’s complete poppycock to suggest, as you appear to be trying, that there has been no century wide trend either in the lower 48 states, or in the world data, or that this trend is artificial.
You have your head stuck pretty far in the sand if you really believe such farcical nonsense.
——————————————————————–
Poppycock ? dont think he is talking about average temp trends.. He is
talking about dirunal range trend….
Lucia quote”The word diurnal range is more-or-less the difference between maximum and minimum temperatures,right? If so, then what we learn is days and nights both warmed up the same amount.”
are you saying there is a well known trend in the dirunal range??
Kenneth Fritsch (Comment#72530)
well there are not many details to discuss. All we have are words from Muller and an Abstract from Anthony, so the details will have to wait.
The point is this. Since 2007 people have beat the drum pretty heavily that the record must be biased because of siting issues.
One point I would like to raise about that is the confusion over the meaning of CRN1, CRN2,CRN3,CRN4,CRN5
From the beginning the meaning of this has been obscured. One side of the debate insisted that this meant a BIAS of 3C for CRN3.
The other side of the debate insisted that this meant a maximum bias of +-3C.
On Climate audit one of Dr. LeRoy’s associates came on and made it clear. a CRN3 does NOT have a constant bias of 3C. it might on a given day see +3C or – 3C. Sod was one of the few people who actually read that guys comment. More than a year later Sod reminded me of that comment. That very same scientist then visited
this blog. He explained himself again. The average BIAS he saw in field tests was .1C for CRN2,CRN3, CRN4. He did not test CRN5.
The spread of the biases the max and min of the instantaneous bias was larger as the site got poorer. Folks can search this blog for his comments.
The point is this. From the beginning people like JohnV, myself, the scientist who invented the system of rating, have held that the bias to Tave will be small. That work was preliminary and exploratory, but it told me that if you think the effect size is big, you better think twice and design your test with that in mind.
That told me that you had better be circumspec in making speculative claims about huge biases in the system. Some people ignored that advice.
Menne found there to be no signal. Not surprising, that just confirmed my belief that the effect size in Tave would be small.
to be sure there were other issues with Menne, but even his approach would have found a large bias if one existed.
Now we have two “reports”. One report from Muller. he has apparently run the test with the full dataset using a method somewhat like RomanMs. He reports no large bias. He is not done yet as he has a couple of refinements to make to his method.
The second report is Anthony’s Abstract. They report no large bias in Tave.
That has been the concern. The concern has been a bias in Tave
Now, they do note that Tmax and Tmin and consequently DTR are impacted.
That is an interesting finding. But it kinda supports what people like Eli rabbet surmised. The pluses and the minuses will even out.
It does, I would think, make it more difficult to use variables like Tmin or Tmax ( for climate extremes) and would make DTR a suspect variable. But, it would appear that Tave is reliable.
All of this of course is speculative since we dont have any of the the supporting data or supporting code.
Still I wanted to take some time aside to credit folks like Sod. he and I disagreed about a lot of things, but he had a good recall for what has been claimed over the years.
KAP (Comment#72526)
April 1st, 2011 at 9:07 am
Steven Mosher,
Conceptually, you are correct: solar increases should increase DTR, greenhouse increases should decrease DTR. I would point out, however, that decreased cloudiness, which has been recently observed as a strong positive feedback for global temp, is a negative feedback for DTR, because it results in higher daytime temps. This is probably a better explanation for the flat-ish DTR curve since 1980 than the MMTS change. So like everything else in the climate system, there’s more here than meets the eye.
#############################
looks like we may get into another sunshine discussion. It also made me wonder if the GCMs model the changing heat capacity of the surface in appropriate ways. I’ve started some looking at some land use data.. Hyde
Carrick, you really lose your credibility sometimes with your stubborn attitude.
Muller says quite clearly in his testimony that he is talking about the LAND temperature rise – I am taking his words as stated. Clearly he got confused over hadcru/crutem.
And you still owe Anthony an apology for your rant in response to his observation about lack of trend in the diurnal variation. (See R Connelly’s comment). Anthony is not saying there is no trend.
Re: bugs (Apr 1 07:25), No, bugs. Just getting the 80+% he has, is real science. To do real science you need to make sure your instruments are doing what they are supposed to be doing. Sometimes you can correct bad data; sometimes you CAN’T. Whether he publishes anything or not, just compiling what is going on in the instruments that all these temperature reconstructions use is real science.
You are incorrect that Anthony is not doing science. If you were to point to people who stayed at the desk and modeled wind, etc, without the verification that can be done with Anthony’s data, I would agree with you. But you miss the point, that it was not done and much of the work about UHI is speculation.
Although I agree with Mosher about the extent of the contamination, and would not be surprised if it was what Jones, IPCC, etc, say, scientists are supposed to confirm their speculation. You should be thanking Anthony as should they. Especially if it turns out that Jones etc were correct. They would “owe” Anthony the most. He did their work for them.
John Pittman.
Well put. I would distinguish between the volunteer effort to collect the data which scientists like Jones should be thankful for, and the over reaching speculation about the preliminary “results”.
The certitude that some expressed when they argued that there was no effect and the certitude that some expressed in arguing that the effect was huge. It made it very hard for measured voices and opinions to even be heard. So sitting in the middle and saying “I think the effect will be small, but lets test it” has been a very hard position to hold. With one side clamoring that the bias is obvious and destroys the science of AGW, and the other side saying “dont look, you wont find anything, and you are league with the deniers for suggesting that we should look at it.” Odd, that wanting an answer to the question should get so much criticism.
PaulM: Muller also clear says Hadcrut, I take him at his word when he says he used that data set to perform the analysis. It’s actually a separate issue as to whether he got HADCrUT confused with land-only (CRUTEMP) or not. Anthony also believes that’s what’s happened, I think so too, but if he says he uses HADCRUT to obtain those numbers, that’s what you should use to vet his numbers.
Regarding my comment to Anthony, had the comment above been the only one he had ever made on the topic, you would certainly have a point.
However, there is quite a bit more history to Anthony’s comments that this one, as I expect you are fully ware.
For example see this:
Surface Temperature Records: Policy Driven Deception? by D’Aleo and Watts.
In that document they state unequivocally:
Exhibit A: head firmly in sand.
Having brought up the question of the paper Anthony is writing, what is the context in which we are expected to read it?
Are we really supposed to ignore the history of prior author comments and treat each new comment as if it were not part of a coherent whole? The assumption that Anthony isn’t attempting a coherent argument seems unduly pessimistic of Anthony’s cognitive abilities to me.
So that said, I’m confused about your own comments. Are you really that unaware of Anthony and the general theme of his remarks on this topic, and do you not see this comment as a continuation of that same thread? How could you not?
Zeke:
Does he misidentify the series he analyzed, or does he misidentify what the series he analyzed constitutes?
As I said to PaulM, if somebody tells me they uses Series A, I’d take them at their word for that, even if they don’t understand what Series A represents.
Isn’t that the most credible way of interpreting his comments?
R. Conneley, if Anthony’s comments were really limited in the fashion that you suggest, what was the point of even bringing it up?
Your reading makes it simply OT.
Re: Carrick (Apr 1 13:00),
A neutral observer coming to the site would only have the context of your post. In that post, you quote a sentence that appears to be correct and go ballistic. Then you go into full defensive mode when this is pointed out. What is one supposed to think? Bad hair day?
Carrick,
Compare the green line in Muller’s testimony to the CRUTEM3 line in my graph. If he had used combined land/ocean HadCRU, there would have been a rather large difference: http://stevengoddard.files.wordpress.com/2011/04/animationimage1108.jpg
Ok lets accept the initial results and all the others. Why in hell is ALL the data up to 1980 significantly, and I would say very significantly BELOW the 0C anomaly. Eyeballing seems to comprise 80% data up to 1980 There is something very wrong here. How can the baseline be correct? The data is skewed towards colder.
Thanks, Zeke. That makes sense. So he’s completely confused then, not just a little.
DeWitt, count me skeptical that anybody thinks Anthony doesn’t have an agenda, or that people really had trouble understanding the motivation of his posting that comment here.
Ok let’ s say we accept the initial results and all the others (I said I would accept the BEST analysis). Why in hell is ALL the data up to 1980 significantly, and I would say very significantly BELOW the 0C anomaly baseline. Eyeballing, it seems to comprise 80-90% of data up to 1980. There is something very wrong here. How can the baseline be correct? The data is actually “cold†but the baseline is warm?. In my view this is showing that the NORMAL temp is COLDER (80-90% of time). This is in ALL the global temperatures graphs produced by GISS NOAA, HADCRUT and BEST. The way the baseline has been calculated must be wrong! Maybe Im just plain stupid and maybe I ain’t explaining myself but I hope you get the gist of what I am saying. but I would like to get an explanation from Zeke, Lucia, Willis or E Smith or even Anthony please. Thanks if you have the time.
Stephan,
All of the data up to 1980 is below zero because the data uses a 1961-1990 baseline. If you used a 1900-2000 baseline, most of the data before 1950 would be below zero. Because these charts show anomalies rather than absolute temperatures, the baseline is somewhat arbitrary and doesn’t change the data shown, just the numbers on the y-axis.
Stephan,
The baseline is completely arbitrary. It really doesn’t matter what you use as a baseline, because you’re comparing a single site to itself at a different time: it’s a change, plus or minus. Doing it this way will remove (most of) the instrumental and geographical bias for a given site, because presumably the before- and after- measurements will contain the same set of biases.
The “global” temp is just the sum total of all those plus or minus changes. The baseline is merely a handy way of determining if a long-term trend exists, and has no other physical meaning.
Carrick,
The chart could also show only the land boxes in the global HadCRUT index (which would effectively be CRUTEM3, but could be reasonably called HadCRUT). Either way, it could be labeled better.
Re: steven mosher (Apr 1 12:48), Mosher, I too have never understood this adamant position taking (stakeholding) on the record. Although I agree the adjustments look suspicious, suspicion is not conviction. I, at first, thought with UHI and the fact that people tend to make measurements where people live would result in a positive bias. The truth is that humans do lots of things. Some can be the cause of a false positive signal and some a false negative signal.
The problem is that if you look at UHI and when the largest effects occur, it could add as much as 5F on a short term basis. But in that we are looking for a trend of about 1C over a 100+ years, the bias cannot be maintained unless about 5% exhibit UHI each and every year. Though this seems possible, the problem is that the phenomena is a log decay with respect to population, and we know population has been increasing exponentially in most of the time and areas. It is not a good match.
I still suspect that the effect of lack of coverage in such areas such as Africa and Siberia are underestimated. This is an area where 5% could be occurring with demonstrable effects, and because the geological extent of the poorly covered areas, UHI, and poor adherence to standards, could impact the world average, and therefore the trend. The US has too many stations in too small an area to support a large effect anyway.
But Anthony could be correct, and his and the volunteers work was definitely needed. I also think that those who called for a world effort are correct. In my opinion, the worse that could happen is that the metadata from the US shows little impact, and persons would erroneously conclude it is not needed worldwide. That would be a mistake in my opinion.
Thanks KAP, Zeke for your replies, much appreciated. Too bad we can’t look further back to say, 1000 years. This in my view would be a meaningful baseline. In climate terms and my view, this baseline is meaningless. Unfortunately I cannot be convinced, and remain a skeptic, BTW its just a gut feeling, that its not right. If there is wraming it seems to be extremely selective. Look at this
http://data.giss.nasa.gov/cgi-bin/gistemp/gistemp_station.py?id=308860680004&data_set=1&num_neighbors=1
In Paraguay No warming whatsoever nothing zilch please explain. There are hundreds of others not showing any warmin and others showing warming/cooling etc.
BTW my dad set up most of the WMO stations in Paraguay and Bolivia in the 70’s just as an aside piece of info
steven mosher (Comment#72538)
Steven, I ask for details of what you said and you did mention Menne so at least you could have provided those details even if the others are not available. I really do not judge that any thinking person is really interested in the exaggerated claims by some so-called skeptics or counter claims that are exaggerated by those from the other extreme. What the discussion should about is the details and analyses of the data and people like yourself should be guiding it in that direction.
I would think that the Watts team evaluations would be worth something given a proper analysis and that analysis should have nothing at to do with the claims that some participants might have made about the level of warming/cooling that can be attributed to micro climates around stations.
What I think is often overlooked or misunderstood is the effect of micro climates on a temperature trend and the timing of changes in micro climate. I can view a micro climate as causing an x degree increase/decrease in mean, max and min temperatures over what it would be under ideal conditions, but of course if that warming/cooling condition where there all along the trend would not be effected. A CRN5 rating could involve no change in trend. In another case a change in micro climate that was fully implemented over 30 years ago would not show a change in the trend over those 30 years even though it would currently be viewed as an extreme warming/cooling condition. And of course one would be required to look at trends going back in time for more than 30 years to see it.
John V as I remember his work was probably reacting to some of the exaggerated claims coming out of the evaluations where a warmed micro condition was translated directly to a warming trend. Unfortunately in his effort to defend the status quo, he himself made some rather poor choices of choosing only a few CRN12 stations which also had large trend variations station to station to show no differences – and the statistics and sample size of the matter be hanged.
Although I was aware of RomanM’s initial analysis efforts, I was not aware that RomanM was currently doing an analysis on this matter. If he indeed is I would take his analysis most seriously and be very interested in his results.
Certainly having sites that give large variations around a mean temperature but that are not biased overall would increase the CIs that are estimated for temperature trends and from a science prospective knowing that uncertainty is very important.
Also when you say the bias might be small after talking about exaggerated claims for the bias being very large it is difficult to get my head around what you mean by small – after all the trend for the US over the past century is not all that large.
A final point or two to be considered is that the Watts team evalutions were for a point in time. What if what they saw was proceeded by other micro climate changes for the same site. What if it was once a CRN4 and is currently, as evaluated, a CRN2 or vis versa? What would that imply? The problem with the Watts evaluations is that while they can show the micro climate variations (which must lead to uncertainties) they are not able, as I see it, to determine the history of the micro climate – and that would be the crux of the matter for any biases. The other point here would be estimating the actual change in temperatures that a given micro climate would produce. I would think a truly interested party could reproduce these micro climate conditions for analysis.
tetris, So at first you go after the BEST folks because you didn’t read (or understand) that they were referring to land temps. Then when you are called on your error you make a beef out of how the MSM will perceive what is being said. Then you change the subject to the date issue… the answer to which is simple, they cherry picked the dates to improve agreement with their models
Julian Flood, Compos? ROFL… so here you present a study of model outputs where observed SST’s were used… to their credit, they used the most prominent models… but to me, models are still garbage… so all Compos et al presented was prominent garbage… however, if you read the press release which accompanied the study, Compos said that the warming in observed SST’s could have been caused by AGW… you missed that part?
Mosher, Anyone who takes data and interprets the results using statistical analysis without understanding what went into them is so off that they might as well be wearing a MAMBLA t-shirt at a family values conference.
Bugs, In this case, bugs has a point… all Anthony has done has been to try to create mud to fling while enjoying trips to Australia and etc… he needs to stick to blogging and leave the science to RP Sr.
Carrick (Comment#72554)
April 1st, 2011 at 1:41 pm
“DeWitt, count me skeptical that anybody thinks Anthony doesn’t have an agenda, or that people really had trouble understanding the motivation of his posting that comment here…”
Now this is just too funny…..I would think that you could count the number of people who post to these climate blogs that do NOT have an agenda on the thumbs of one hand.
for…against…does not matter..if you are here you would be counted as having an agenda by definition by any rational definition.
Ed, could you suggest where you think I’ve claimed to not have an agenda, or where I’ve said having an agenda in itself is a problem?
Its funny.. I had an agenda 3 years ago. I saw the hadcrut global temps I thought WTF were in trouble!. Then I started to see some more serious divergent papers ie Svensmark, the data itself, the hadcrut, GISS, UAH data now going down, climategate etc and since then I just don’t believe at all in AGW. I suppose I do have an anti-AGW agenda now. The good news is that the argument between AGW believers and non believers will never be as intense as left versus right etc, its only the science were arguing about now, settled not settled. Its quite an enjoyable argument in any case…. I don’t think any of use will give up our cause, this is the nature of the climate change etc., beast.
In fact, both sides of the argument have valid points. The AGW camp says its C02 (with which I disagree totally), but some of the warmists have other valid points which is overpopulation, excessive urbanization, overuse of land (which I agree does affect temps LOCALLY: see Pielkes SR numerous papers, even UIH shows this,re Watts etc). The Anti-AGW also has valid points (there is no significant warming due to C02 with which I agree totally), we could be spending billions on a non-event. My main worry now is that the warmist camp is embedded in financial dependence to keep the AGW story going and it will wreck their careers and belittle scientific endeavour, mistakes will be made (re dams in qld Australia, 14 died and millions were lost due to supposed drought scenarios, dams were allowed to fill, which were completely wrong). The biofuels fiasco has cost millions and even ol Al admitted he was wrong. Guys we cannot afford, this get a life. At least wait another ten years to confirm yes or no
Mr Watts, in am eyebrow-raising example of revealing an agenda and pre-judging the results of a study prior to the data even being collected, articulated his dream back in 2007:
I believe we will be able to demonstrate that some of the global warming increase is not from CO2 but from localized changes in the temperature-measurement environment
As the abstract of his long-long-long-awaited paper now focuses on the lack of trend in the diurnal temperature range (watch the pea under the thimble, folks), and states that siting has no effect on the trend in the mean, do we infer that this cherished vision now lies in tatters?
Hmmmm, a 1995 comparison of observations vs models published in Chemical Engineering News, had this:
Furthermore, most models project that with global warming, the increase in mean surface temperatures will be more pronounced during the cold season; that precipitation at mid to high latitudes will increase, especially during the cold season; that droughts will be more severe and longer lasting, particularly during the warm season; that nighttime temperatures will increase more than daytime temperatures during the warm season; that a greater portion of warm season precipitation will come in heavy showers or thunderstorms rather than in gentler, longer lasting rainfalls; and that the day-to-day variability of temperatures will decline for mid to high latitudes. These are changes that are now being observed, if not globally, at least in many regions.
But after many decades, Hansen says, “models show that daytime warming will be almost as great as nighttime warming.”
In light of which I humbly suggest an upcoming headline at WUWT:-
My research confirms Hansen model prediction. …….Heh.
Phil Clarke,
As soon as you can convince us that 15 years = “many decades”.
Of course, reading that laundry list, it would make Jean Dixon blush.
MikeC
Meanwhile back at the farm…
Have a look at how some of the MSM on an AGW/ACC “mission” are already lapping up Muller’s testimony. Have a look at The Economist on-line today: Muller goes off half-cocked in Congress, and the “take” is along the lines of “You see, like we said all along. Temp data is hunky dory. AGW/ACC is real like we said, and the skeptics were wrong all along. So, nothing to see here folks, just move along.”
Fact remains, Muller and Co had no business presenting “preliminary” data at a congressional hearing, including commentary that is either partially or completely wrong. Talk about not understanding the fragility of credibility in the internet age.
Ever wonder why “Climate science” in the eyes of the great unwashed [who by the way are way less stupid that the oh so right-minded ever give them credit for] has lost basically all credibility, and why the entire AGW/ACC topic lives at the bottom of the scale of what really concerns people? Meanwhile those same unwashed are telling the politicians they elect to forget about the musings of Muller and other alarmist-apologists.
Sorry to say -because it sounded so good at the outset- but the BEST project is dead well before arrival.
Is there any reconciliation of the grotesque divergence of tmax and tmin from 1945 on?
http://rankexploits.com/musings/wp-content/uploads/2010/03/Picture-1372.png
If raw max now is below raw max 1934, has it warmed?
If the temperature trend of bad stations is identical to good stations, then it suggests to me that there are no good stations.
Why is everyone who doesn’t like the BEST results so bent out of shape when Zeke has already produced the same findings here several months ago and it has all been out there for everyone to see and disprove? I see, perhaps the result is not quite in line with the sentiment that Watts expressed.
Impressed by the Berkeley set up, Mr Watts wrote in a post published March 6th:
I’m prepared to accept whatever result they produce, even if it proves my premise wrong. I’m taking this bold step because the method has promise. So let’s not pay attention to the little yippers who want to tear it down before they even see the results. I haven’t seen the global result, nobody has, not even the home team, but the method isn’t the madness that we’ve seen from NOAA, NCDC, GISS, and CRU, and, there aren’t any monetary strings attached to the result that I can tell. If the project was terminated tomorrow, nobody loses jobs, no large government programs get shut down, and no dependent programs crash either. That lack of strings attached to funding, plus the broad mix of people involved especially those who have previous experience in handling large data sets gives me greater confidence in the result being closer to a bona fide ground truth than anything we’ve seen yet.
RB: “Why is everyone who doesn’t like the BEST results so bent out of shape …”
The 1.2C figure confuses us.
Using CRUTEM …
The claim that CO2 caused post-1958 warming when 1958 to 2010 is .648, but 1907 to 1938 had .725 of warming.
Nobody who is open minded can look at pre-CO2 periods and post-CO2 periods of similar magnitude and then proclaim it is AGW.
If 2% of random stations are essentially identical to CRUTEM or GISTEMP that confuses anyone who looks at individual stations and find many with no warming at all.
It looks like the fix was in from the beginning.
Phil–
I’m confused by both what you wrote and what the article says. The article seems to suggest that in 1995, Hansen predicted nights would warm faster than days. But “after many decades” said something different. So…by “after many decades”, do you mean that in 1995, Hansen predicted that nights would warm faster than days, but after many decades he changed his prediction? As is: 1995+15 years = 2010. And now Hansen “predicts” that what the 2010 data suggest didn’t happen won’t happen?
From reading between the lines of Mullers references to Watts, I think he believes he was set up. They have obviously gone to a great deal of trouble to come up with nothing, after Watts and McIntyre presented them with a slam dunk case of scientific incompetence and scandal.
Lucia –
After reading it over, it looks like the whole thing was written in 1995, including the Hansen quote. I think that both the article and Hansen were saying that to THAT point (1995), models were predicting more nighttime than daytime warming, but at some point many decades in the future from that time (2025-2055?!) the daytime warming will approximately equal the nighttime warming.
Since obviously Anthony’s project is only taking into account historical data, I’m not sure how my above reading (if correct) could suggest — as Phil states — that Anthony’s research confirms Hansen’s model prediction. If anything, it would seem to contradict it. But I admit I could be reading the above article incorrectly.
Still, as Mosher (and others) have pointed out, I think the more interesting aspect for most people would be that poor station citing does not seem to bias T_avg. At least, that’s what caught my eye in the abstract. Interesting work overall.
Hey Anthony, any truth to this claim from one of your former customers?
http://rabett.blogspot.com/2011/04/contest.html
Bruce (Comment#72589)
April 1st, 2011 at 6:25 pm
“If the temperature trend of bad stations is identical to good stations, then it suggests to me that there are no good stations.”
————–
Translation: I will believe what I want to believe.
As for MMTS sensors causing a cooling bias …
When DMI switched from one type of sunshine recorder to another they left the old ones running when the new ones were set up.
“In spring and summer 2002 the longest possible series of overlapping Casella and Star observations of hours of bright sunshine was put together from the various pairs of overlapping stations. The series was scrutinized to make sure only to select Casella and Star overlap-pairs were the differences were due to the methods of measurements and not due to difference in sunshine at the measuring sites.”
Then they came up with a conversion table for with a conversion factor for each month of the year.
Then they recalculated the climate normals using the conversion factor.
http://www.dmi.dk/dmi/tr02-25.pdf
I have seen no evidence of anything even remotely apporaching such rigor when MMTS was put in.
Therefore I must assume the claim of a .4C cooling bias for MMTS to be spurious.
Tetris, be it on the farm or any where else, you can change the subject and foam at the mouth all you want… the only issue in question was your incorrect assertion that he was referring to global temps rather than land temps.
Bruce: http://rankexploits.com/musings/2010/a-cooling-bias-due-to-mmts/
Bruce??? How does a sunshine meter relate to a thermometer???
Second, the cooling bias claimed in the MMTS conversion was in Max temps, not Mean temps (mean temps was closer to .02… essentially nil). The cooling in Max temps when CRS changed to MMTS has been verified in a number of different studies… except that they never studied what caused the discontinuity… it was beyond the scope of the study in Quayle and ignored in Menne09. So if the cause of the discontinuity was the correction of a trend change in the CRS, then the correction of the “cooling bias” was backwards and they introduced a spurious warm bias into the record.
All base are belong to you, Zeke.
Zeke, my understanding is that only one site had both a MMTS and Lig to compare. Is that correct?
I note one of the papers says: “Although troublesome for climatologists…”
What an understatement.
Also, that does nothing to explain the post-1945 divergence of raw tmax and tmin that continued until 1965 or so.
Also, as a 1991 paper says: “During the past five years, the National Weather Service (NWS) has replaced over half of its liquid-in-glass maximum and minimum thermometers in wooden Cotton Region Shelters (CRSS) with thermistor-based Maximum-Minimum Temperature Systems (MMTSS) housed in smaller plastic shelters.” – Quayle 1991
So … only half changed from 1986 to 1991.
Yet, another paper gives different numbers:
“Over a period of a few years, about two thirds
of the official temperature measuring sites
across the country were equipped with electrical
resistance thermometers in specially designed
radiation shields and with easy to read digital
displays (Figure 1).” Doesken 2005
Which is it? “Half in 5 years” or “two thirds over a few years”?
Yet the min/max divergence which had settled down to almost nothing in 1970 began to diverge again in 1980, 6 years before they started the replacement?
MikeC: “Bruce??? How does a sunshine meter relate to a thermometer???”
I use it as an example of proper methodology when changing types of weather instruments.
As an example, DMI found that the old sensor and new sensor differences changed because of the time of year and came up with an adjustment based on month.
Zeke can assume that such a formula can be retroactively calculated by looking at the data, but I don’t believe that.
And it does nothing to explain the .3C difference in the 1950s.
What caused the tmax/tmin divergence starting in 1980? Not MMTS introductions, which did not start until 1986.
Another thought:
MMTS change supposedly caused a “a warming of minimum temps of around 0.3 C.”
Yet Zeke, in your graph, adjusted min is .23C above raw min.
Tmin adj should be below Tmin raw by .3C. Where did the .53C adjustment come from?
And, are you suggesting a temporal teleconnection? Did the raw Tmax and Tmin divergance start in 1980 because the thermometers knew some them would start being replaced in 1986?
MikeC
Pls consult Muller’s testimony one more time and read for yourself: “this 1.2 degree rise is what we call global warming [sic]”. After which goes on to qualify .6 of the 1.2 as anthropogenic.
Like it or not, but we have the good Dr Muller on record as explicitly telling a congressional hearing that global warming has been 1.2 degrees. We know from previous examples [like the original Steig paper that was released a few days prior to Al Gore scheduled congressional testimony in 2009, allowing Gore to make a representation to Congress that he now had proof that Antarctica was warming too..] it’s that sort of headline grabbing stuff that gets woven into the MSM AGW/ACC coverage, which by the way is rapidly fading. Voters just about everywhere in the developed economies, not just the US, have completely tuned out, having heard overtly activist “climate scientists” cry wolf a couple of times too often.
“this 1.2 degree rise is what we call global warming.”
tetris, have you been bitten by an infected animal? Anyone who knows anything about this debate knows he was talking about land temps… except you that is
Bruce, You seriously need to read the literature you’re quoting from on this subject before blathering further… Quayle and Doeskin were written 14 years apart… so you must be capable of fathoming that more sensors had been replaced during that time
…oh, and this next one is a goodie… you quoted Quayle and didn’t know that it is an MMTS study only? So when Zeke shows you a graph using USHCN v2 numbers which includes other adjustments… hmmmm… why would there be a difference?
On the other hand, you did come to a proper conclusion when you said. “Zeke can assume that such a formula can be retroactively calculated by looking at the data, but I don’t believe that.”
… so there is hope for you
MikeC: “Quayle and Doeskin were written 14 years apart… so you must be capable of fathoming that more sensors had been replaced during that time”
One says half in first 5 years, one says two thirds “over a period of a few years”. I assumed that the “few years” were the first 2 or 3.
Do you know exactly when and how many? I don’t.
The papers don’t seem to either.
And, as I said, the redivergence of Tmax and Tmin started in the late 1970s, before the roll out of MMTS (unless the first paper lied). It hit its peak in 1988 or so, before all the sensors were changed and the difference between raw tmax and tmin didn’t change much after that.
So I am confused when the MMTS rollout is blamed.
But then again, I have found no firm numbers of how many were rolled out when.
Hmmm.
Anthony Watts said the following:
MMTS is used at 75% of the bad sites
MMTS is used at 30% of the good sites.
http://climateprogress.org/2010/01/28/watts-not-to-love-new-study-finds-the-poor-u-s-weather-stations-tend-to-have-a-slight-cool-bias-not-a-warm-one/
How bizarre.
LIAR ALERT, LIAR ALERT… TETRIS FAKED A QUOTE
.
“Prior groups at NOAA, NASA, and in the UK (HadCRU) estimate about a 1.2 degree C land temperature rise from the early 1900s to the present. This 1.2 degree rise is what we call global warming. Their work is excellent, and the Berkeley Earth project strives to build on it.”
Anthony Watt also said:
“Menne mentioned a “counterintuitive†cooling trend in some portions of the data. Interestingly enough, former California State climatologist James Goodridge did an independent analysis of COOP stations in California that had gone through modernization, switching from Stevenson Screens with mercury LIG thermometers to MMTS electronic thermometers. He writes:
Hi Anthony,
I found 58 temperature station in California with data for 1949 to 2008 and where the thermometers had been changed to MMTS and the earlier parts were liquid in glass. The average for the earlier part was 59.17°F and the MMTS fraction averaged 60.07°F.
Jim
A 0.9°F (0.5°C) warmer offset due to modernization is significant, yet NCDC insists that the MMTS units are tested at about 0.05 cooler. I believe they add this adjustment into the final data. Our experience shows the exact opposite should be done and with a greater magnitude. I can provide Jim’s contact info if interested.
When our paper is completed (and hopefully accepted in a journal), we’ll let science do the comparison on data and methods, and we’ll see how it works out. Could I be wrong? Quite possibly. But everything I’ve seen so far tells me I’m on the right track.”
Anthony
http://dotearth.blogs.nytimes.com/2010/01/28/on-weather-stations-and-climate-trends/
I think my comments about DMI are dead on.
To have done the MMTS switchover properly, they would have need several years data at each site with both the MMTS and LIG thermometers running simultaneously. Otherwise, it appears, blanket corrections are more like rolling loaded dice.
MikeC, here is the reference:
http://berkeleyearth.org/Resources/Muller_Testimony_31_March_2011
“Prior groups at NOAA, NASA, and in the UK (HadCRU) estimate about a 1.2 degree C land temperature rise from the early 1900s to the present. This 1.2 degree rise is what we call global warming. Their work is excellent, and the Berkeley Earth project strives to build on it.”
Bruce, If you went to a doctor with a tummy ache and the doctor… without any further testing… said you need to have your bladder removed… would you be skeptical?
Well, that’s what these guys did… they found discontinuities in the records and immediately, without understanding what caused the discontinuities, cured the record with the various adjustments
MikeC
Pls mind your language. Ad homs don’t work on me and only serve to reflect on you.
Now let’s make sure: Muller states: “NOAA, NASA and HadCRU estimate about a 1.2 degree C land temperature rise from the early 1900s to the present. This 1.2 degree rise is what we call global warming”. There’s the quote. We on the same page?
Now try reading Muller’s statement again. He says that the 1.2 degree rise in LAND temperatures “is what we call global warming”. And goes on to say that some .6 of that 1.2 degree rise in LAND temperatures is anthropogenic. So, just to make sure: the 1.2 degree rise in LAND temperatures “is what we call global warming”. SSTs [80% of the earth’s surface] need not apply.
What is so difficult in seeing that Muller’s statement is complete and utter nonsense? He must either think that the folks he’s addressing are simpleton cretins or he’s otherwise breathing his own fumes.
As I pointed out in my original comment, in the next sentence Muller has the audacity not only to absolve NOAA, GISS and HadCru from a decade or so of well documented criticisms leveled at both their data and their methods, but actually sings their praises.
He doesn’t seem to understand that statements like that in Congress shred not only his own credibility but ensure that the BEST project is DOA.
MikeC
Are you there?
Care to respond?
He’s talking about global land temperature. As opposed to the US, Japan, or your back yard. It’s also where “skeptics” have focused 90% of their energies, what with all the talk of UHI, MMTS, TOBS, Stevenson screens, asphalt, and the requisite air conditioners. If anyone remembers, people were very interested in uncovering Phil Jones’ stash of secret land temperature readings. Who knows what earth shaking revelations lie within that 5% of 30% of the earth’s surface! Access to such data warranted about 70 FOI requests.
So, when Muller finds trends virtually indistinguishable from the 3 major analyses using a 2% random sample, and when 5 amateur analyses find the same thing, we can conclude that the accusations of manipulating temperature data with “adjustments” or selective “deletions” is nonsense. In fact, the more sophisticated of these new analyses have found larger trends due to the nature of the least squares method and properly weighted land masks.
But never mind that.
@CCE
specifically, he has found that Watts has misled him. Watts on his site has already cast aside BEST, since it discovered that all the uproar generated there was baseless.
BEST must be wondering why they bothered, and what is the point of carrying on in the long term.
cce: “So, when Muller finds trends virtually indistinguishable from the 3 major analyses using a 2% random sample, and when 5 amateur analyses find the same thing, we can conclude that the accusations of manipulating temperature data with “adjustments†or selective “deletions†is nonsense.”
———————
None of us should forget that in addition to the agreement noted above, the global land and sea suface indicees all show excellent agreement with the two satellite tropospheric methods (UAH and RSS). These two types of methods, based on totally different measurements, provide compelling internal corroboration. The average global instrumental temperature record is irrefutable, Anthony Watts (or Tetris) notwithstanding.
Owen,
“The average global instrumental temperature record is irrefutable, Anthony Watts (or Tetris) notwithstanding.”
.
Well, the recent relatively good agreement between satellite microwave measurements of the lower troposphere and surface measurements is reassuring, but I would be a bit more circumspect about claiming absolute accuracy, especially for the first half of the record. There are some legitimate concerns about how well UHI effects, station moves, and other post-hoc adjustments (like bucket versus engine intake ocean measurements) have been handled. Is the extra uncertainty huge? IMO, probably not more than 0.1C, but I would be more cautious than you about sweeping claims of accuracy.
“So, when Muller finds trends …”
Did he used raw data? Did he go back to the actual raw data?
And how did he find a 1.2C rise? Which orifice did he pull that out of?
Owen: “all show excellent agreement with the two satellite tropospheric methods (UAH and RSS).”
Don’t forget the tropospheric amplification. Globally, the troposphere should warm about 1.2 times faster than the surface.
cce (Comment#72658) – re: the FOI issue – the only reason that the number of requests got into double digits was because CRU blocked the original requests. I was following CA reasonably closely at the time and, FWIW, my recollection of SteveMc’s view is that he did not expect any “earth shaking revelations” in the data.
Yes, he went back to “raw data.”
He likely got the 1.2 degree figure by eyeballing charts, which is slightly more scientific than the conclusions stored in the orifices of, say, Anthony Watts or Pat Michaels. But it’s still sloppy, but not unexpected given the sloppiness of Muller’s other presentations.
From Wikipedia: “the lower troposphere trends calculated from satellite data by UAH and RSS are +0.140 °C/decade and +0.148 °C/decade. The expected trend in the lower troposphere, given the surface data, would be around 0.194 °C/decade”
http://en.wikipedia.org/wiki/Satellite_temperature_measurements
Okay so where is all this 1.2C of Land warming occuring then.
It is not the US. You can get 1.0C in Greenland (which should be subject to polar amplification – double that is).
Looking at some of the maps, the greatest change seems to be in Mongolia and Siberia. Do we think these raw GHCN records are accurate.
curious,
The gang wanted the original data from the missing ~5% of stations and when that was refused, they resorted to crowd sourced harrassment. All for the purpose of highlighting any abnormality so as to undercut CRU. What it wasn’t about was doing actual science.
Zeke, when you say you have raw data, is that before or after stations are merged together to create artificial upward steps?
Chefio post about a Warwick Hughes discovery is fascinating.
http://chiefio.wordpress.com/2011/04/03/stepping-up-global-warming/
Locking in UHI because of station moves. The adjustments cooled off historical data and added to current data to fake warming in NZ.
I really am curious if Muller and BEST went back and analyzed every station move for bias.
I assume their raw data isn’t raw at all.
cce – no big deal – we see things differently. IMO actual science keeps records in a traceable and auditable way.
Bruce –
As I understand it (which is a *very* strong caveat), BEST is going to treat each station move as beginning a new record.
BEST writes in http://www.berkeleyearth.org/Resources/Berkeley_Earth_Summary.pdf : “In addition to the uncertainty adjustments detailed above, we might also search for statistically significant discontinuities in the record that could indicate undocumented station moves and similar problems. The impact of discontinuities can be resolved by partitioning such data into two time series with independent baseline estimators.” — which is a hint that they deal with station moves by considering each location as a distinct record.
Folks,
Let’s all come back to earth and not get lost in interminable if, buts, whats and maybes. Fact is, Muller explicitly stated that the 1.2 degree C rise in LAND temps is what we call “global warming”. Forgey about SSTs or any other relevant data points. Muller’s statement is complete and inexcusable nonsense. And if that is what BEST’s leading light thinks he can state in a congressional hearing and get away with, the BEST program’s crebility is in tatters. DOA.
HaroldW, thanks for the link.
“Whenever possible, we have used raw data rather than previously homogenized or edited data.”
Thats answers my question. The new question is, what % of the data is adulterated/ruined by homogenization/edits.
I wonder how much of the “random 2%” was pre-manipulated?
Zeke, have you given any thought to why Tmax and Tmin diverged 5 years before MMTS was rolled out?
Bruce,
Not all the MMTS stations were installed at the same time; indeed, the first transitions began around 1982. The min/max difference prior to then was well within the range of past variability between the two.
If you want to test if MMTS transitions had a bias, there are a number of ways to go about it. The simplest is compare MMTS stations to non-MMTS stations, as I did in the prior post. A more nuanced approach would be to select nearby pairs of MMTS and non-MMTS stations and track anomalies over time.
In general, you should bear in mind that MMTS transitions also involved station moves in most cases, as MMTS requires electricity and in many cases stations were moved closer to buildings when the instruments were installed. These moves tend to make the signal from MMTS a bit more noisy.
As far as the BEST method goes, they use a detection algorithm similar to Menne’s PHA that compares individual stations to their neighbors to try and detect breaks or other inhomogenities. When the inhomogenities are detected, instead of adjust the temperature they simply treat the breaks as the start of a new record.
Their data is as “raw” as possible for temperature data. In a sense, all data will be subject to differing factors based on the instrument that read it (and the time of day it was read), so they take the raw data and apply an algorithm that automatically detects anomalous inhomogenities.
tetris,
It was clear that he was talking about global warming with respect to the global land surface.
Now, a few years ago, a respected professor of statistics presented a paper before Congress titled “Ad Hoc Committee Report on the ‘Hockey Stick’ Global Climate Reconstruction.'” Setting aside the content of the report, does the accuracy of the title itself leave the credibilty of that professor in tatters?
Zeke: “Not all the MMTS stations were installed at the same time; indeed, the first transitions began around 1982. ”
1? 2? Do you have any numbers?
The papers I find all say mid to late 80s
“In the mid- to late-1980s, the MMTS, with a multiple
stacked-plate design, began replacing the CRS in the U.S.
cooperative weather station network.”
http://journals.ametsoc.org/doi/pdf/10.1175/1520-0426(2001)018%3C0851%3ATEOTAM%3E2.0.CO%3B2
“The fractional instrumentation numbers are due to instruments
changing during the 1989–91 period”
http://www.ncdc.noaa.gov/oa/wmo/ccl/rural-urban.pdf
(Interesting aside, it appears the MMTS bias is mostly sunlight related and a single fudge factor country wide is incorrect)
“Simply saying that the dataset is homogeneous
after addressing only one of several problems
is not sufficient. Toward that end, this analysis
suggests that the Quayle et al. (1991) adjustment for the
transition from liquid-in-glass thermometers in cotton
region shelters to the MMTS should be reevaluated.”
Not good.
“In the mid- and late-1980s, the widely used air temperature radiation shield called the Cotton Region Shelter (CRS) was gradually replaced by the Maximum and Minimum Temperature System (MMTS) in the cooperative weather station network.”
http://journals.ametsoc.org/doi/pdf/10.1175/1520-0426%282001%29018%3C1470%3ASPORIS%3E2.0.CO%3B2
Interesting paper.
MMTS are out by .5C if air speed is less than 2 m/s and go down to 0 error if the wind speed hits 5 m/s.
Big bias there.
Anyway …
Zeke, do you have any evidece of a significant 1982 rollout of MMTS? Or all these papers misleading us?
cce
That is not clear at all, other than in your interpertation. Read the quote again: Muller explicitly states – during a congressional hearing, how much more of a political setting can you get- that the 1.2 degree C rise in LAND temps “is what we call global warming”. It’s not possible to somehow apologize that away just because it is politically inconvenient for some folks. It is inexcusable nonsense coming from someone who is either on a mission or terminally niave, and reflects badly on the crebility of the BEST project he leads. No more, no less.
cce,
The fact that most sceptical comment focusses on the land temperature record only reflects that that is what the main temp series and all those amateur reconstructions do also.
Land comprises around 30% of the Earth’s surface and even that 30% is poorly measured in large areas. Yet Muller apparently believes that these measurements represent ‘global warming’ and to a hitherto unrecognised degree!
Does not bode well for the BEST project.
Bruce (Comment#72663)
The BEST website tells you what they did, I suggest you look there.
The US Land temperature record trend has been adjusted upward by 0.5C in the last 11 years, since 1999.
The 1930s were made cooler by 0.15C and the late 1990s were made warmer by 0.35C.
How exactly does the MMTS sensors cause that?
The adjustment for MMTS sensor was supposed to be fixed 8 years earlier than the latest series of changes.
Why were all the changes made after Quayle 1991 (MMTS), Karl 1986 (TOBS), Karl and Williams 1987 (SHAP), Karl 1988 (UHI) etc.
In other words, even after the major adjustment algorithms were fully implemented, the trend got adjusted by even more in the time afterward. Menne (2010?)
The Blue Line below shows how each year was changed since 1999.
http://img251.imageshack.us/img251/3259/gistempuschanges11years.png
I suggest that each time someone plots two temperature series against each other, the differential also be plotted so we can see the systematic nature of the difference if there is one.
You know what I like about the Quayle paper (out of all the insane stuff) ?
“There is some anecdotal evidence that old (pre-1975 ) LIG instruments were of higher quality than new LIG instruments…”
http://journals.ametsoc.org/doi/pdf/10.1175/1520-0477%281991%29072%3C1718%3AEORTCI%3E2.0.CO%3B2
So in fact, it is possible that no-bias correction should be made to data if a pre-1975 LIG was replaced with MMTS.
Thats insane.
Add to that the .5C bias in MMTS when the wind isn’t blowing.
Add to that the siting problems when MMTS were brought in.
I think a fair person reading about the MMTS / LIG switchover would concluded that the switchover has the biggest cluster**** in the history of climate measuring, and anyone who applies an MMTS bias correction is possibly commiting fraud.
Re: Dave Andrews (Apr 3 14:04),
Wrong. He is starting with the Land record because that is where all the debate has been.
In due course the will look at the SST records.
I beRe: curious (Apr 3 10:07),
The story goes like this.
in 2007 willis and Steve did requests of data to look at UHI.
Cru gave into Steves request ( for jones 1990 data) and gave
in on half of Willis’ request.
The Next request was for data that CRU had ALREADY given to
to Peter Webster. The request specified data given to webster.
That request was denied with a reason that was obviously a lie.
A. There are agreements that restrict the release to non academics.
The lie was tested by having several academics request the data.
Those requests were responded to with other lies. That agreements restricted
all releases ( how did webster get it? how did CRU give it to met? to rutherford).
Because CRU lied about the content of these agreements, we crowd sourced
a request for the Agreements.
The inquiry found that CRU brought the trouble ON THEMSELVES
I dont know why its so hard for people to remember this.
Re: Zeke (Apr 3 11:49),
One way to look at the “scalpel” is that the MMTS adjustment and TOBS adjustements will be done over by the LS algorithm. That addresses my
concern about the accurate calculation of a an uncertainty due to adjustments.
The other think people forget is that Willis eschenbach (and I) long ago suggested a similar approach. Slicing series when a change is made.
Wllis however preferred using FDM after the slicing. and FDM is known to have severe issues when tested with synthetic data.
So in a way BEST is implementing Suggestions that have been made over the years by people who have been critical of adjustments.
Of course, its takes someone with a memory of the long debate to recall various positions folks have held over the years.
Mosher
“He is starting with the Land record because that is where all the debate has been”. Is that so? Please elaborate, because that’s not where the debate is centered at all. “In due course he will look at the SST records” ?? Come on Mosher. You’re a pretty intelligent guy and I’m sure you understand that what happened is that Muller put his foot in it up to his ankles [and in the process wingshot the BEST project {which we all understand you too had high hopes for}].
Inescapable fact is that Muller told a congressional hearing that the 1.2 degree C rise in LAND temperatures is “what we call global warming”. No room for explaining away, no matter how inconvenient.
Are you actually implying that it’s OK for Muller to make that statement to elected members of Congress last week, but he’ll “sorta” be back with some other data series [which are unlikely to support his original statement] when his BEST team has actually crunched the rest of the data sources and there is [presumably] another congressional hearing?
I have pointed out on this blog and elsewhere how the release of e.g. the original Steig Antarctica temp paper was timed to coincide with Gore’s scheduled congressional testimony a couple of days later, and I think that one has to be terminally naive to believe that Muller’s comments were neutral in either their content and timing. One thing is clear, protestations notwithstanding, whatever the BEST program’s objectives may have been, its credibility is shot.
By the way, did Obama say “We can” or didn’t he? The fact that he hasn’t produced as expected [which is causing him credibility problems no end as we all understand] doesn’t mean he didn’t say what he said. Same applies to Muller. No matter how inconvenient for any of his apologists or BEST’s boosters.
Mosher,
As I asked MikeC earlier on: care to respond? [silence so far].
No hand waving or getting lost in green bolts, blue washers and assorted nuts.
Look, I have no respect for Muller. I’ve seen his video presentation and he is a buffoon. I’ve watched his testimony. His numbers are bogus, as many have pointed out. Someone gave him a graph and he eyeballed it. But it’s clear what he’s talking about. He is not selectively choosing one point on earth, which is the modis operandi of so many skeptics. Witness the Cult of the Medieval Warm Period. Global schmobal.
If you show warming of the global land surface, you’ve also shown warming of the globe, which will be proportionally less. Before reasonably complete SST data was available, the land surface is all that people had, and they had no problem calling it global warming. But everyone knew that they were talking about just the land surface.
And that is, like it or not, where “all the debate has been.” The FOI requests were about land measurements, not SST. It’s surfacestations.org, not waterbuckets.org. Air conditioners. Time of Observation. MMTS. Urban Heat Island. Y2K. Endless words spent cursing Hansen until he released the code and enthusiasm seemingly dissipated over night (with some help from JohnV). SST is, of course, more important. But, now back to those pictures of Stevenson screens . . .
If BEST uses the least squares method in the manner that they describe, and if they come up with a statistically sound interpolation method, then it will be the best available temperature series (although I think Nick Stokes’ will eventually be quite robust, assuming he doesn’t run out of effort). They’re going to also do UHI, but I doubt if they’re going to accomplish much on that end. But it is impossible to process this data and come up with anything dramatically different than what everyone else has come up with. If it was possible, Watts or some other dope (genius?) would have done it by now. Instead, they’re busy creating the scandal of the inadequate diurnal temperature range. Skeptics have been at this for decades, and they’ve come up with squat. People need to get over this fantasy of cooling hiding in the bushes and accept reality.
At the very least, there will be a huge increase in the volume of easily accessible temperature data. I suspect Zeke et al. are licking their chops. Don’t expect them to save you either.
Muller was invited by the Republicans. The schedule was set by them. Do you think that he got space in the Wall Street Journal trashing Gore, duped the Kochs (of all people) into funding this project, and then lied in wait for Republicans to call him to testify so he could yank the rug out from under Fraud, Fraud, Fraud crowd? Machiavellian genius!
This is what I said two weeks ago, back when Muller was still chummy with Watts.
“If the results of BEST get wide recognition (and I’m not holding out for airtime on FoxNews), you’ll see any goodwill towards Muller drain away. You’ll see pennyweight mathematicians posting to Wazzup explaining how you have to have a station every 50 km or some such nonsense. The Gish Gallup will be fierce. You will not see acknowledgement from Anthony ‘I conclude it to be unreliable’ Watts or any of the other opinion factories that the data is ‘reliable enough.'”
None of what we are seeing was in doubt.
cce, all that and you forgot to hide the decline and the missing heat
now… hmmmmm… do I go back to chasing my 2nd 10+ lb largemouth for the week or respond to that lying scab who was caught using fake quotes… I’ll have to think about that one for a few days
I REPEAT… I REPEAT… THERE IS NO MATHEMATICAL ALGORITHEM WHICH WILL RESOLVE ANY DISCONTINUITY UNTIL YOU KNOW WHAT CAUSED THE DISCONTINUITY THUS GIVING YOU A CLUE AS TO WHAT THE CURE FOR THE DISCONTINUITY IS
MikeC–
The ALLCAPS are inappropriate.
cce
Have a look at the L A Times today. They get what is wrong with the Muller/BEST picture. No data, no peer reviewed papers. Unsubstantiated nonsense.
And MikeC, please mind your language.
I see:
“Critics’ review unexpectedly supports scientific consensus on global warming”
http://www.latimes.com/news/local/la-me-climate-berkeley-20110404,0,772697.story
And, earlier:
“Berkeley scientists’ climate data review puts them at center of national debate”
http://www.latimes.com/news/local/la-me-berkeley-climate-20110331,0,2472031.story
I guess the skeptics will have to keep waiting for their prince. Certainly there is one brave soul out there with a couple of statistics courses under their belt, ready to tell people what they want to hear. Will anyone take up that challenge? Anyone? Monckton, I’m looking in your direction.
But I am glad to see the unexpected stand taken against unsubstantiated claims in favor of peer review.
cce: “I guess the skeptics will have to keep waiting for their prince”
It is called bright sunshine hours. Lookup global brightening/dimming/brightening.
The UK is up 6% bright sunshine hours since 1929.
Japan is up 10% over the 20th century.
Spain is up 4%.
The Greater Alpine Region is up 17-29%
And I’m sure there are a lot more studies show more solar energy hitting the earth.
The up and down of dimming and brightening match the PDO and the temperature up and down.
Sure, the last 20-30 years are partly UHI too.
The CO2 con depends on people not noticing that other things have changed too … like aerosols, clouds sunshine and humidity.
cce
Yes. Peer review is perfectly fine as long as it is not corrupted by underlying interests. Pls ref the instructive 2009 Climategate emails for pointers, in case you have any doubts on the topic.
Also, why not ask the peer reviewers involved in the rebuttal paper to the Steig original or those currently reviewing Spencer’s rebuttal of the Dressler paper, why they were/are sitting on their thumbs for 5,6,7,8 or 9 months and produce 80 odd pages of “comments” as the case may be? What do you call that? Peer “review” or the willful obstruction of “inconvenient” research?
tetris,
You are being careless with the truth. Reviewers of the O10 response to S09 did not produce 80 odd pages of comments. And they did not sit on their thumbs for 5,6,7,8,9 months. The first submission of O10 was sent 9 Feb 2010. Steig’s 14-page review was received 5 Mar. A revised version was submitted 10 June. Steig’s 6-page review was received 21 July. The longest gap seems to have been the third, with submission 12 August and Steig’s 4-page review on 25 October.
Referees and editors have day jobs too.
tetris,
O’Donnell et al. was published and it is a good paper that improved the science.
If Spencer’s reply isn’t published, he’ll just write another book. That way, everyone can receive his wisdom without the hassle of all of those pesky reviewers.
You will find that often the result of peer review is a lot of delays and a lot of unpublished papers. Go to James Annan’s website for a couple of recent examples. Or look up Hansen’s peak oil paper from a few years back. I hate to break it to you, but that’s how it goes. And sometimes papers that shouldn’t be published are. For example, papers proclaiming the entire greenhouse effect to be a fantasy.
If by some strange alignment of the stars someone like Watts was asked to review the forthcoming BEST papers (or any other paper showing similar warming, which is to say all of them), how long do you think it would sit in “review?” I’m guessing until sometime after the Sun burns out.
Bruce,
Global dimming has nothing to do with skeptics inability to produce a global temperature series using thermometer readings establishing an artificial warm bias in the others.
NS @ 11:01 PM
That day job, that’s a Matlab course, right?
=============
cce: “Global dimming has nothing to do with skeptics inability to produce a global temperature series using thermometer readings establishing an artificial warm bias in the others.”
Almost all of the data has been pre-massaged.
There is no such thing as raw data anymore.
You can’t trust the post-MMTS data since the “correction” applied can’t be tested because nobody ran the MMTS and CRS siumultaneously for a few years to see if the siting and sensor were actually accurate.
MMTS data is off by .5C if the wind isn’t blowing.
etc etc.
And, have you ever looked at the methods to fabricate historical SST data? Ha! What a joke!
One other thing cce. UAH shows 3 months in a row below the artifical 0 of what is normal.
The topics are -.345C
What happened to CO2 claimed warming.
Did CO2 go down?
http://stevengoddard.wordpress.com/2011/04/05/coldest-march-of-the-millenium/
So … lets assume UAH is correct. -.1C
With NOAA and GISTEMP running at .44C and .40C, I will suggest that UHI is somewhere around .5C and around .35C on HADCRU or CRUMTEM.
In order to get a good idea of “real” temperatures, the proper thing to do is to subtract .54C from NOAA, .5C from GISTEMP and .35C from HADCRU.
I think that might be more accurate.
After looking at Phoenix on GIS where the change is 3.1C from 1957 (meaning 2.5C UHI from all that concreate/ashphault, A/C units etc) I think ~.5C UHI correction might be in the ballpark.
GISTEMP 1998 would be pretty much 0.
Considering no state temperature records were set in the 2000s, I think that is right.
The real question is when the divergence from reality occurred.
Bruce, baseline… period of record
Bruce: not really that much divergence, all things considered.
http://www.yaleclimatemediaforum.org/pics/0211_zh1.jpg