In discussing the initial BEST results, Willis and I took issue with Dr. Muller’s 1.2 C rise in land temperatures over the century. By using a linear regression on the data, taking the resulting trend, and multiplying it by the time period, we suggested that a 0.8 C rise would be more accurate given the data. After reflecting a bit on this, however, I’m concerned that our approach was not the optimal way to figure out the rise in temperature over the full century period, as we were fitting a linear model to a period during which land temperatures were closer to exponential than linear. Upon analyzing the data more, the statement that “prior groups at NOAA, NASA, and in the UK (HadCRU) estimate about a 1.2 degree C land temperature rise from the early 1900s to the present” seems reasonably defendable, though I’d suggest 1.1 C is probably slightly more accurate.
Before I dive into the land records, however, lets take a step back and examine the question: how do you determine the cumulative change over a time period for a noisy variable? You can’t simply take the difference between two arbitrary points, as they may reflect the noise in the series rather than the trend. The standard  method, doing an ordinary least squares linear regression of the data, will only present an accurate result when the data in question is best represented by a linear trend. Lets look at a sample case to demonstrate this:

The graph above shows a set of synthetic data that follows a cubic pattern with both a sinusoidal pattern and white noise added to it. The noiseless data shows a difference of 1.2 C between the 0 and 120 points. However, if we try and estimate the change with a linear regression, we end up only estimating a change of 0.72 C:

Similarly, using a linear trend for land temperature data (NCDC, for example) that exhibits significant non-linearity ends up underestimating the total change over the period (even if it accurately captures the average rate of change):

In addition to plotting the anomalies relative to a certain baseline (e.g. 1961-1990), we can also plot how much warming has occurred from every past year to present:

This data is rather noisy, but shows some clear patterns. The question is, how do we best filter out the noise so we don’t end up cherry-picking particular months to show more or less warming from a particular date? Well, it turns out most of the random noise in the temperature record happens on a timeframe of less than a decade, so applying a 10-year smoothing to the data eliminates most of the year-to-year variability:

In this case, we see about 1.1 C warming from the early 1900s to present, 1.2 C warming from the late 1800s to present.
The astute observer may identify a flaw in this method: namely that we are smoothing past data, but still calculating the change relative to a single present date (2010), a year that happened to be hotter than average. Indeed, if we look at the 10-year smoothed period from 1895-1905 and compare it to the period from 2000-2010, we see closer to 1 C warming.
The general point here is that there is no single correct way to identify the cumulative amount of change in a noisy time series from one date to another, and equally justifiable approaches can result in different results. Muller’s 1.2 C number seems reasonably within the range of possible values, and probably better reflects the rise over that period than the ~0.8 C produced by a simple linear fit.
Or, in layman’s terms, he eyeballed it.
Zeke,
Yup. If you look at the land versus ocean trends, it is clear that the land has pretty consistently warmed about 1.5 times faster than the ocean. (0.3 * 1.5X) + 0.7 * X = 0.85C means X (ocean warming) is about 0.739C and land warming about 1.11C. His guesstimate was not far off. Of course, with noisy data, there is not too much to really argue about.
cce,
If he eyeballed it he should have been upfront in his testimony about that and said that it was not reliable>
cce,
When I say eyeballed I wasn’t meaning it literally, but that he should have been far more circumspect about the initial results and qualified his testimony.
The fact that he did not do this is not promising.
“..You can’t simply take the difference between two arbitrary points, as they may reflect the noise in the series rather than the trend….”
.
“..The general point here is that there is no single correct way to identify the cumulative amount of change in a noisy time series from one date to another, and equally justifiable approaches can result in different results..”
I get it now….try different methods until you find one you like !!
Of course…..everyone else is basing their results on a stright line slope for a result.
looks like someone else is not not following “the consensus”. 🙂
Dave Andrews,
I really don’t have that much of an issue with showing that a random sample of raw data corresponds with the other records; I would be rather surprised if it did not.
Ed Forbes,
There is a difference between calculating the trend (e.g. average change over time) and the cumulative change in a time series. The former will not be a particularly accurate estimate for the latter if the series is nonlinear.
The question “how much has it warmed” is as best ambiguous. Likewise saying “its warmed 1.2C” is likewise ambiguous.
the question “what is the century trend” is different from the question of
how much as it warmed.
As always, numbers and the formulas used to create them are better than words.
numbers, formulas and words are better.
code and comments.. best
steven
Sure. But to be fair to Muller, he’s talking to Congressmen. When speaking to Congressional reps, you mostly need to stick to words. Giving them your code and telling them to plow through it for details is well outside the range of what is reasonable. So, we are left with words.
Muller’s option is to characterize how much it has warmed in words. Linear trends are useful for making statistical statements of certain sorts, but Zeke is correct that they don’t necessarily answer what people really want to know which is “how much it has warmed”.
One could try to answer the question directly – what is the difference between the final and initial value. Not of course by just differencing arbitrary points, but by computing some local mean at each end. One way, if you suspect non-linearity, is to choose the longest segment at the start where you think the nonlinearity won’t have major effect, and regress on that to get the starting value. Same at the other end.
Rather than just choosing segments, you could use for each end a suitably weighted regression.
Muller must be an NCDC fan. 1957 is clearly the warmest pivot year he could have chosen.
I don’t think he eyeballed it. He deliberately picked the pivot year that maximizes the claim of Co2 warming.
He’s a bull**** artist extraordinaire.
isn’t Zeke always saying none of the CO2 claimed warming occurred until 1970 …
Bruce,
The 1970s is the time (globally) when models show the anthropogenic signal becoming differentiable from natural forcings and variability only. I use 1960 as well at times since its a nice even 50 year period. I’m not sure what the significance of 1957 per se is, however.
The significance of 1957 probably is that IPCC AR4 was released in 2007 and Muller interpreted IPCC as saying that the temperature rise of the last 50 years was likely caused in part by human activity.
http://www.mullerandassociates.com/pages/articles/PffP-10-climate.htm
BTW, note that the above text including the choice of 1957 was prepared before Muller embarked upon BEST.
Zeke, someone else mentioned the possibility “1957” was a typo, and the number Muller meant to use was “1975.” I don’t know if that might help you track down what Muller meant, but it’s worth considering.
RB, thanks for suggesting that possibility. I’ve tried to find some source for Muller’s reference to 1957, but so far I haven’t had any luck. You raise a good possibility.
FYI, this is chapter 10 of an undergraduate textbook – Physics for future presidents PFfp10- by Dr. Muller. He explicitly states:
The 2007 report state that it is 90% likely that humans are responsible for at least some of the 1oF observed global warming of the previous 50 years, that is, the warming since 1957.
All I can see from Amazon is that the reprint edition was published in 2009, therefore, the first edition was probably published in 2008.
Been a while since I kept in touch with climate science, it is still amazing to see how much is consistently attributed to malice.
Re: Nick Stokes (Apr 4 16:25),
I tried out the weighted regression idea in R. I used a gaussian weight with “sd” = 10 or 20 yrs centred somewhere around 1905. I got differences all around 1.03:
Start sd=10 sd=20
1900 1.055 1.036
1905 1.037 1.022
1910 1.012 1.003
Here’s the code:
#download.file(“http://www.cru.uea.ac.uk/cru/data/temperature/crutem3vgl.txt”,”crut3.txt”)
v=matrix(scan(“crut3.txt”,0),nrow=27);
w=c(v[14,]);
n=length(w);
for(i in 1:3*5+1895){
for(y in 1:2*10){
yy=y^2*2 # y=”sd”;
x1=1:n+1849-i; # centre year 1910;
a1=lm(w~x1, weights = exp(-x1*x1/yy))$coef[1];
x1=1:n-n; # centre year 2010;
a2=lm(w~x1, weights = exp(-x1*x1/yy))$coef[1];
print(paste(c(i,y,round(a2-a1,3)),collapse=” “));
};
}
If you’re going to fit a cubic or any other function to the data then that needs to be justified, not just because it “looks good” or “fits well”
Surely in doing so, you’re accepting the climate has multi decadal variation that the climate models aren’t modelling and that in itself needs explaining?
TimTheToolMan,
No one is claiming that the temps from 1900-1970 were primarily anthropogenically forced. There is an open question how much of the temperature change from 1900 to 1970 was due to natural forcings plus anthropogenic aerosols/GHGs vs. natural variability.
Its pretty obvious from looking at the data (or the residuals from a linear OLS) that the century-period land temp record is not particularly linear.
Well, Zeke, I would like to suggest that trend lines are for finding ….um….trends.
I averaged the HadCrut3 data for the first 60 month of the period, from 1900 through 1904 and the temp anomaly was -0.40523C. Then I averaged the last 60 month of the available data and the temp anomaly was 4.09217C.
So the temperature rise since 1900 is about .81C.
Now I have been watching the HadCrut3 data for several years, and so I have a lot of old records laying around my computer. Every time I look at my old records and compare them with the new records I see that the recent data continues to be adjusted upwards. So given enough time and enough adjustments, I’m sure that Miller will eventually be right. But for now, I would say that he is way off the mark and that the 1.2C statement isn’t close to being defendable.
Re: Tilo Reber (Apr 4 18:03),
I got similar results for HADCrut3. But Zeke and Muller are talkng about land temperatures.
Tilo Reber,
A linear trend tells you the average rate of change over a period. However, if the underlying data is not linear, a linear trend is a poor measure for the cumulative change over the period.
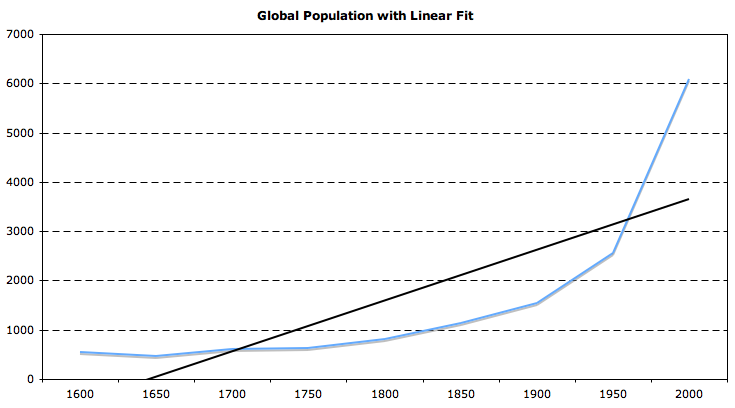
For example, if I had data showing an exponential increase (say, global population from 1600 to present), would the cumulative change be best estimated by a linear trend or a comparison of smoothed start and end points? E.g. is the change in global population between 1600 and 2000 better characterized by 4 billion or 5.5 billion?
http://i81.photobucket.com/albums/j237/hausfath/Screenshot2011-04-04at51447PM.png
Also, as Nick points out, 1.2 C refers to land temperatures, not global temps. Land has warmed quite a bit faster (unsurprisingly, given the thermal inertia of the ocean).
Zeke,
Well sure, but it may not be only due to a difference in thermal inertia. The presence of a near-continuously moisture-saturated air layer at the ocean surface could cause a significantly different cloud response to warming temperatures over the ocean compared to over land. The surface of the ocean moves and carries a huge amount heat poleward (where it is lost to space), the land does not. There can be multiple reasons why the ocean has warmed less than the land.
Zeke: “A linear trend tells you the average rate of change over a period.”
Which is why you wouldn’t use it when all you want to do is make a statement about 2 end points. When you want to make a statement about endpoint, just take enough samples to get rid of some of the noise, average them, and difference them. That makes the shape of the curve irrelevant.
Actually, the Land temperatures are not really warming faster than the Oceans, or at least, it is more complex than that.
One might say, the Land looks to be warming faster since about 1988. Crutem3 versus HadSST2 back to 1880.
http://img508.imageshack.us/img508/9137/hadcrut3landoceancompon.png
And then how much higher was the Land versus the Ocean since 1880. Kind of an unusual pattern and it is difficult to interpret what this means.
http://img15.imageshack.us/img15/4717/hadcrut3crutemp3overhad.png
I’m only willing to put 1.0C of warming since 1900 on the Land temperatures and one should also note the numbers are extremely variable, something the annual averages or a 13 month moving average does not show (but the below chart does). We could see a rapid cooling on Land next week (and this has happened in the last several months with Crutem3 falling to about +0.2C).
http://img863.imageshack.us/img863/424/hadcrut3crutem3componen.png
Zeke: “Also, as Nick points out, 1.2 C refers to land temperatures, not global temps.”
Yeah, I guess Muller would want to forget that the earth has much more of its surface covered by water than by land – especially when trying to make as alarmist a point as possible.
In any case, using the first 60 month of Crutemp3 from 1900 through 1904 and using the last 60 month available, the difference in land temperature is .97C.
SteveF: “There can be multiple reasons why the ocean has warmed less than the land.”
Among them that there are few cities and airport tarmacs where one can place temperature stations.
Bill: “One might say, the Land looks to be warming faster since about 1988.”
Ever wonder why almost all the proxy data can’t keep up with the great soaring increases of the instrument record in recent years, Bill?
Tilo Reber,
Well, BEST is starting with land. Once they finish that they will move over to oceans.
I’d argue the a > 60 month period is best, since ENSO and solar cycles will still show up strongly in a 60 month period.
Zeke, you mention BEST doing ocean temperature analysis after land. The last I heard, they weren’t sure if they’d be able to afford to do anything after the land analysis. Has that changed?
When comparing “land” and “ocean” series it’s important to remember how these series are constructed. The IPCC’s “ocean” series (HadSST2), for example, is based entirely on SST data that aren’t necessarily representative of surface air temperature trends, and its CRUTEM3 “land” series is based partly on surface air temperature measurements and partly on SST measurements projected into land areas (particularly in the Southern Hemisphere). So when you compare the two you are actually comparing SSTs with an apples-and oranges average of SSTs and surface air temperatures. Whether such a comparison means anything is questionable, particularly in the context of the Muller reconstruction, which uses only air temperatures measured at surface stations.
There are in fact no published series, or at least none that I’m aware of, that segregate surface air temperature trends in land and ocean areas. So a couple of years ago I made up my own from GISTEMP records located on islands in the ocean and in landlocked areas. There were no significant differences. Surface air temperature trends over the land and the oceans in the 20th century were effectively the same.
Zeke: “I’d argue the a > 60 month period is best, since ENSO and solar cycles will still show up strongly in a 60 month period.”
The proxy and ice core records indicate that there are many different cycles that are longer than ENSO and solar. So you can never average them all out. But if you want to use a longer average, that’s fine with me. Most likely it will give you a smaller difference, not a larger one.
“Most likely it will give you a smaller difference, not a larger one.”
No, it gives a larger one. Here are the results of the gaussian weighted means with 2, 5 (=60 mths), 10 and 20 yrs:
….sd=2. sd=5..sd=10. sd=20.
1900 0.728 0.930 1.055 1.036
1905 0.858 0.930 1.037 1.022
1910 0.838 0.916 1.012 1.003
The reason is the recent end. Short terms overweight the cool spell around 2008.
Tsonis et al (2007) and subsequent publications suggest that none of the above is right. Modeling multidecadal cycles as coupled anharmonic oscillators indicates that synchronization effects created three shifts during the 20th century (up, down, up, then maybe down c. 2000), which might be superimposed on human and other natural forcings.
BTW the WSJ gets into the red noise business here http://online.wsj.com/article/SB10001424052748704615504576171863463697564.html?mod=googlenews_wsj
Though ocean surface temperatures may be more pertinent than land ones because of the greater heat content, the reliability and adjustments of the sea data are fraught with even more problems than those on the land. I suspect that whoever cracks those difficulties, there will be reasons for skepticism of the results on many sides of the debate.
We’ll probably end up only trusting ARGO like data for Ocean Heat Content, and satellite data for atmospheric temperatures and radiation data. For data earlier than such instruments can give, we are just guessing.
======================
Nick Stokes: “Short terms overweight the cool spell around 2008.”
Why would you use guassian weighting. If the idea is to average out variability, how does the guassian weighting help?
I’m not sure what you are doing. A 20 year average should pick up pre 1998 years. Those were cooler years and therefore they should minimize the difference.
Looking at a HadCrut3 chart I see that there was a temp dip from 1900 to 1910. Isn’t 30 years suppose to be the magical transition from “weather” to “climate”? Try 30 just for curiosity.
But in any case think about the general idea that I refered to rather than specific dips or rises. Think an even slope from 1900 to 2010. On such a slope an average from 1900 to 1904 will be more negative than an average from 1900 to 1909. And that will be more negative than an average from 1900 to 1919. An average from 2006 to 2010 will be more positive than an average from 2001 to 2010, etc.
Dave,
A lot of past comments made by Muller are “not promising.” Also, it must be said — I don’t how many people actually watched the whole hearing — but I didn’t find the testimony of the lawyer or the economist to be particularly fact based, nor was Pat Michaels testimony a few months ago, or Wegman in 2006 or any number of people to testify at these kangaroo hearings, where posturing is the only thing that is accomplished.
If Muller picked two points, drew a straight line between them and then made his conclusion that would be perfectly fine for a lot of people on normal days (No Warming since X! A century of warming canceled in 1 year! Blahbiddyblahbiddyblah). But it isn’t going to have much affect on the published result.
I’m particularly amused by the resemblance of the ‘thirty years for a climate trend’ meme, and the phase length of a couple of the great oceanic oscillations.
==============
What hit kangaroo
And brought him to this trial?
Twas a boomerang.
=========
Zeke:
For some of us (myself included) the warming during the early part of the 20th century is enough more uncertain, that I think quoting a temperature change that does not include an increased uncertainty range is likewise misleading. This is a question that Muller’s group may be able to address.
The century temperature trend is the jumping off point for many other experiments. In a scenario where 0.4oC seems to matter a lot isn’t it a bit worrying that somebody can justifiably says the trend is 0.7-0.8oC or 1.1-1.2oC?
Bill Illis (Comment#72767) April 4th, 2011 at 7:31 pm
It’s very easy to see what it means, the land is warming faster than the ocean.
tilo,
a “trend” line actually doesnt find the “trend” it finds a OLS fit to the data.
a trend analysis is more complicated.. that would bring us back to the unit root stuff and we dont wanna go there
Re: lucia (Apr 4 16:20), Lucia, I’m not suggesting that he should give code to congress. i’m merely pointing out that using words is a very poor way of describing this matter. It leads to all sorts of problems. especially as people try to figure out what math he did IF ANY to come up with the number. Me, I eyeball the early part of the curve ehh.. around -.4c.. goes up to .8c… err about 1.2C give er take. That’s how Id casually describe it. Ask me to do math on it, whole nuther matter. now days people should submit their congressional testimony for peer review. confressional hearing are a poor way to take science evidence. much better for generating headlines.
Re: Tilo Reber (Apr 4 23:39),
Tilo, I’ve basically been doing what you suggested. Weighted regression means you count data near the chosen (endpoint) year. Your choice of a block of years is similar, using a gate function weight. A tapered weight function means you don’t get sudden changes as a peak year goes from being included to excluded.
The “sd” that I’ve been quoting measures the half-width of the selected region.
20yr width does give (slightly) smaller difference than 10. But I’ve used regression rather than just an average of some end years to allow for any slope that is detected. Otherwise there is a bias downward as you extend the region back from present.
Zeke:
“A linear trend tells you the average rate of change over a period. ”
Actually it doesn’t. The average rate of change is a function of the period elapsed and just the end points.
Whether you are talking about averaging the differences in a discrete sequence or the differential of a continuous one, the process of forming the average cancels out the effect of all but the end points.
Should not the point of thinking people discussing a presentation, that we might find unclear, be what do we see on further analyses and less so whether the presenter was right or wrong? It is rather obvious that we can interpret the temperature data and its “shape” over the past century or so with many different conjectures.
Cohn and Lins conjectured that if we completely ignore all information but the temperature series from 1856 to 2004, we can see linear trends that are likely to occur 1 time out 14 by chance given a arfima model with LTP. We can conjecture that the curve of the series is a cubic or linear or some other regular shape. We can conjecture that the series consists of several linear trends interrupted by breakpoints (my favorite conjecture). We can conjecture that the climate models can approximate a forcing that must be considered when analyzing the observed series data.
Curve fitting without some a priors is a dangerous pursuit and thus I would guess that a climate model result would best fit the bill for having some a priors. The models do, however, give a wide array of results and present a large uncertainty when taken all together and the problem of a proper validation for a model would remain.
We also have the problem that Carrick points to when discussing the observed temperature series without the proper CIs attached – which is a problem within itself if we cannot state to which model the series belongs. We also have the measurement uncertainty due to the required infilling given the incomplete spatial and temporal coverage which I do not judge we have a good handle on for quantifying.
mosher
Yep. I think if this wasn’t contentious, lots of people would say describe what they see.
Clearly Congress isn’t going to subject itself to limiting itself to listening to ideas that passed whatever peer review might be. The notion doesn’t even make any sense for many reasons ranging from potential glitches in peer review at one end to some information being insufficiently novel to merit publication in scholarly articles. Also, insisting Congressional reps only listen to results of peer reviewed journals would prevent them from learning of uncertainties.
Does anyone really think photos from Surface Stations.org should have been off limits to Congressman’s eyes because those photo’s didn’t appear in a “peer reviewed” journal article? I doubt it. It’s nonesense.
Roger Andrews (Comment#72780) “When comparing “land†and “ocean†series it’s important to remember how these series are constructed. The IPCC’s “ocean†series (HadSST2), for example, is based entirely on SST data that aren’t necessarily representative of surface air temperature trends…”
HADSST2 is also spatially incomplete to this day, with data missing for much of the oceans south of 30S.
Once again, a linear trend — or any continuous function — is not representative of what actually happens to climate over multidecadal time scales. Sudden shifts between states, perhaps mediated by ocean cycles and/or the weakly coupled earth-sun system, are evident in the data. Only limited time periods of the order of a decade are amenable to continuoius trend analyses. We need to get away from our fascination with making complexity simple.
I think some of you posting here give congress people too much credit for their attempting to arrive at rational decisions policy-wise vis a vis scientific evidence. Most of them have made up their minds based on their ideological bents and are only looking for some post hoc rationalization. An historic temperature increase means nothing without someone attempting to attach consequences and uncertainties to it.
The major problem I have with these hearings is that the congress people are hesitant to point to the unintended consequences that can be produced by their actions and that history shows can create problems larger than those they are attempting to solve. Of course, modern retorts to unintended consequences, that include statements to the effect that it would have been even worst had not we acted puts the whole issue back to a faith based support as opposed to a rational one. Anyway I do not think that many congress people are willing to admit that as a group they are not particularly rational and often makes things worse by their actions.
For Lucia and Zeke: http://online.wsj.com/article/SB10001424052748704615504576171863463697564.html
if you use google it should allow the full article its right up your alley analysis dice etc…
Re: Kenneth Fritsch (Apr 5 09:50),
That’s one of my favorites. The other is that we didn’t do enough so we need more money and control.
How does land temperature warm more than the lower troposphere over land?
Re: lucia (Apr 5 08:25), sorry I needed a sarc font when I wrote that testifying b4 congress should have a peer review.
Tilo Reber/ Zeke
As inconvenient as this may be to some, please look at the the quote again: Muller in his congressional testimony stated that the 1.2 degree rise in LAND temperatures “is what we call global warming”.
The fact that BEST intends to look at SSTs at some later point [or at bovine methane exhaust temperatures for that matter as well] does not magically make go away the fact that Muller made that “is equal” statement in his presentation. The fact that he used 1957 as a pivotal date is both interesting [from a dat point of view] and puzzling [from a “messaging” point of view].
Meanwhile, whether you choose to slice or dice the data referred to in Muller’s statement [such as it is] side-ways on the diagonals or up-and-down, Congress and any media following the hearings have been told that the 1.2 degree rise in LAND temperatures equates to “global warming”.
This is of the same caliber as Australia’s Climate Commissioner [Dr] Tim Flannery stating in an interview last week that were Australia to cease emitting CO2 immediately and completely tomorrow [in plain English: shut down as a country/economy] the effect on global temperatures would take 1000 years [yes Josephine..] 1000 years to be measurable.
The combined AGW/ACC amalgam of NGOs and other activist organizations has [verifiable to the point where “communications specialists” are now saying that whomever funded the exercise should ask for their money back because of lack of outcome] spend upwards of USD 100 million over the past two years to convince whomever needed to be convinced in DC that AGW/ACC is a deadly menace to all of us on earth. This comes on top of USD 100 billion [yes Josephine, that too ..] of public research funds over the past 25 years to “prove” that anthropogenic CO2 is the cause of that same deadly menace.
Doing more ever more sophisticated analysis of data that is questionable to start with, and in the face of increasing uncertainties about what we actually know and understand about climate and man’s effects on it [something that -after the “science is settled”- spell broke, a growing number of qualified observers are now openly acknowledging] to the “unwashed” is [politically and socially] irrelevant.
“You can’t simply take the difference between two arbitrary points, as they may reflect the noise in the series rather than the trend.”
As an aside, that was exactly what the much celebrated “VS” proposed to do in what’s known as the unit root thread:
“Observations imply that, if the data are to be believed, the planet has warmed gisstemp(2008)-gisstemp(1881)=0.43-(-0.2)=0.63 degrees, in the period 1881-2008.”
(http://ourchangingclimate.wordpress.com/2010/03/01/global-average-temperature-increase-giss-hadcru-and-ncdc-compared/#comment-2578 )
After I wondered if I misinterpreted him, because it seemed odd for a stats person to claim this, he clarified:
“That’s indeed the best ‘estimate’ of realized warming, 1881-2008, I can think of given the data I have.”
Bart, VS followed up later with
http://ourchangingclimate.wordpress.com/2010/03/01/global-average-temperature-increase-giss-hadcru-and-ncdc-compared/#comment-2740
partially retracting that. He accepted the OLS line as OK, but it doesn’t represent a trend.
Did that discussion ever continue?
Looks like Doug Keenan is picking up the unit root flag.
For that much data, I suggest that you use a simple, robust (in the statistical sense of the term) method:
Pick the appropriate chunk of data at each end, say 10 or 20 years; calculate the average for each period; take the difference and divide by the years between the periods’ midpoints. This takes care of a lot of the serial correlation (albeit not unit roots) and avoids the problems of leverage points from standard fitting.
Presumably temperature isn’t “caused” by a pure, single variate, unit root model. At worse (statistically) there is some messy cointegrated set of variables, and in which case, the simple robust method (of Danial Suits some time in the 1950s I believe) captures a reasonable estimate of the rate of change.