Look guys! SkS’s says RSS shows no statistically significant warming since 1987! How Kewl is that?!

What a tool! Now we can all see the sort of online debunking tool can be created when the communications masters merge junior college level programming skills with Foster and Rahmstorf’s groundbreaking peer reviewed method of using one period of time to compute the trend and a different period to analyze the “weather noise” using their own personal adaptation of the “Lee and Lund” based method of estimating uncertainty intervals. To see what fun ensues, visit SkS fail to reject no-warming mining tool temperature trend calculator and fiddle with the settings until you find really long periods of “no statistically significant warming”. I used it to “discover” that “Skeptical Science” tells me the 26 year– count it 26 year— trend based on RSS is “not statistically significant” relative to the null of “no warming”.
Sadly, using GISTemp, I was only able to create “no statistically significant warming” since 1993.4. That’s not even 20 years. How sad.

I bet you want to play with the tool too! Here are my tips:
In both cases, I had to use the “advanced” tool, fiddle with the start time, leave the end time unchanged so as to avoid sucking in January’s temperature rise. But that’s just ordinary cherry picking. The real fun begins when you notice that Foster and Rahmstorf used the time honored technique called “give a plausible sounding excuse why we get to cherry pick something obscure and then do it”, and created a method that lets an analyst also cherry pick the analysis period for noise to inflate the uncertainty intervals. Go ahead and do it by using the ‘advance’ feature and finding the period that maximizes the width of the uncertainty intervals.
Happy hour is approaching. I’m counting on you all to find the longest ‘not statistically significant’ trend you can. If you’re a programmer, write a script and let her rip while you sip your Friday afternoon beer. When you are done, feel free to report these longest periods with “no statistically significant warming” to Lord Monckton. Tell him “Railroad Engineer Pachauri” admitted something about these trends. Or get creative — maybe just tell the truth. You got them from Skeptical Science’s web site.
Happy hunting!
Actually the correct terminology would be something closer to “lower troposphere temperature trend not statistically distinguishable from zero or from +0.323°C per decade at a 95% confidence level in RSS since 1987.” I’m a bit surprised you use such sloppy language. If I didn’t know any better, I’d think you were trying to excite the climate denialists based on nothing other than surface air and lower troposphere temperature data being noisy.
Sober up, ma’am.
You’ll feel better in the morning.
At least correct the typos.
.
Honestly, this whole post sounds like happy hour is just finished. 🙂
.
I was under the impression that F&R use the entire period to compute the autocorrelations?
toto
Entire period? Your impression is incorrect.
Toby,
You don’t like “Kewl?”
Seems like childish fun. Way to go!
“Happy hour is approaching.”
Why should anyone be happy for just an hour?
(A tip in preparation for St. Patrick’s Day.)
With the triangles you can see at a glance. Just look down the right axis, and click on it if you want the numbers. It’s 20 years for RSS by Quenouille, and June ’97 for GISS.
So, your complaint (or your excitement, can’t tell which) is over being able to add the maximum noise to the data and get long trends that are not statistically significant? Really?
Lucia, wow!. And you are telling me that I am all worked up. Have that beer analyzed.
I used the last 180,000 years as my ‘noise’ and find that things have been pretty flat for the last 800,000 years; just a few blips, but nothing much going on.
robhon,
Complaint? Excitement?
Try amusement. 🙂
Bob,
You are worked up.
Nick Stokes (Comment #110808)
March 1st, 2013 at 6:52 pm
—————————————-
Pretty cool.
Dear Lucia,
I like the term “Kewl” very well. My daughter would say, “it’s AWESOME!”
And this post is hilarious. Skewers the blowhards on both extremes of the debate in exemplary fashion.
I never fail to check your blog daily, for entertainment and enlightenment.
Best Regards,
Dale McIntyre
Bob is still worked up.
It is always five o’clock somewhere. Cheers!
Carrick (Comment #110822)
March 1st, 2013 at 10:06 pm
“Bob is still worked up.”
Carrick, are you a juvenile? If having to witness someone use an electron microscope to detect “warming” over the past decade and a half gets one worked up, so be it.
Hilarious. Something to do with being hoist by one’s own petard retard.
Hilarious. Something to do with being hoist by one’s own
petardretard.Dana–
Actually, if you are going to get nit-picky, you show ±2 sigma confidence intervals, not ±95% intervals. To get the ±95%, you have to look up the ‘t’ for the number of degrees of freedom. 🙂
Did you know your tool is the one that got mined create Monckton’s claim of 23 years of no warming on RSS? I’m pretty sure that’s what happened.
Here’s the trail as far as I can tell.
In http://wattsupwiththat.com/2013/02/22/ipcc-railroad-engineer-pachauri-acknowledges-no-warming-for-17-years/ Monckton than writes:
Werner writes
http://wattsupwiththat.com/2013/02/10/has-global-warming-stalled/
I figure if someone is going to use your mining tool with it’s ridiculous method of getting confidence intervals they should at least use the “advanced” features and get 26 years for RSS and so on.
Monckton and Mann have more in common than either might care to acknowledge — indifference to the Bonferroni correction, and suchlike.
Dana,
So you would support Monckton in saying no statistically significant warming in recent years?
AMac,
More “and suchlike” which you might enjoy:
http://coast.hzg.de/staff/zorita/ABSTRACTS/buerger_comment_and_response.pdf
Climate science has more Mexican hats than Acapulco.
IMO the rise in global ATMOSPHERIC temperature has slowed down, perhaps even paused, in recent years, but GLOBAL WARMING continues unabated (http://www.skepticalscience.com/graphics.php?g=65), until the data says otherwise.
Paul_K (Comment #110834)
Interesting how after Burger presents his arguments, Zorita has to carefully account for his methods and rationale. That is all good and should occur more often – and particularly so in climate science.
Dana
Man that has to hurt. The monktopus uses your tool to squirt ink and lucia points out the problem with your tool and you accuse her of exciting denialists.
Personally, I think it excites them more when you guys step on your own privates.
You might consider learning something. There is still time. The planet is worth saving you know. That would argue for better tools and better methods, not the crap you used, which evidence shows, got used against the cause to save the planet.
Stop handing the denialists ammunition and blaming your friends when they point it out. Sheesh.
Thank you, Lucia. Funnier than the Sunday comics. Dilberted themselves, they did.
Paul_K – Monckton is an ignoramus who equates the surface air/lower troposphere temperature trend not quite being statistically significant at the two sigma level with “no global warming”. That’s wrong on so many levels it boggles the mind, the most important of which being that atmospheric warming represents only about 2% of global warming.
http://skepticalscience.com/australian-pachauri-global-warming.html
As not infrequently occurs, I’m in agreement with Kenneth Fritsch’s observation (#110838).
Burger perceives two problems with Zorita’s statistics — the Mexican hat fallacy and the prosecutor fallacy (BTW, here is a snap of said fallacious Mexican hat). To my unschooled eye, it appears that Zorita’s defense against the first is incompatible with his defense against the second.
Burger:
Zorita, Stocker, and von Storch respond to this Mexican Hat charge (emphasis added):
And later, ZSS rebut the Prosecutor fallacy criticism (again, emphasis added):
Speaking of having your cake and eating it, too, the cited Arrhenius reference is titled, “On the influence of carbonic acid in the air upon the temperature on
the ground.” That’s its formal title.
The Burger/ZSS exchange is a nice endnote to SteveF’s recent guest post on the possible contributions of pseudocyclical phenomena to the temperature record — if an endnote can precede a discussion by a few years, that is 😉
AMac we can now, using genechip technology, read the levels of expression of all the genes in a tissue. The amount of data you get comparing ‘normal’ and cancerous tissue is huge. The biostatisticians are still working out a rigorous way to get rid of false positives/negatives; our big problem is that comparing your liver and brain shows a huge difference and comparing your liver and my liver shows a huge difference.
The controls are the tricky part.
“Actually, if you are going to get nit-picky, you show ±2 sigma confidence intervals, not ±95% intervals. To get the ±95%, you have to look up the ‘t’ for the number of degrees of freedom. :)” – Lucia
Hahahaha! Dana: when you find yourself in a hole, stop digging.
This is hilarious.
Paul_K, Amac, Kenneth:
.
The first part of this comment seems to misunderstand the original paper. IIUC, the authors were saying that the recent warming is unlikely to emerge from a certain class of stochastic processes, which they confirm with extensive monte-carlo simulations. There is no Mexican-hat about this. The (synthetic) record used to assert “unlikeliness” is independent from the (natural) record in which the event was observed.
.
The second argument sounds like Bayesian trolling. He’s suggesting that p-values “say nothing” about whether you should accept or reject H0 over H1 – which is obviously true, if you allow your priors to vary arbitrarily.
.
I think most people here do agree that p-values are useful.
.
IIUC the comment was not published.
Kenneth Fritsch – Agreed.
AMac – Great photo!
Toto,
I would accept that Eduardo (Zorita) proved that the observations were not compatible with his own defined prior. Did he prove anything else in your mind? (Not a rhetorical question.)
Still, full marks to him for making a very serious attempt to respond directly to the criticisms.
Scooter schooled 🙂
Hey Scoots, did Cookie ever show you my escalator, the email exchange did amuse me
toto (Comment #110853)
> The first part of [Burger’s] comment seems to misunderstand the original paper.
My sense from their rebuttal was that Zorita, Stocker, and von Storch did not feel that way. Rather, they responded substantively to a substantive disagreement.
> IIUC, the authors were saying that the recent warming is unlikely to emerge from a certain class of stochastic processes, which they
confirmcharacterize with extensive monte-carlo simulations.Agreed (with word-change). This is the second point that ZSS raise in response to Burger’s Mexican-hat charge.
> There is no Mexican-hat about this. The (synthetic) record used to assert “unlikeliness†is independent from the (natural) record in which the event was observed.
As best I can tell, it is not entirely independent: “[Our models] contain just one free parameter. We then derive the probability distribution of the test statistics conditional on the underlying stochastic process, the parameters of which are indeed derived from the observational record.”
Still, this ZSS argument seems strong.
As I noted (#110845) , the first of ZSS’ two defenses to the ‘Mexican hat’ charge takes a very different approach. The authors claim that relevant hypothesis formation greatly preceded data collection and analysis. Namely, “the rise in global temperatures and from this, the clustering of warmest years at the end of the observation record, was already predicted more than 100 years ago [Arrhenius,1896]. Our ’Mexican hat’ is therefore placed not in a random position in the desert but in the place predicted by a physically-based theory.”
This is fair enough, and few of the numerate regulars here will choose to tilt against Arrhenius and RTEs.
In that comment, I went on to note that ZSS go on to claim that they are not making any claims about the non-stochastic factors that may be influencing the climate record. “CO2? Who mentioned CO2?”
Even if not amused, perhaps you see the have-and-eat-cake aspects to this set of defenses.
RE: Owen (Comment #110837)
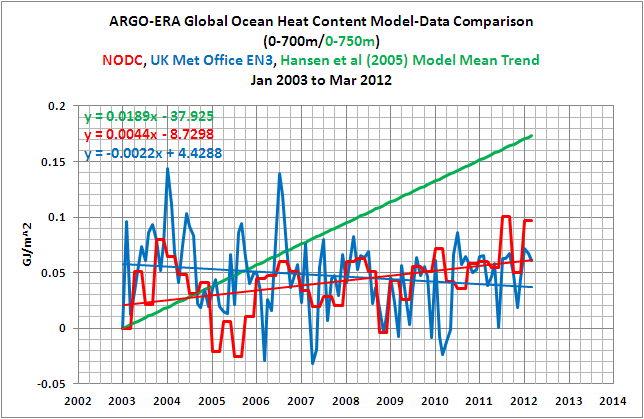
“IMO the rise in global ATMOSPHERIC temperature has slowed down, perhaps even paused, in recent years, but GLOBAL WARMING continues unabated (http://www.skepticalscience.com/graphics.php?g=65), until the data says otherwise.”
***************************************************************************
But of course Owen, the high resolution OH data from the UK Met Office and NODC does say otherwise:
http://bobtisdale.files.wordpress.com/2012/05/figure-7.png
Knowing what we now know about the error bars surrounding OHC 700-2000m renders that SKS chart rather useless.
Scott Basinger (Comment #110850)
In fairness to Dana, I think he was making a point similar to one SteveF made on the “Monckton” post which is that given these error bars, the trend could also be very large.
I’m not sure whether Dana “got” that I was focusing of the “no statistical significance” because of the more recent post about Monckton. Given what was in my mind, I wasn’t going to worry about the most proper wording for the result because… well… [rhetorical] Did Monckton mention that the mean trend is positive and the upper range of the uncertainty interval is very high?[/rhetorical] (Answer: No. 🙂 )
Oh oh Lucia! You’ve insulted the mad Monck. Prepare for the threat of a law suit.
John Brookes–
I criticize Monckton frequently. So far, he hasn’t threatened to sue me.
Mosher/Dana,
The “D” word will put comments in the spam bin. There are other words that act similarly; there is an “I” word and so on. I release them when I see them. You can get around the spam filter by using d*nialists or something like that. But moderating those reduces food fights.
Oddly enough *I* can include the full word in comments if I have logged in!
For the record, I’m not a d*nialist (though the self-righteous Dana Nuccitelli would be quick to call me that) nor am I excited, but I am amused. Lucia nailed it, Mosher is spot on with his criticism.
Thanks to Lucia for planting the seed that grew from a chuckle to a ROFL.
I did get excited when your SkS boss John Cook chickened out of the 2013 Bloggies though, hilarity ensures.
http://tallbloke.files.wordpress.com/2013/02/ts-finals.png
What is this I word? Idiot?
Ignorant?
The abbreviated list is:
Soros
twat
deniers
denialists
wittless
All have been observed to cause food fights. Words are periodically added or subtracted to minimize the amount of ‘mystery moderation’ vs. avoiding food fights. I guess I removed “idiot”? Or it’s on some other list… I better look through all the moderation options. I’m pretty sure idiot gets you moderated.
So, for example “alarmist” has sometimes been on the list, but it is my observation that we don’t get 30 comment long discussions of the meaning and implications of “alarmist” when it gets used. So, including it is not worth a number of ‘mystery moderation’ episodes. Soros can probably come off now. . .
I’m not sure why Anthony was moderated.
Steve Mosher, the person you think is FOIA, can you find his birthday? I believe this date is to be found in the releases.
Idiot was sent to moderation, while ignorant was not. Showed up faster than I expected. Really thought I was missing a climate word like evolution or something.
MikeN–
Now I’m wondering which plugin does that because it’s not on the “Discussion” “settings” page. Hmmm..
Mind you: moderating posts that say ‘idiot’ is find by me. But I’d like to remember which plugin does that so I can edit the list.
Stupid me… I only looked at the “blacklist” instead of the “moderation”. The short list was a blacklist. Idiot is on the moderation list. So are a whole bunch of disposable addresses, some people who are moderated and so on.
I almost missed this thread. Had a break from spring planting and I looked for amusement and found it. Are “Willis” or “shirker” moderation words here, lucia? They are on WUWT 🙂
I think I am only being borderline rhetorical, but the answer is obviously no. This comment did not go into moderation. Perhaps my subsequent comments will, if I come back 🙂
Don —
Those words are not on the list. I keep the list as short as practical. Those words would end up on the list if the triggered a few “food fights”. “Food fights” involve quite a bit of back and forth.
Spring planting? I’m jealous. We finally got snow and I can’t see even a patch of green!
Now some, not Eli to be sure, might note that there is about one value of the possible autocorrelation period end point that makes this blather possible and it makes no sense to use it.
What does that tell you about the cherry picker in the back yard?
And Willard Tony, Eli recommends that you not go strutting about how others are chicken.
Is adding confusion to the discussion really something to aim for?
LOL @ Watts, blind to his own D’ism – who’d thunk!
Now some, not AMac to be sure, might note that
.
What does that tell you about
I thought maybe the banned word was iris.
MikeN–
I admit that I prefer lillies to irises. Nevertheless, no flowers are banned.
The secret word is clock
This is off-topic, but we may have another example of Skeptical Science shooting itself in its foot. If you look at the latest post on Michael Mann’s Facebook page, you’ll see him repeatedly claim Steve McIntyre is saying there’s a conspiracy in his latest post. Both Dana Nuccitelli and John Cook commented in support of it, and both have also tweeted it. John Cook even said:
Remembering John Cook, proprietor of Skeptical Science, has claimed this post of McIntyre’s is shows the same conspiracy ideation he (and co-author Stephan Lewandowsky) have been seeing in skeptics all along, consider this:
Steve McIntyre’s post didn’t discuss anything resembling a conspiracy theory. He said Michael Mann did things. He referred to the IPCC and AGU in the post, but he did not say they had any involvement with what Mann did. In fact, the only person (or group) he referred to as having done anything other than Michael Mann was Naomi Oreskes, who he says “appears to have [been] wrongfooted.”
McIntyre blamed everything on Mann. Mann responded by saying McIntyre “chose to invent an entire conspiracy theory involving not just [Mann], but multiple scientists, the AGU, IPCC, etc.” Skeptical science founder (and another member of its team) supported this, saying it is the same conspiratorial ideation they have been seeing in skeptics all along.
If that post is an example of what they’ve been seeing all along…
Rabbette,
Do you ever slip into the first person, when you are in the privacy of your home? That male contestant makes a great straight man. Like Mosher.
I know, lucia. I was just having a little fun with Anthony. Our lilies seem to be blooming every few months, or maybe it’s just twice a year. You need to get out of that snow.
Brandon,
Doesn’t Mann use the royal we? Whatever he does is a conspiracy.
Don, Eli does enjoy annoying the right people:)
The secret word is: Myxomatosis.
Brandon, the title of the post contains “SkS”, and deals with the SkS brand of reality challenged, so not totally off topic.
Short version, Mann plots land+ocean projections against land-only data, truncating the land-only data series at 2005. Documentable as in “that’s what he did” and documentable in the sense of “no, that’s not the consensus way of plotting the data”.
Simply noticing this doesn’t make you a conspiracy nut.
Roy Spencer has posted Febs temps:
UAH Global Temperature Update for February, 2013: +0.18 deg. C
Rabbette,
My guess is most people find your third person affectation amusing. You are probably annoying for other reasons. Check yourself.
.
Actually he uses the “global estimate from land stations alone”, which IIUC is the same type of index that Hansen used in his graphs (?)
.
That, and the fact that Mann uses the figure from his 2008 book unmodified, is the basis for McIntyre’s not-at-all-conspirational diatribe against Mann and his “mini wingman” (!) Naomi Oreskes, ending in predictable swipes at “the AGU of Oreskes, Gleick, Lewandowsky and Mann”.
.
More seriously, if we de-McI-fy the argument for a minute, there’s an interesting question there. Is it legitimate to compare Hansen’s projection with the same “extrapolated land data” index that he used, or should we instead use land+ocean estimates? I suppose that depends very much on what exactly Hansen’s graphs were intended to capture.
toto, yes, he used land-only stations to make a global estimate when there are ocean data available and more reliable global temperature estimates available and as been noted, when you compare the land-only stations, the land-only estimate gives a very misleading picture of global mean temperature.
As to this
The short answer is “use the best data available” to compare (validate) Hansen’s projection.
Let’s see if I can state this clearly (let’s step back from climate warrior mode if we can and think more generically about the process): If you construct a model that is supposed to represent physical reality, you don’t tune it to fit the original, more limited, data set that were used to construct and test (verify) the model. The purpose of the testing/verification process is to yield a model that is capable of reliably forecasting real temperature (in this case). Tuning inevitably yields a model tuned to noise as well as signal, and should be avoided. I am pretty sure James Hansen knows all of this.
In this case, Hansen constructed a model that was supposed to forecast future temperature rise, based upon a set of scenarios. He used the best available global mean temperature data available to him at that time to test/verify his model’s performance.
But the point is, his model is supposed to give a projection of global mean temperature, not a projection of a particular index of it. Nor is it credible to try and argue that even if he had set out to give a projection of that index, that he could reasonably have done so, given the limitations of his model.
Since then, the data have improved, and we find that the temperature data he used are “running too hot.” What that means is Hansen validated his model using a flawed dataset, and if he had had better data available to him at the time, he might would have concluded his model was invalid.
This all said, I don’t actually find it very interesting what Hansen’s 1988 paper says about current temperatures. I’m not sure what the point even is, other than we didn’t know as much about climate in 1988 than now.
(I do enjoy to an extent watching people tie themselves up in knots either trying to defend an out-of-date paper, or attacking it as if the inevitability of the fact it will fail against real-world data says anything meaningful about the current state of climate science.)
Nick pointed to Hansen’s version of this graphic on the CA thread.
Personally I think that settles the question of what the original author thinks was the correct approach.
That said, I think Hansen’s gray shaded area needs to be about a factor of 4 wider (0.5°C variation… really??? Even SkS’s own graphic suggests more like ±0.5°C over the last 2000 years. Longer term reconstructions have a variation of roughly ±1°C. If you compute the RMS average over 1000 years, you might get it down to ±0.5°C, but clearly that’s not a fair test when comparing to monthly averages.)
toto (#110907) –
The caption for “Hansen’s graph” — I presume you’re talking about figure 3 of Hansen et al. 1988 — is “Annual-mean global average surface air temperature computed for Scenarios A, B and C.” GISS produces two global annual mean surface air temperature change indices. They contrast the more commonly used land-ocean temperature index (LOTI) with the stations-only index (dTs) used by Mann as follows (emphasis mine): “Note: LOTI provides a more realistic representation of the global mean trends than dTs below; it slightly underestimates warming or cooling trends, since the much larger heat capacity of water compared to air causes a slower and diminished reaction to changes; dTs on the other hand overestimates trends, since it disregards most of the dampening effects of the oceans that cover about two thirds of the earth’s surface.”
.
Which of course leads on to wonder why Mann chose that index of GISS’s two (and of course there is NCDC and HadCRUT4 as well, not to mention the satellite data sets).
Also, it’s a false statement that “Mann uses the figure from his 2008 book unmodified”. The version used in his talk is an animated version of that talk so it’s not the same figure. (Same data, maybe.)
The implicit notion that he just cut and paste from his book to generate that particular portion of his presentation is simply false.
HaroldW,
“and of course there is NCDC and HadCRUT4 as well, not to mention the satellite data sets”
.
Yup, and the satellite data set is the lower troposphere, not the ocean water surface temperature… that is, the lower troposphere air temperature. Like many Mann made results, this one is designed only to promote a certain POV, using doubtful methods and sharpshooting data selection (no temperature data for the last several years?!?) There is no attempt to honestly present the data along with a fair interpretation. Maybe it is not as bad as Monckton’s rubbish, but for sure in that general direction.
Sorry this is OT but appropriate topic is closed.
February UAH = 0.18c.
http://www.drroyspencer.com/2013/03/uah-global-temperature-update-for-february-2013-0-18-deg-c/
Ray (Comment #110913)
Mosher posted 7 comments about January UAH; do you care to guess how many he will post about February?
SteveF –
I can sympathise with preferring to avoid the satellite data sets for a direct comparison, as they do not claim to measure *surface* air temperature. To make a comparison, one has to adjust them, which means positing a relationship between surface and lower tropospheric temperatures. Having an additional link in the chain means that one’s confidence in the adjusted measurements will be somewhat lower than in more direct methods.
.
That said, a more straightforward approach is to present all of the metrics, not just the one cherry-picked to show the most warming and thereby matching the best.
.
I also agree fully with Carrick’s comment above (#110908) about the lack of importance of early predictions such as Hansen’s. [IIRC, SkS also defended the FAR’s 0.3K/decade projection.] An “honest broker” would say something like, “those initial models weren’t so accurate, but the newer versions are better.” Which means acknowledging that the current models may also be flawed. [Lucia’s done an excellent job of putting the case against the CMIP3 ensemble.] The fact that Mann (and others) can’t bring themselves to admit any weaknesses, even of obsolete models, speaks strongly of their tribalism.
Carrick, when responding to toto, you should keep in mind this comment he posted over on WUWT:
He apparently thinks Mann was justified in interpreting McIntyre’s post as conspiracy talk. That says a lot.
Speaking of old predictions, I was recently looking at a 1959 Scientific American article by Gilbert Plass. Plass wrote, “If fuel consumption continues to increase at the present rate, we will have sent more a trillion tons of carbon dioxide into the air by the year 2000. This should raise the earth’s average temperature 3.6 degrees.” [That’s 3.6 degrees Fahrenheit, or 2 K.] According to CDIAC, the prediction of a trillion tons of CO2 emission by 2000 was spot on. The 2K temperature rise, not so much. I’m sure that SkS can make a convincing case that Plass was right, though.
Harold,
Thanks for the link I just skimmed that! Plass had the temperature already up by 1F at 1959, so that only left 2.6F more to go – I guess we’ve seen about 1.5 of it (0.8C).
I like the figure “rising temperatures recorded at various points on the earth during the past 100 years”. These various points on the earth are in:
Iceland
Norway
Sweden
England
Scotland
Austria
HaroldW,
Thanks for the link to the Gilbert Plass article. He fooled himself into believing high sensitivity by looking at the rapid warming of the early 20th century through the late 1940’s, and concluding in the early 1950’s that all the warming was due to GHG influence. Just like Hansen and his cohorts did for the mid 1970’s to the early 2000’s. Sensitivity 3.6C (or 4.5C) per doubling? Nah; not then, not now, not ever. It’s more likely somewhere under 2C per doubling. Sorry Gilbert and Jim, history will show you had the right idea, but were fooled by assuming no significant natural variation. (Maybe more forgivable for Gilbert than for Jim… Jim had seen the cooling of the late 1940’s through ~1975 before he started ranting.)
Brandon:
Until toto comes along and admits he knows the difference between tribalism and conspiratorial behavior, I’m just going to write that one off as another American who is English challenged. 😉
BillC (#110924) –
I originally read the 3.6F as rise from when Platt wrote (1959) to the end of the century. Taking another look, I think you’re correct that it’s the total rise, which reduces what I thought was the discrepancy between his prediction and observations. The observed rise from 1960 to 2000 is about 0.5K, about a third of his prediction. (2.6F ~= 1.5K)
.
[What amused me in the article is the presentation of a closed car in the summer sun as an illustration of the greenhouse effect, as if the heat in an open car is radiated away rather than removed by convection. I wonder if Plass worked out the temperature it would require to equilibrate to ~1000 W/m2 of incoming sunshine. Still, it’s only Scientific American. And the closed car *is* an illustration of what happens in an actual greenhouse.]
Harold,
Oh….I said 0.8K, I guess that’s more like the rise from the mid-70’s low point until now (so slightly more on both ends than a 1960-2000 number)?
Anyway to the car example – yeah I saw that too and thought the same.
Harold, in 1988 there only was the surface stations only (lebdeff-Hansen) series.
The bunnies play hardball
Eli, the question isn’t whether Hansen used the best data available for verifying his model (he did), but whether one should use an obviously inadequate series to validate it 25 years later (one should). At some level it will fail validation. My question to the world is “so what?”
Also, facts check: Eddie Izzard: ‘I’m 2.8% Neanderthal’.
Eli–
I’m not sure I’d characterize that as bunnies playing hardball. The species that caught and ate rabbits survived.
Watch out or someone will turn you into hossenfeffer.
Lucia
Eli Rabett (#110932) –
“in 1988 there only was the surface stations only (lebdeff-Hansen) series.”
First, that’s not so — Hansen & Lebedeff 1987 compared their series to Jones/Wigley/Wright 1986, which I believe was a precursor to the HadCRUTx series.
Second, it doesn’t matter what was around in 1988. The model generated predictions of surface air temperature; the best comparison is the *current* best estimate of those actual values. While one could argue the merits of the various series, even GISS doesn’t think that dTs is the best estimate; they find LOTI to be superior. As there are two other major global non-satellite series — NCDC and HadCRUT4 — as well as two satellite series, it is best practice to compare to all, or at least several. Perhaps at some time in the future, there’ll be only a single index — but I bet it won’t be dTs.
.
Incidentally, lost in the shuffle here is the fact that a model’s prediction of global average surface temperature is only the first milestone of progress. We need regional accuracy as well. If you inspect Plate 2 of Hansen et al. 1988 (lower left panel – 2010’s predicted temperatures), you’ll see that it predicted hot spots in the Himalayas and Dronning Maud Land; compare to this and you’ll see that although some areas were predicted well, others weren’t. Makes me wonder if we shouldn’t be using an rms-grid-cell-difference metric instead of just comparing global average anomalies…of course, a model which doesn’t match the average well, won’t get a great score with rms either.
I had rabbits once. The dog barked at them and they died of fright.
funniest damn thing you ever saw
HaroldW:
Actually, there’s a pretty decent sized industry using EOF-based approaches these days. (Probably better for regional scale than “pixel-to-pixel” comparisons.)
Alexej Buergin
Ray (Comment #110913)
Mosher posted 7 comments about January UAH; do you care to guess how many he will post about February?
If you are going to stalk me at least get the facts right.
Claim: i posted 7 comments about Jan UAH?
1. http://rankexploits.com/musings/2013/january-temperature-leaps-to-0-51c/#comment-109666
This is about wagering what will happen IF the pause ends. Not about January UAH.
2.http://rankexploits.com/musings/2013/january-temperature-leaps-to-0-51c/#comment-109698
This is about the strategy of the pause argument. Hmm not about Jan UAH
3. http://rankexploits.com/musings/2013/january-temperature-leaps-to-0-51c/#comment-109728.
This is a comment back to tom nothing about UHA
4. http://rankexploits.com/musings/2013/january-temperature-leaps-to-0-51c/#comment-109733
This is about climategate
5 http://rankexploits.com/musings/2013/january-temperature-leaps-to-0-51c/#comment-109743
This is about the extremes argument. Nuttin about Jan UHA
6. http://rankexploits.com/musings/2013/january-temperature-leaps-to-0-51c/#comment-109754
This is about my favorite subject. me.
7. http://rankexploits.com/musings/2013/january-temperature-leaps-to-0-51c/#comment-109765
This is about hansen.
So, lets see. I count 7 comments all of them off topic. That’s 100% off topic. I think I am holding to the same pattern here.
here is a clue the monthly numbers dont mean much to me other than how people will use or mis use them in there own version of climateball. personally I can definitely see up to 10 more years of “pausing” who knows maybe 15. It wouldnt change much in my position, except to shift the odds on ECS being less than 3C.
It could cool for 30 years and all that would shift is those odds.
Bottom line GHGs warm they dont cool. Question is how much.
and bring back KY_Don, much funnier
Carrick (#110939) –
I hadn’t seen analyses of model-observation differences using EOFs, although it would seem logical for more than one reason.
Regarding the Plass article, the numbers quoted for temperature rise almost certainly relate to equilibrium states. I don’t think there was much discussion about transient climate changes until the 1980s. That is, the 3.6ºF warming relates to a theoretical equilibrium state achieved after concentrations have increased inline with human emissions until 2000 when they are held constant.
Reverse-engineering this warming prediction against the quoted doubled (halved to be more precise) CO2 sensitivity of 6.9ºF suggests his assumed 2000 CO2 concentration was a little over 400ppm, which is 30 too high.
By comparison with present day GCMs, even high sensitivity (2.5ºC TCR, 4.5ºC ECS) models using the historical GHG-only simulation, which includes methane and CFCs in addition to CO2, don’t warm as much as 2ºC from 1850 to 2005.
IIRC though, there was an element of greenhouse effect physics which Plass got wrong. Something to do with confusion over TOA and surface forcing I think. Not sure if it affects these figures. Ah, here’s a link.
Carrick,
What is a typical functional form for the EOFs? Is that even a legitimate question to ask?
From Steve Mosher: “here is a clue the monthly numbers dont mean much to me other than how people will use or mis use them in there own version of climateball. ”
Climateball! What a perfect summary of the game, I guess the rules are similar to Calvin’s as well.
HaroldW, you can find plenty of hits if you type “empirical orthogonal function climate”. This was pointed out to me (on his blog) by James Annan.
BillC, I guess what you’d naively expect (for once):
The first mode (if you don’t detrend of course) is the global warming signal, then second is ENSO, then other major oscillations (AMO, etc). If I get a chance, I’ll see if I can dig up some references (if you find some interesting ones maybe you could link them too).
Carrick (#110952) –
Yes, plenty of hits for EOFs in climate, but none which I could see being used as a metric for comparing climate models vs. observation.
BillC –
What little I know of EOFs in respect to climate, comes from a “Primer” by Hannachi (here) and a two-part article by North et al. (Part I, Part II).
HaroldW, here’s one… You should be able to use it to mine for others.
Stevie, you should drop that KY thing. When subjects respond to me calling them silly names by attempting to retaliate, I know I have their minds under my control. Say hi to your friend Cowboy Willis for me 🙂 Thanks for thinking of me, Stevie.
Carrick (#110960) –
Thanks for the reference. I’ll read that later, and see what connections it brings.
“Paul S
Regarding the Plass article, the numbers quoted for temperature rise almost certainly relate to equilibrium states.”
“Temperature” in this case is the average of (Tmax+Tmin)/2 from a number of stations, averaged temporally and chronologically.
This ‘Temperature’ isn’t a measurement of thermal energy in the system. Moreover, as this ‘Temperature’ is never found on any location on the planet for anything more than for a fraction of the time, it isn’t an equilibrium.
Equilibrium states and temperature have real thermodynamic meanings; (Tmax+Tmin)/2 isn’t temperature.
What dreck.
hossenfeffer.
Is that the stuff they put into IKEA meatballs?
Pretty sure that’s made from people.
Bring Me Some Hossenfeffer! One of the best Bugs Bunny skits ever!
Shiska Bugs
To draw my earlier comment closer to relevance, I’d like to point out I posted a comment to Skeptical Science’s recent discussion of the paper Cook referred to. It should be interesting to see if I get any responses, including ones of moderation. I can’t see anything in the comment that could merit moderation, but here’s a screenshot just in case.
Edit: Well, I got a quick response from a moderator, and it is one I can’t take issue with. I take that as a good sign.
KY_Don,
Sorry, the KY is gunna stick. oxymoronic don’t you think.
No Steven, it’s just moronic. I am starting a new business, so I won’t have any more time to help you. You will have to try to straighten yourself out on your own. Don’t fight with Brandon. Has Muller paid you yet?