My sea ice bet of a summer NH ice extent of 7.4 million km2 is doing ok! (Recall, started all this; Atmoz bet 7.7 million km2; he’s still in the running too. The bet is over the number that will appear in the summer column in the table at the Cryosphere today.)
The interest in NH polar sea ice loss is highlighted by the fact that last summer’s dramatic loss motivated the creation of Arctic Observation Integration Workshops which spun off “The SEARCH Sea Ice Outlook”, an “international effort to provide an integrated, community-wide summary of the state of arctic sea ice over the 2008 summer season.” In June, Andy Revkin reported that 11 of scientific groups were predicting a 2008 ice loss as least as dramatic as the 2007 ice loss.
Of course, we amateurs were out of the gates long before the experts. Prodded by the indefatigable Atmoz, we placed our bets in April! (I think we can claim “international effort” and “community-wide” for our amateur blog prognostications. But, are we “integrated”? Hmmm.)
Anyway, it’s July, Steve McIntyre reported on the current state of sea ice. So, I think it’s a good time to post the zero-money bets we each posted in comments here last April.
The Northern Hemisphere Sea Ice bets
Remember, there was no namby-pamby “Break the last summers record” vs. “Don’t break the record” betting here. At “The Blackboard”, everyone’s bet was specific. Many of the amateurs explained their methodology.
Some of you will recall, my bet was based on the much maligned Cochrane-Orcutt. (I did this despite the fact that the lag(1) correlation in residuals was statistically insignificant for the data I fit. So, real statisticians are justified in scoffing. )
Other climate blog bettors used various different methods. Atmoz used Ordinary Least Square, Martin Ringo used ARMA (3,3) and Cassanders used a Scandinavian technique called “Bensinstasjonslokaliseringsprinsippetâ€. Some just SWAGged it; Phil took the unique approach of looking charts of sea ice in April and considering meteorological predictions for summer.
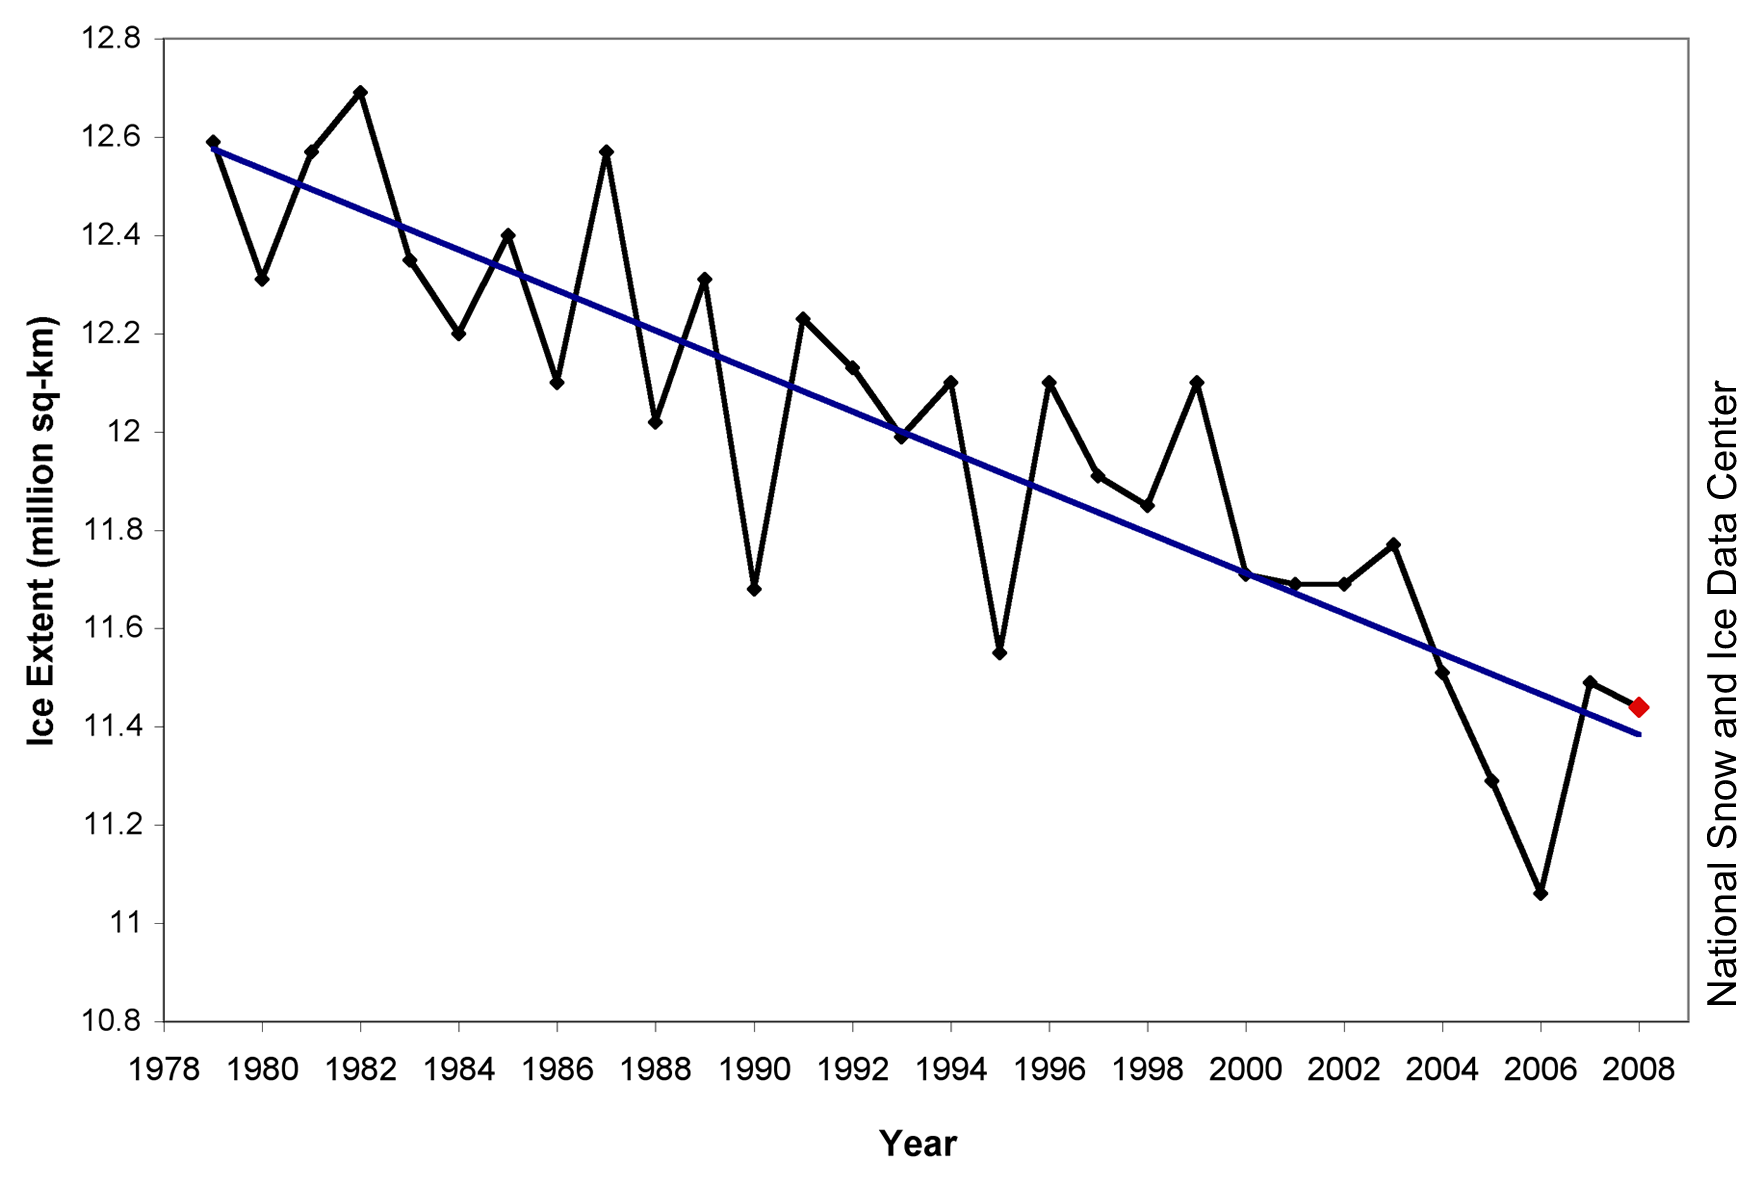
I added the individual bets to the chart showing Northern Hemisphere sea ice minima observed over time:

Figure 1: The solid blue line indicates the best-fit regression for the temperature as a function of year, not knowing the temperature for the previous year. My predicted value, shown in yellow, falls below the value predicted using the best-fit trend line due to the effect of the autocorrelation of ρ=0.11 and the summer 2007’s low value for ice extent. The dashed blue curves represent the bounds for the best-fit regression, accounting for the uncertainty in the slope and intercept. The error bars represent the ±95% bounds for the ice extent, which I added to the uncertainty in the best fit regression.
Because the bets levels were clustered just below the predictions based on ordinary least squares, I’m adding a bar chart illustrating each bet.
 Click for larger.
Figure 2: Bets placed by each blogger or commenter are shown. No one has lost yet!
How is the ice melt going?
Steve McIntyre suggests ice loss is not likely to exceed last summers. Here’s a graph for the melt area as a function of time, comparing this year’s melt to the average melt area, and to 2008:
Figure 3: From Climate Audit comment 28.
His argument is the melt rate is about normal. So, unless the winds pick up and push the ice into warmer waters as it did last year, those who placed the ultra low bets are unlikely to win this bet with its valuable prize: bragging rights and chance to explain the wisdom of their method of betting.
Those who prefer to get information about ice melt from the National Snow and Ice Data Center might want to read their May report Arctic sea ice forecasts point to lower-than-average season ahead, their June 3 report Arctic sea ice still on track for extreme melt and the later July 2 report which says Melt onset earlier than normal
The July report shows a chart showing the sea ice extent is close to the level seen last June, but higher than in 2006, 2005 & 2004:
Those of us who used various forms of linear regression are probably feeling fairly confident about our bets at this point. The ice extent is likely to be lower than normal (as defined by the historical average), but it doesn’t seem to be on track for “extreme” as predicted by the NSIDC June.
That said: The uncertainty in the regressions is large– we knew that when we placed our best. Also, we know an ice pushing wind could pick up at any time blow the NH ice and our bets out of the water!
Time to blogviate!
We all know what’s at stake here: Bragging rights.
Bets are in. The horserace is on. The horses are out of the gates but the finish line is several months off. It’s time to debate the important questions:
Will the average amateur beat the experts? Will the North Pole be clear of ice this summer? Are you worried about Santa and his elves?
I’m sure you have an opinion. Share it. Because whatever it might be, ‘Enquiring minds want to know!’
I forget what I bet, if I did at all.
I’m thinking it’ll be between the moshpit and Boris. I have no statistical reason as to why. Call it a SWAG!
I think no matter what happens, the results will be declared consistent with the SEARCH proclamations.
John Goetz– It looks like they post a new outlook every month. If they permit themselves to predict the summer ice extent in August, they’re almost certain to be right!
I don’t know if they made a firm prediction in April or at worst early May when we were predicting. I did find this:
It appears they used last year’s ice extent, and then applied the ice survival rates from 25 years. The maximum ice predicted that way was 4.5 km^2.
They must be using a different data set compared to the one Atmoz chose, because they say the ice minimum was 4.13 km^2 That’s different from the file Atmoz selected as the basis for betting.
Imagine Santa in a house boat at the north Pole. It cant happen. elves in cigar boats, jetskis instead of reinders. hehe cool idea for a scare the kids global warming cartoon
Yeah… but Santa lives in Finland. I know because a Finn told me so. In El Salvador, the infant baby Jesus brought our presents. I know because my parents and neighbors told me so! 🙂
But I think American children don’t learn the truth about Santa. So, they will be frightened when they learn the ice has melted out from under Santa’s house. If all the ice melts, we’ll need to start an elementary school education campaign called “The Truth about Santa”.
Jetskis? In the version I’m producing things are a bit more grim. I won’t go into too much detail, but do you know any elves who can swim? Even if they could, a swimming elf must look an awful lot like a seal to a starving polar bear.
That is odd.. Take a look at the black line on the graph of the NH ice melt shows, showing the 2002-2008 average. Am I mistaken or do I see that it has a clearly higher melt rate on day 0 then it has on day 365? How can that be? Hangover from the newyears party?
I have a question regarding the “old ice – new ice” issue. (I made an formal inquiry to a NOAA ice-webpage without getting any answer).
I acknowledge that “thin ice” (AKA 1. year’s ice) is more vulnerable to wind/wave actions, and therefore likely to be more susceptible to disintegration and melt.
However, in the polar seas, wind and currents are moving/redistributing ice, and shuffles multiple layers into pack-ice (“Skrugard” in Nansen verbiage). it has been a nuisance to polar explorers, and as it has considerable height, it must neseccarily also be thick.
I have not seen any information on eventual differences between “pack ice” and “old ice” on the web-pages describing ice thickness. If I recall, some of the measuremet are made by radar.
Anyone with informations out there?
Cassanders
In Cod we trust
lucia if I recall correctly Atmoz picked the summer extent (JAS) rather than the absolute minimum.
Phil–
Yes. Atmoz picked the JAS summer ice extent. So, it’s the season with the minimum, but he didn’t pick the absolute minimum. That makes a difference when comparing to other people’s bets. But, the analysis of whether we’ll break either record is similar.
Cassanders– I don’t know!
hehe Boris I like the way you think.
Maybe we could get Kevin Cosner to star in it. A mix between Waterworld and Rudolph the Red Nosed reindeer
or the polar express. santa on waterskis being pulled by reindeer driving jetskis, while drwning elves get eaten by polar bears.
oh and Mrs Claus in a string bikini, played by Pamala Anderson.
See what happens when the Elves start using nuclear plants to power the toy shops and heat the buildings?? The waste heat has to go somewhere!!!
Over at RealClimate I made a real money bet of 50 Euros that the Arctic sea ice minima will be over 4.01 this season – think I’m going to win that? I thought all the talk of “tipping points” over there was probably alarmist, making this a good bet, but I now understand that the hugely anomalous 2007 minima makes it hard to return to the normal slightly downward trend within a year. Yet I think I still have a good shot?
Joseph–
Does your bet include precise specification of the metric and reporting agency?
Some people are betting on any and all of the following, each of which is different:
a) The JulyAugustSept sea ice exetent as reported at the Cryosphere. (That’s what we are discussing here. It’s an average, and likely to be the highest number.
b) The actual minimum summer ice extent. The minimum will happen in September, and will be lower than the average of JulyAugustSept.
c) the sea ice area minimum. This is smaller than the ice extent, because if there are whiles, they subtract that area out.
So… whether 4.0 is a safe bet or not depends on whether your bet is (a), (b) or (c). Go back and check the metric. If the metric is not specified, you will have a lot of arguing at the end of the summer.
Lucia – thanks for another lesson in Arctic sea iceiness. We agreed to use the data on the chart from “Cryosphere Today” but I’m not sure if that is b or c.
The 4.01 came from the record prior to the 2007 record which was from 2005 I think?
Is there a daily measure of b or c available online?
Lucia FYI here are the conditions of my bet with Nick Barnes over at RealClimate, as outlined by Nick over there:
The 1979-2000 average minimum is a little over 5 million square kilometres. 2005 was a record low of 4.01 million square kilometres; 2006 was not quite so low; 2007 was around 3 million square kilometres. I propose a cut-off number of 4.01 million square kilometres: the 2005 number. That is, I’ll put money on the 2008 minimum being lower than any previous record except 2007.
If Cryosphere Today reports a 2008 minimum area of more than 4.01 million square kilometres, I’ll pay you 50 euros. If Cryosphere Today reports a 2008 minimum area of less than 4.01 million square kilometres, you’ll pay me 50 euros.
Joseph….
Your bet is confused.
It uses the word area which is smaller than extent. Then your bet says the minimum area last year was just above 5 million square km.
The minimum ice area last year was just above 3 square kilometers. This corresponds to (c) above. You can see the graph here: http://arctic.atmos.uiuc.edu/cryosphere/IMAGES/current.area.jpg
I can’t read the graph very well, but a bet of 4 for the minimum area is risky! But, if you were looking for a 50%, 50% chance of winning, maybe 4 is fair.
The JAS extent was above 5 million square kilometers. That’s here:

http://arctic.atmos.uiuc.edu/cryosphere/IMAGES/seasonal.extent.1900-2007.jpg
If you’d bet 4 million square kilometers for the JAS ice extent you’d have a very good chance of winning!
On this blog, we have been betting on the JAS ice extent. So be careful with your bets out there!
Thx Lucia, but Nick did note that 2007 was about 3 million sq km so I think we both agreed on the measure of (c) and therefore I’ll just have to keep my fingers crossed.
Unfortunately I now realize that I failed in my quest to find some bettable measure of “tipping points”. There is so much talk about those even though I’d argue the tipping point stuff is mostly an unreasonably alarmist way to view the data, which tends to show a very small, gradual warming trend and suggests no global tipping points are near.
The whole idea of my bet was to find a point which seemed about 50/50. I originally proposed it to Jim Cripwell, who was posturing about sea ice bets. However, Jim refused to take up a wager for actual money. Then Joeduck stepped in. At the time, when last winter’s freeze was setting in and the anomaly was predictably heading back towards zero, a number of people on the sceptical fringe at RC were arguing that the 2007 melt was a total freak event, and that 2008 would see numbers in line with the long-term average. My view was that the 2007 minimum might well have been a one-off but there was a clear downwards trend, and that even if the 2007 weather conditions were not repeated in 2008 the shortage of multi-year ice would be bound to show up in the 2008 numbers.
So I picked a cut-off which I hoped would be appealing both to myself and to a sceptic: that the 2008 minimum area would be lower than any year before 2007 (the 2005 record was 4.01 Mkm^2). My actual expectation then was maybe 3.75 Mkm^2.
The current numbers suggest a minimum area of around 3.7 Mkm^2. The current maps suggest it might be much worse than that, as the zone between the Beaufort Sea and the pole looks ripe to melt out completely.
I am also on the low side of a £10 bet with Stoat, that 2008’s CT minimum area will be less than 2007’s. I very much hope to lose that one.
Oh, and I see that Joe proposed a repeat of our 2008 bet for 2009. I’m sorry not to have seen that at the time (blog threads are a singularly useless medium for having a conversation). I’m certainly interested in that, if Joe is still ready to bet. Maybe we could make it a sliding scale, as I suggested to Jim Cripwell:
Nick– If you were going for 50%-50%, you might have found a decent dividing line. Someone would need to do some statistical modeling to try to estimate what they think is the 50-50 dividing line for ice area, but just eyeballing, you can’t be ridiculously far off.
OTOH, had you bet using a different definition for the amount of ice, you might have been sucked into a bad bet!
Nick– You guy who do the real money bets must enjoy betting more than I do!
Nick glad you are checking in over here – my email FYI is jhunkins@gmail.com
You are now estimating 3.70 on what basis – are you extending the current line forward to a date in mid August?
I based that on my perception that the area anomaly line had settled down at around -1.3 Mkm^2. That has continued since (today’s number at CT is exactly -1.300 Mkm^2). The long-term average minimum area is around 5 Mkm^2, so if the anomaly is still -1.3Mkm^2 in September, we’ll see a minimum area of around 3.7 Mkm^2.
I am Nick.Barnes@pobox.com.
Nick I’m happy to repeat our current exact bet for 2009 using the 4.01 number as measured by Cryosphere Today. Just reply here within a week. I’m also very interested in what conditions you think we’d need to see to say we’ve reached an NH ice “tipping point”.
OK, Joe, let’s do it over for 2009. Specifically: If Cryosphere Today reports a 2009 minimum area of more than 4.01 million square kilometres, I’ll pay you 50 euros. If Cryosphere Today reports a 2009 minimum area of less than 4.01 million square kilometres, you’ll pay me 50 euros.
So, it seems to be the case that all the denialists lost their bets. What a surprise…
Petro–
Do you consider Atmoz a denialist?!
Which dataset is being used for the bet?
Fred–
It’s the number that will appear in this table:
http://arctic.atmos.uiuc.edu/SEAICE/timeseries.1870-2007
Checking in to note that Nick Barnes won the minimum sea ice extent bet last year ( 2008) when the arctic ice extent fell below 4.01 million sq kilometers per Cryosphere today.
Nick and I are repeating the bet for 2009.