Time to bet on the December UAH temperature anomalies for the lower troposphere. You are betting on the value that Roy Spencer will post here early in January.
As many know, I always show the channel 5 AMSU data to help you guess. Mind you, Roy doesn’t use the Channel 5 AMSU when computing the UAH anomalies because Channel 5 drifts. But it’s up there measuring, and daily values are available. I’ve rebaselined the value relative to the 20 year monthly averages. These are shown below: 
The deadline for betting is set to Dec. 26. I think that means mid-night the 25th wherever the server is (probably California.) Remember: Bet now. If you change your mind, bet again. The script will overwrite your initial bet.
Results older than 2 months are not displayed avoid taking my site down.
Hi Lucia,
Off topic but I am interested in your thoughts on the baselining done in these graphs from the Russian agency:
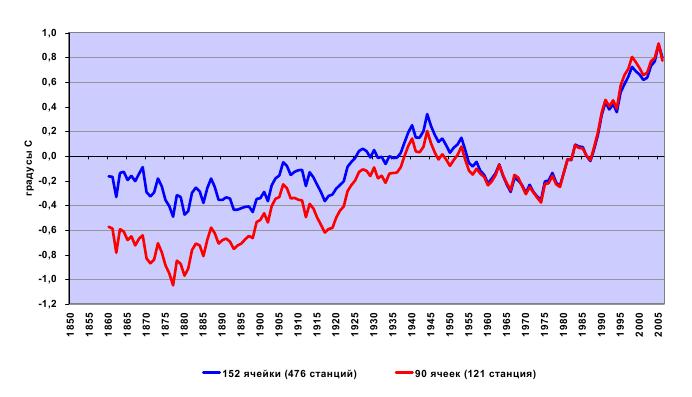
http://www.realclimate.org/images/russian.jpeg
It looks like they were forced to be equal during the 1960-1990 period and that makes it look like the selection had no effect on the late 20th century temps. But I am wondering if this graph is deceptive because hides an offset in absolute temperatures between the two graphs.
The other graphs in the doc seem to suggest that the absolute temps for the missing stations were cooler than the included stations.
Raven–I haven’t jumped into the Russian stuff in detail. But that image looks like there is more 20th century warming with the red trace compared to the blue trace. The difference are mostly prior to 1950.
It’s interesting that the “blue” is warmer that “red” during the 40s– but it’s a small amount.
I’m not sure if an offset in absolute temperatures matters to the climate change argument. Some places are cooler; some places warmer. With respect to the claim that the globe (or any region) is warming what matters is changes.
Out of curiosity– does the blue trace end before 2005? Or is it just hiding behind the red?
What I can’t figure out (and I am hoping you could guess) is whether the two series were likely converted to anomolies using the same average or if a different average calculated from each series was substracted.
If the latter case is true then the difference in the early record could be a larger cooling in 70s followed by the same rise but ending a much lower anomoly in the 2000s.
Well if someone could tell me what the UAH TTL readings are I will take the bet.
Are they Lower Tropospheric temperatures? The actual temperature average for December? If so why not go for the anomaly, which everyone is more familiar with?
Raven–
I have no idea how those were calculated. I can’t guess from the figure. That’s something people are going to have to ask whoever made the graph.
Oops you did say anomalies… beg your pardon
lucia,
Thanks. The fact that you can’t guess is still useful information (i.e. there is not some standard that is consistently followed).
Lucia, a little off topic but did you see this? Ever heard of the Chow test?
http://theresilientearth.com/?q=content/stat-model-predicts-flat-temperatures-through-2050
Bob B–
I have heard of a chow test.
Another silly idea from MrBob: A bet on the date that Mayon explodes and how much cooling we get from it when it finally does (and yes, it’s clear that zero is a very real possibility). Just for fun, of course. I personally fear that it will be big enough to be unclear about the effect so that it will just muddy the waters with respect to the current warming pause.
schnoerkelman (Comment#28646): Thats easy. Mayon will provide just enough cooling to account for AGW to be just right despite being just wrong in its warming predictions.
It will not muddy the waters, it will merely fog the air. Undersea volcanoes which are 3 times as numerous as the land ones muddy the waters and perhaps provide a bit of ocean warmth?
Considering this picture of the AO it seems a sure bet that the NH anomaly will be less than October. Trouble is the SH. I am going way out on a limb and saying the anomaly for December will be 0C.
When do the results come out?
If we ignore WTH, or be charitable and allow his estimate to be a tenfold error, (he has melted the ice-caps already), the champion warmist is David Gould. To be expected from someone who believes that turning vegetarian would bring down world temperatures.
On the other extreme we have Carlo E, with ice-age now. I hope not. Its been cold enough already.
Richard–
The results are usually posted informally at Roy Spencers blog by the 4th of the month. However, I’m noticed it sometimes takes Roy a bit longer. I’m guessing this month may be one of those since many people have been on vacation!