 Steve McIntyre reminded me that Bishop Hill also published a book that may interest many of my blog visitors. It seems you can get the book from the UK outlet of Amazon. If you’d like to buy it, click “The Hockey Stick Illusion: Climategate and the Corruption of Science (Independent Minds) (Paperback)~ A.W. Montford (Author)”.
Seems like lots of people do want to buy it. The rank is 484!
(Note: The links are affiliate links. )
Update: Jan 22. The books rank is now 382 and it’s #1 in global warming& greenhouse effect.
Bishop Hill Rocks!
I saw it at CA today and was going to buy it at Amazon US with a copy of the CRUtape
They no longer had a copy of Hockeystick in stock 🙁
Montford now at 297, Gavin Schmit 127981, Michael Mann 163925.
The ranking is based on the current rate of purchase more than the cumulative number purchased, so I wouldn’t read too much into comparative numbers on the week of the book’s release. That said, 297 is fairly impressive.
My favorite cherry pick too.
#6 in environmental sciences
oh wait this is better.
in the UK.. Bishop hill is #1 certain categories.
I think I’ll contact the good bishop and perhaps we should do a bundle deal.
Steven Mosher:
The good Bishop stated in one of his posts that he was having problems finding a US publisher for the book. Perhaps you could help with that also?
Having both books offered in one package would be a treat for those who are having problems finding one or the other available. It would also, as a free benefit, increase the blood pressure of some of the Mann-made global warming advocates.
Such a package might well rise to number one on MANY charts, perhaps globally!
Imagine seeing such a combination on the NYT best seller list for non-fiction and the effort the MSM would have to go to to keep ignoring the issues.
Thanks for the link Lucia!
Still working on a US publisher – I’ll give it a few more weeks until I give up and self-publish. I’m hoping to get some MSM attention this weekend which may attract some attention stateside.
Steve McIntyre (Comment#30954) January 21st, 2010 at 12:09 am
Yes, Steve, it’s a popularity contest, and you know how to win that better than scientists do.
Sorry bugs, I think that after the hockey-stick debacle, “hiding the decline” and all the other issues exposed by the Climategate emails, Michael Mann is now officially an ex-scientist. If he wasn’t nailed onto his perch at Penn State, he would have fallen off long ago.
bugs,
Good scientists have no trouble selling books.
People detect the aroma of BS rather well, and the book sales numbers in this instance reflect exactly that.
hunter–
I think part of the popularity is the fact that these books discuss the social political aspects rather than only science as science.
bugs-
“Yes, Steve, it’s a popularity contest, and you know how to win that better than scientists do.”
Stop being trite, banal and cliche. Of course any decent scientific consensus has an element of the popularity contest about it. I’m sure Phil Jones or Michael Mann would be the first to say that all teams need a little of the team spirit.
????
Amazon U.S. price = $1,924.16
Amazon U.K. = Price: £9.49
The Hockey Stick Illusion: Climategate and the Corruption of Science (Independent Minds) – Paperback (Jan 15, 2010) by A.W. Montford
1 new from $1,924.16
Seller: pbshop
Lucia,
My contention for years is that AGW is in fact a social movement, similar to UFO belief and eugenics.
I am re-reading “Watch the Skies!”, a great history of the UFO myth. http://www.amazon.com/Watch-Skies-Chronicle-Flying-Saucer/dp/1560983434
The similarities between Ufoology believers and AGW believers are striking.
It is interesting to read from the history how serious government and science people were about the ET hypothesis, and to also read how powerful popular suggestion and confirmation bias were.
I say buy 2 or 3 and give them out to friends, relatives, lawmakers, etc. for birthdays or whatever. Makes a great gift.
It makes my day seeing the book move up like this.
@hunter
I am not going to buy the UFO book, I’m afraid. I’ve got *way* too much lying around which I still have to read. Literally dozens of books. So, when you state:
The similarities between Ufoology believers and AGW believers are striking.
Could you please give examples?
Hi Lucia
Sometime back, I posted this question on statistics on your blog.
*******
Hi Lucia
I am a lurker and occasional poster. Sorry for the totally OT comment, I have a stat question for you.
Can you let me know if there is a formula to compute the standard error (and hence the t-stat) of a variable which is a fraction of two normally distributed variables.
Eg: if m = x/y, and x and y are normally distributed variables (coefficients of control variables from a regression) is there a way to calculate the t-statistic of m using the standard errors, covariances and coefficients of x and y.
Thanks
Guy
************
You (and PaulB) graciously responded to it. After some consideration, I decided to use a non-parametric (bootstrap) method to solve it.
However, there is an equation that provides the solution to that problem in “Bickel, P. J. and K. A. Doksum. 1977. “Mathematical statistics : basic ideas and selected topicsâ€. San Francisco : Holden-Day. 62 – 63” if you are ever in need of something like it. Thanks for your earlier response.
hunter (Comment#30973) January 21st, 2010 at 8:09 am
bugs,
Good scientists have no trouble selling books.
People detect the aroma of BS rather well, and the book sales numbers in this instance reflect exactly that
BS, in fact. Writing good science that is accesible to the general public is a rare skill.
BUGS BS, in fact. Writing good science that is accesible to the general public is a rare skill.
“Writing good science” requires an understanding of the scientific process. The obfuscation of your alarmist heroes in response to Steve McIntyre’s requests for data and code clearly demonstrates that they either do not understand scientific method or believe that it does not apply to their work.
Lake Korttajarvi, upside-down use of Tiljander proxies in climate reconstructions. Science? Perhaps. But still awaiting a good written explanation.
Publicity has moved it up on Amazon to #431
Bugs is a laugh please keep him/her here otherwise it would be quite boring LOL
peeke,
Good question.
As just a start, UFOologists call skeptics ‘debunkers’. AGW true believers call skeptics ‘deniers’.
Both AGW promotion and UFO promotion depend on a large, all powerful conpspiracy to keep the ‘truth’ from getting out.
For both, no matter the evidence, UFO/AGW is the answer.
Both depend on suspension of disbelief to maintain credulity.
More to come.
Eli pointed to this new paper on surface bias:
http://www1.ncdc.noaa.gov/pub/data/ushcn/v2/monthly/menne-etal2010.pdf
“Montford now at 297, Gavin Schmit 127981, Michael Mann 163925.”
Pat Michaels: 468,716
Anthony Watts: 2,364,174
S Fred Singer: 1,030,845
Al Gore: 1,264
It’s still amazing to me how well Gore’s BS sells. This demonstrates just how anti-intellectual the AGW political movement is, at large.
Boris (Comment#31032)-The Menne et al paper is just another in a long line of pro surface papers which are no different than those preceding it. If you are pointing to the siting analysis, I note that even they find real effects of siting. Additionally, they look at the aggregate and after the adjustments have spread the bias around to the “clean” stations, and don’t even wait to have siting for all the stations.
Not to mention the professional discourtesy:
http://pielkeclimatesci.wordpress.com/2010/01/15/professional-discourtesy-by-the-national-climate-data-center/
bugs (Comment#30967)-You are a retard. The thread you are commenting on is ABOUT Amazon ranks.
The low numbers for Montford’s book are from amazon.co.uk. Go to the main amazon.com site and you see a different rank:
Amazon.com Sales Rank: #224,090 in Books
People seem to be comparing apples and oranges here…
Andrew,
My reading of Menne shows both unadjusted and adjusted data compared separately. Oddly enough, the results seem quite similar to those JohnV got when he did the analysis ages ago. The fact that unadjusted “good” stations show a higher trend than unadjusted poor stations is particularly interesting.
As far as waiting to have siting of all stations, unless there is some bias in the selection of the 40% sample, I would strongly doubt the analysis would give any different results looking at good/poor at 100% surveyed vs. 40% surveyed.
“Not to mention the professional discourtesy”
That is hilarious on so many levels.
Anthony has had plenty of opportunity to do an analysis with his data. But if he didn’t want someone to beat him to the punch, maybe he shouldn’t have been blogging and doing media interviews about his data before he had done an analysis. You can’t have it both ways by saying “look at this awful data I have!” and drawing all sorts of attention to yourself and then complaining when someone actually tries to quantify the effects that you say are happening. This is yet another page in the very long book of “skeptic” intellectual dishonesty. And it doesn’t really surprise me that Pielke Sr. is buying into it.
Another hilarious aspect is Pielke suggesting Watts should have been a referee on the paper. Watts isn’t qualified to referee my daughter’s basketball games because of the math involved, so refereeing a paper is beyond his skillset. 🙂
I’m sure there’s more whining to come, however. I shall enjoy it.
Arthur–
The book doesn’t have an American distributor. You can’t buy it from Amazon.com. You have to buy it through Amazon.uk. This is bound to depress sales in the US.
I have ordered the book and await the arrival with eager anticipation.
Check out the ranking for books on global warming (oops, I mean climate change, of course, my bad) in the UK, see here. If the popularity of books is any indication, the Brits are not buying into the hysteria being peddled by Gordon Brown, the Met Office (today’s reincarnation of Monty Python’s flying circus), CRU, Nick Stern, et al.
http://www.amazon.co.uk/gp/search/ref=sr_nr_n_8?rh=n:266239,n:!1025612,n:57,n:278080,n:922416&bbn=278080&ie=UTF8&qid=1257145116&rnid=278080
Note that The Hockey Stick Illusion is already at #2, trailing only Christopher Booker’s missive.
Boris (Comment#31039)-As usual Boris you have all the maturity of premature Joey.
As The Aussies may or may not say.
If people doing analyses of Anthony’s survey could actually do it in a honest manner, rather than using subsets of garbled data and looking only at aggregates instead of at a detailed, careful level, maybe there wouldn’t be a problem-provided of course they gave credit where it is due.
In the mean time, these people aren’t doing science, they are doing “discreditation”-a disservice to the entire enterprise of critical examination of data.
Zeke Hausfather (Comment#31038)-Another problem is that stations aren’t “good” versus “bad”-some are worse than others. A more careful analysis is needed.
Moreover, it is not really clear what the true “unadjusted” data actually are. GISS often gives one set for unadjusted and the unadjusted data from NOAA looks completely different.
Will the real USHCN please stand up?
http://climateaudit.org/2008/03/05/ushcn-raw-a-small-puzzle/
I also really want the outstanding issue of NOAA versus GISS in the US to be better resolved. Both GISS and NOAA claim US has negligible siting influences, and yet NOAA shows a large warming trend relative to GISS. These can’t both be correct on this.
Boris (Comment#31032) January 22nd, 2010 at 7:27 am
Boris. be careful. That’s all I will say.
Hint, if you pull a dataset off the internet and use it for a paper
you better….
1. check that the work posted is..
A. current
B. a version that has been quality checked and NOT
a booby trap ( hehe)
2. Pull back your paper if you find out that:
A. The data set you used isnt current or complete.
B. the one you pulled wasnt quality checked and there
are changes.
Well, since you are Tony’s bosom buddy, did he put out a false data set or didn’t he?
What other false things/unchecked data does Anthony post on his site? I thought his was the best science blog, but now you’re telling me it’s not to be trusted?
Mosh,
The “data set you used isn’t complete” argument only holds water if the selection of those data points are somehow biased. IIRC, JohnV’s maps of CRN12r stations back in the day showed a pretty good distribution.
As far as purposefully manipulating the data you release to skew the results and mislead people trying to analyze them, well, isn’t that the sort of thing that folks Anthony’s side of the fence are always accusing NASA et al of?
We had a loooong thread on this subject last year on this blog, and my position that Anthony needs to “put up or shut up” about the effects of poor station siting on the validity of the U.S. temp record (and stop implying that U.S. temp records are seriously flawed until he does so) hasn’t changed. Anthony’s success in convincing a large amount of people that the surface station record is fatally flawed without releasing any compelling analysis of the effects of siting on the overall temp record reeks of having your cake and eating it too, so I’m not going to cry too many tears over the folks at NCDC trying to scoop him.
Zeke:
There are problems with surface stations with respect to their intended purpose, which is to measure weather rather than climate. For weather, you need to reconstruction the surface temperature field, and having biased measurements affects that much more than it does in computing global anomalies.
What struck me of this analysis was that it was a much more complete version of the study that JohnV set out to do, but never completed (at least never fully documented, which is the same thing). The one thing that is totally missing from it is any sort uncertainty calculation. Wow.
Let’s hear it for the marvels of the peer review process, shall we?!
If we can get Anthony to complete his survey and release the data we can go to town on it and see what happens with a more complete surface coverage. I really doubt you’d find much of a difference in a statistical sense between the findings of that more complete study and this paper.
The main reason is that average annual temperature is highly correlated with distance, and you simply don’t need an ultra dense network to measure climate. THe authors address that with this comment:
Different way of saying the same thing.
Regarding the comments from Boris about Anthony’s qualifications to review this paper, I respect Anthony for his experience and understanding of met instrumentation and siting issues.
Also “I’m not going to cry too many tears over the folks at NCDC trying to scoop him.” This is the US, in research, nobody gets priority to a given project. If you move too slow, you lose.
No tears from me either, maybe it will pressure him to get this project out the door.
I’ve always said that the most important aspect of Anthony’s work was that it demonstrated the gross incompetence of the climate science community. Competent scientists need to check their instruments and calibrate them regularly. Just as Mann’s flawed hockey stick was far more important in showing us that the community never bothered to check anyone’s work regardless of how extraordinary the claim (as long as it was made by an alarmist).
It’s clear none of you actually care about the data being high quality. You only care about point scoring against Anthony, because you despise him. Real mature…
stan:
Again, that network was put in place for meteorological measurements, not climate.
And indications are that it does a reasonably good job at climate measurements.
Andrew: I do care that the climate data used is high quality. Indeed, I think it -is- high quality overall, and that low quality data is accurately adjusted for biases introduced by factors related to station quality. I’m concerned about all of the traction gained by as-of-yet unsubstantiated accusations that it is not.
So far, the only analysis of station siting effects on the regional temperature record (JohnV’s, the the two by NCDC) show no significant effects of poor station siting. I see no compelling reason not to assume that this is true until I see competing evidence.
Boris (Comment#31047) January 22nd, 2010 at 12:02 pm
Well, since you are Tony’s bosom buddy, did he put out a false data set or didn’t he?
What other false things/unchecked data does Anthony post on his site? I thought his was the best science blog, but now you’re telling me it’s not to be trusted?
Huh. read what I wrote.(hehe means joke) Before you just go download a preliminary dataset that’s been posted, you would do well to check with the person who put it up there. NOTHING NOTHING NOTHING is to be trusted you dope!. Not my work, not jones, not menne, not anthony, not mcintyre. You double check everything. DONT YOU GET THIS.
before I ever used or more critically tried to PUBLISH a paper
based on the categorization of sites according to a guideline
( crn 1-5) I would at a minimum have an independent team
Look at the same photos and apply the same guideline and see
how well it checked. DOH! you dope that is why you post
the pictures and post the guideline and post your results.
So anybody can ( and SHOULD) check the output of your process.
Then you ask these basic questions.
1. is it current?
2. has it been through the quaility checks yet ( Early on I suggested an independent check on all the data, espceially
since the application of the guideline to the photos has some subjective component)
3. Is it complete?
4. Are there additions planned.
heck, I wrote anthony and asked him for updates
as I was playing with the data and he explained to me.
A. he had a backlog of sites that had not been classified
B. He processed things in batches, not daily.
C. he was planning on a quality check so people wouldnt say
his assessment was subjective.
D. he was going to continue the project till he got close to
100%
Gosh, what is the responsible thing to do?
a frigging english major could could figure out that you wait.
NOW, lets suppose that I didnt check on the data, or lets suppose
that I have been informed by the data creator, prior to publication of my paper, that the data in question has been
superceeded. What’s the responsible thing to do?
I’ve downloaded data and didnt check its currency or provenance with the author.
I’ve written a paper and submitted it and then I’m informed that
the data I didnt ask about has in fact been superceeded.
Boris. Pretend you have an ounce of responsibility and tell us what you would do?
Hypothetically.
Zeke:
Which is ironic, but true.
The norm is the application of the data for another purpose is less optimal than the application of the data for the intended purpose.
It’s an interesting fact that the very problems that Anthony is railing against probably have a larger effect on the predictability of weather than it does for predictability of climate.
For Andrew_FL’s sake, just to be clear nobody that cares about high quality measurements should be happy about sloppy work such as the problems discovered in the US meteorological network. But that doesn’t prevent us from noting that “meh! not so important here.”
Carrick (Comment#31050) January 22nd, 2010 at 12:40 pm
careful. You dont know all the facts.
Zeke,
How can you cite John V when he never completed his analysis – it must be close to 3 years now?
If you cared about data quality, you wouldn’t have blind faith in the adjustments. And you wouldn’t be “concerned” that people are questioning them.
All the analyses I’ve seen of siting have been fatally flawed. That includes the crap NCDC has inexplicably produced.
“Gosh, what is the responsible thing to do?
a frigging english major could could figure out that you wait.”
This is fun. Let me quote you from a really intersting PUBLICATION I read. It’s title is “Is the Surface Temperature Record Reliable?” and it’s written by one Anthony Watts.
Well, does the data need quality checking or is the sample comprehensive and representative? Are you saying that Watts is not as bright as the average English major–because he seems to lack the restraint that you think should be so obvious. Hmm.
But he goes on!
Wait, is he talking about his own data being unreliable? Why is publishing this without a quality check? If he did run a quality check, then he should release his data–he is publishing on it, right? I’d hate to call ol’ Tony a hypocrite, but…
In short, if your data isn’t QC’ed then don’t make public pronouncements on it over and over like you actually have a conclusion, or even–at long last–a clue.
“I’ve written a paper and submitted it and then I’m informed that
the data I didnt ask about has in fact been superceeded.”
How bad did Anthony F up the data the first time he posted it on his site?
Boris,
“How bad did Anthony F up the data the first time he posted it on his site?”
How bad did GISS, CRU, NCDC, NOAA… f up the data that they posted to THEIR sites???
I guess we won’t know until independent auditors actually go through the data and AUDIT it will we.
Of course, since there was so little asking done, could Anthony have simply posted the RAW data from the volunteers for later processing?? Could he have had a backlog of unposted raw data at the time the NCDC downloaded?? Could there have been a problem with the server, software, or operator and the DB was restored to an earlier version?? Could there…
HAHAHAHAHAHAHAHAHAHAHAHAHAHAHAHA
Boris.
You still dont get it. The data pulled by Menne is PRIOR to
the data sited in anthonys PDF.
Menne pulled down data of the first 40% of the 1221 stations.
“They used only ~40% of the USHCN sites yet over 87% have actually been surveyed by Anthony’s volunteers. ”
or about 300 sites which was posted on the internet.
Then NCDC pulled a stunt with that data so Anthony pulled the
data down.
I asked him for the data and he said, he was holding it back until
he was 1. ready to publish. 2. Had a independent QA done on it.
Then more work was done.. the survey went from from the 300 or so to 860.
The paper that you site from Anthony was 860 STATIONS.
GET IT MORON.
then another 200 stations were added.
GET IT
I guess we won’t know until independent auditors actually go through the data and AUDIT it will we.
Actually you have all you need to do the work yourself.
1. The guideline is posted ( definitions for 1-5)
2. The pictures are posted.
You SHOULD do your own auditing. I personally would. But you need to do it blindly. That is, you take the photos. you take the rating system. You apply one to the other.
Thats applying the method to the data.
Then you check against what anthony says.
To do this properly you do it blindly, actually I’d probably have 3 raters all working independently. ( having done this kind of rating in the past, I’d do that just as a matter of course)
I would throw out any sites where we differed.
I would test the CRN1 versus the CRN5 to find the
signal.
I would look at Tmin
You really do need to learn to check facts.
Menne used around 300 sites.
The paper by anthony used 860.
There are now over 1000.
Since the signal is likley to be small ( johnV and I estimated it at
.1 to .15C) then even an english major knows that more N is your friend when trying to find a small signal. We also know that if you WANT a test with low power, if you WANT to find no difference, then you test with small numbers.
Next.
Steven Mosher:
Who does, lol.
I disagree with Anthony that the station location errors make that big of a difference for climate monitoring, and I have strong theory-based reasons to expect them not to matter that much.
That said, science is about surprise, and I’m always ready for another surprise.
“I asked him for the data and he said, he was holding it back until
he was 1. ready to publish. 2. Had a independent QA done on it.”
Look, genius HE ALREADY PUBLISHED WITH THE DATA.
If it needs an independent QA, THEN HE SHOULDN’T HAVE PUBLISHED IT.
If he doesn’t want the NCDC to respond to his stupid claims, THEN HE SHOULD STOP MAKING STUPID CLAIMS ON HIS WEBSITE AND IN THE MEDIA. (as if, right?)
Get it, moron?
“The paper by anthony used 860.”
Tell Anthony to free the effing data.
Also, RTFR. The JGR Menne paper shows that they have verified at least half of Anthony’s data, and four fifth of “good” stations.
Boris,
“Look, genius HE ALREADY PUBLISHED WITH THE DATA.”
So, you are claiming that
1) an editorial in his blog is equivalent to a Peer Reviewed Paper??
2) you KNOW that the data he had at that time was the complete data set??
HAHAHAHAHAHAHAHAHAHAHAHAHAHAHAHAHAHA
Carrick,
“I disagree with Anthony that the station location errors make that big of a difference for climate monitoring, and I have strong theory-based reasons to expect them not to matter that much.”
.
I am sure ther are any number here who would love to look at a presentation on this.
kuhnkat:
Time permitted, I would like to study this problem more formally. At the moment, time very much is not permitted.
In principle I have access to high resolution data that can be used for this. In practice it is currently not available. One that changes, I may got back and visit it.
What I could say now, I think has been said dozens of times in the peer reviewed literature. It gets confusing because the “good stuff” is spread out among a bunch of compostable material.
Now its getting very interesting I would say the IPCC days are numbered http://wattsupwiththat.com/2010/01/23/breaking-news-scientist-admits-ipcc-used-fake-data-to-pressure-policy-makers/
With the latest devlopments at the IPCC, I’d say the Bishop will be out with Volume 2 by summertime.
“1) an editorial in his blog is equivalent to a Peer Reviewed Paper??”
This isn’t an editorial on a blog. It is a publication.
Boris, did Anthony eat your babies or something? You seem to have an irrational hatred of him.
Boris,
““1) an editorial in his blog is equivalent to a Peer Reviewed Paper??â€
This isn’t an editorial on a blog. It is a publication.”
Why yes, I can see how YOU might think that!!
I mean, it was published by the Heartland Institute which you AGW types simply bow down to in reverence as the epitome of veracity and honest science. I also notice the voluminous references to other papers of excellent PEER REVIEWED veracity. Then there is the attached data of high quality. In fact, it is of at least as good quality as many papers you have defended here and on other blogs!!
BWAHHAHAHAHAHAHAHAHAHAHAHAHAHAHAHAHAHAHAHAHAHAHA
Anthony has commented that he has two papers in review.
It was expected that the NCDC would try to rush through another paper showing how their data is infallible. There is a lot at stake now after Climategate showed how certain members of the NCDC were a big part of the organization.
Let’s not forget as well, that lucia linked us up to a Change Monitor page awhile ago which monitors any changes made in the GISS global temperature record.
Just 8 days ago, GISS made 38 changes in the historical global temperature record between 1880 and 1950 (and 33 of those lowered the historical record). The law of averages says this should not happen and the law says this should especially not happen every single month. They are nickel and dimeing the temperature record to death. A -0.01 here, a -0.01 there, rinse and repeat every month and pretty soon it is a big change. GISS’ data comes from the NCDC so these are partly their changes as well.
http://www.changedetection.com/log/gov/nasa/giss/data/glb2_log.html
Steve Mosher,
You’ll love this article: Keeping computers from ending science’s reproducibility
Free the code! Free the data!
And NASA, (guided by GISS?) is also busy rewriting their websites, quietly and with no notification, to drop the IPCC/WWF junk science they ahve relied on for years.
@hunter (Comment#31124) — I have been making multiple requests for corrections on the climate.nasa.gov website since August 2009., and am currently involved in an appeal regarding a formal Request for Correction per the Quality of Information Act (Q of I act is in some ways similar to the Freedom of Information Act, but is in regard to the quality, reliability, objectivity and utility of information).
NASA is a big, unwieldy organization and it appears that climate.nasa.gov has little or no dealings with GISS.
It is more along the line of a PR or public outreach or public education site, written with a strong pro-AGW bias. In other words, the climate.nasa.gov group has more in common with WWF and Sierra Club than they do with GISS.
The site would actually be closer to reality if it were indeed being monitored and controlled by GISS. GISS personnel aka the RealClimate blog clearly have an agenda, but they would correct a lot of the truly embarassing, outrageous stuff put out by climate.nasa.gov.
Charlie, have you complained about the completely false statement
“Global surface air temperatures rose three-quarters of a degree Celsius (almost one and a half degrees Fahrenheit) in the last century, but at twice that amount in the past 50 years.”
Kentucky Weather Report:
Cold and a light covering of
White Rotten Global Warming overnight.
Looks lovely from my office window, though.
Andrew
PaulM (Comment#31129)-The implication is amusing. Until 1950 there must have been a cooling of 3/8 of a degree. Which is obviously absurd.
“I asked him for the data and he said, he was holding it back until
he was 1. ready to publish. 2. Had a independent QA done on it.â€
“Look, genius HE ALREADY PUBLISHED WITH THE DATA.
If it needs an independent QA, THEN HE SHOULDN’T HAVE PUBLISHED IT.
If he doesn’t want the NCDC to respond to his stupid claims, THEN HE SHOULD STOP MAKING STUPID CLAIMS ON HIS WEBSITE AND IN THE MEDIA. (as if, right?)”
You have the timeline all wrong. NCDC pulled a file off the internet with approx 300 stations. I went to look for it, to extend the work I and JohnV did back in 2007. It wasnt there.
I asked anthony for the data. He explained what NCDC had done.
1. he wasnt going to publish until more was done and it was quaility checked. he did that with the 860.
GET IT.
2. I asked when he was going to that data available. he replied that he wanted to push for all 1221 ( his goal from the start) and he was going to do a quantitative analysis.
So again, please get your timeline right. Didnt you even notice the station count difference between menne and watts?
Didnt you even check the basics?
Boris
So, you are claiming that
1) an editorial in his blog is equivalent to a Peer Reviewed Paper??
2) you KNOW that the data he had at that time was the complete data set??
HAHAHAHAHAHAHAHAHAHAHAHAHAHAHAHAHAHA
Ah no. dont you read. I’m saying that menne knew that his dataset was incomplete. he was informed that it was incomplete. He could see from looking at a simple blog posting that there was more data. he knows the signal will be small. Trying to follow the bouncing ball.
Stage 1: Anthony posts a data set in 2007, a work in progress.
in that dataset are 13 CRN1 stations. JohnV and I look at that data. Everyone has issues with the size of the database.
Stage 2: Anthony posts and update around 300 stations.
NCDC takes this data and does a misleading study. Anthony pulls the data.
Stage 3: I ask him for the data. He explains he is preparing a report, but just on the station ratings not on a quantitative assesment. A percentage count. This paper will reference 860
stations. A more complete dataset will come after a final big push.
Stage 4. The big push is complete 1000 stations. Time to look at the QUANTITATIVE ASSESMENT.
meanwhile menne embarrasses himself by using a old dataset
when he knows a more complete one exists and is being prepared for publication.
In my opinion, given the non-availability of data, most people should simply suspend judgment on any major problems with NCDC data. There may be problems. This is something that is always true. Anthony has not demonstrated that the data actually have a bias. Because he has not fully released the data, nor published his detailed evaluation, we can’t evaluate his claims and NCDC can’t entirely rebutt them.
That said, given the visibility of Anthony’s blog and the surfacestations project, it’s natural that NCDC would do an analysis with what data they were able to obtain. They may have to repeat it again when Anthony publishes using more extensive data. But… well..so? What we are learning is that given the data NCDC ere able to get, they aren’t seeing a big net effect and it’s not in the direction of warming. That’s information.
We’ll learn more later when Anthony releases more data. Maybe with the new data NCDC will find something else. Or not. We can’t know.
Carrick
“I disagree with Anthony that the station location errors make that big of a difference for climate monitoring, and I have strong theory-based reasons to expect them not to matter that much.”
That’s pretty much my position. JohnV and I both did theory based estimates on the effect. It’s likely to be limited to Tmin, likely to be modulated by season, by wind, by clouds. We put the effect size at .1-.15C at the edge of the noise. hence the need for LARGE N to increase the power or beta of whatever test was done. I would expect to find this effect only in the CRN4 and 5.
That has been my position since 2007. Further, my position on how to handle this is to simply NOT USE CRN4 and 5 for the calculations. Live with the uncertainty due to spatial coverage.
Steve–
I don’t think mene embarrasses himself. People publish preliminary analysis based on preliminary data all the time. In this instance, it’s likely a funding agency wants to know what the answer is based on that data which is available– as do many people.
The results may change when more data are available. But that doesn’t make it embarrassing to answer a question people want to ask. And people do want to know answered in Mene even if the data are subject to change fairly soon.
Many people following this know that the results could change when the fuller data set are available. So, presumably, Anthony will finish his stuff. Then Mene will be able to crank through and see what he gets.
Anthony has commented that he has two papers in review.
Yes. So you can well imagine the backstory. Boris can’t. Menne writes a paper with 40% of the stations covered, using data he pulled off the internet. You can imagine that the reviewers of the paper might have questioned the provenance of that data. you can imagine that it was pointed out to him that there was a more complete dataset, one with 860 stations, and one with 1000 or so.
I mean that is what a competent reviewer would do. A good reveiwer ( like Mcintyre) would go check for the dataset that Menne used.
OPPS, its not there on the web. You might think that the reviewer would contact the owner of the data. You might think that the reviewer was informed that the dataset had been expanded 3 fold. You might think that the reviwer would tell Menne this.
Being a responsible scientist, you would contact the owner of the data. What would you say?
Come on guys its not that hard.
“Tell Anthony to free the effing data.
Also, RTFR. The JGR Menne paper shows that they have verified at least half of Anthony’s data, and four fifth of “good†stations.”
I did. One suggestion I had was to post the data as “preliminary”
His point was a valid one. Given that NCDC has already run off an done something with provisional data without attributing him that they and other were likely to do it again. Further, like a tree ring guy who does the work, he should have first crack at it.
But at the bottom the FUNDAMENTAL DATA and method is already posted.
the fundamental data is the photos: posted.
if people like, they can revisit the sites.
the fundament method is posted. the CRN criteria.
Anthony’s rating, his application of the method to the data
is an intermediate result. He will post that intermediate result
when the papers get published.
Anyone who wants to beat him to the punch can look at all 1000
sites and apply the method.
So menne verified half of the data, half of the 300? half of the 860 or half of the 1000? Did they verify it blindly? Look at the source data, apply the method. generate their intermediate result and compare?
Regardless, the issue that is foremost in my mind is the sample size. menne should have known better.
Roughly 2-3% of all stations are crn1. thats roughly 30 stations in a population of 1000. roughly 8%-10% are crn5, say 100 stations.
with a monthly sd in temps at around .05 how many stations do you need to do a test to find a small effect?
Luica
Get’s it right, mostly. But one thing people dont get is that
the fundamental “data”, the pictures are already posted.
The case is very similar to Santers case, where he argued that he should not have to release intermediate data, eventually he did.
He published the raw data. described his method, and refused to publish the intermediate results. he told people to write their own code.
Anthony Has published the data: the photos. Published the method: the rating method. He has not published the results
of applying that method to that data. If NCDC wanted to they could take the time to apply the method to the data. They dont have to reverse engineer the method. dont have to guess at the method. the method is published. all they have to do is punch the run button. In this case the run button consists of
1. look at photo.
2. Look at rating guide.
3. write down a number 1-5.
Repeat 1000 times. Its probably a couple weeks worth of work.
So basically people are asking anthony to post his intermediate results as he computes them. I’m kinda a freak for open access,
but even in open source we have procedures for handling preliminary builds. I have the source, you have the source. If you dont like the speed at which I’m working, go fork yourself. or work with me? now there is a suggestion. I wonder….
DeWitt.
Great article. I’m at the point of asking the founders of wikipedia creative commons and RMS if they can throw their weight behind this. It’s kinda like the ACLU supporting the march in Skokie, but usually when I have time with my open source buddies I can convince them that transparency will help the trust crisis in climate science. perhaps a special CC license or perhaps a GPL like arrangement.
Throw the weight of WikI commons and RMS behind this? Wiki is controlled by activists not truth. Your open source buddies would do better to shine daylight on the interior code of the GCMs.
That aside, can anyone print the mathmatical formula of any of the climate models. I would actually like to see the math. After all it is physics.
“Further, like a tree ring guy who does the work, he should have first crack at it.”
He’s had two years and in that time has managed to post countless times that the surface network is unreliable, then he publishes a Heartland report that says the same thing: unreliable. How many years should we give Anthony? How many years does he need to do this analysis? And how many times is he going to score propaganda points with an unfinished analysis whilst simultaneously complaining that he doesn’t have enough data or good enough data to do a real analysis?
Mosh,
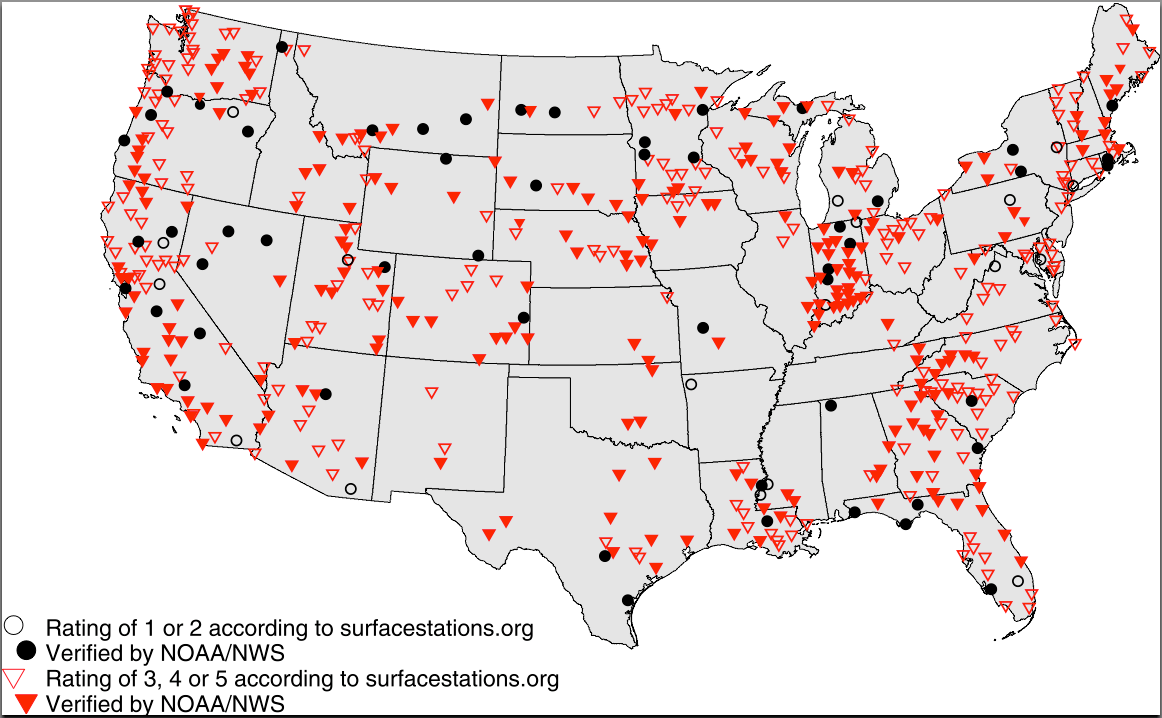
The CRN12 stations independently verified by NOAA/NWS look to be reasonably well distributed.
http://i81.photobucket.com/albums/j237/hausfath/Picture57-1.png
Steven Mosher:
That’s what I think too.
I’ve looked at it with some high resolution temperature data I have extending over two years, and the effect was very small. Now I need some high-res data from an urban setting….
Carrick
Boris,
Can Anthony do it as long Briffa, Mann, the IPCC, etc.?
Lucia
Could you consider providing a link to Bishop Hill in your blog list down the right hand side of your home page. He makes some excellent contributions and it would help newbies to navigate.
But its your blog so ignore me completely if you wish!
Ed
EdBhoy–
Done!
Zeke Hausfather ,
“The CRN12 stations independently verified by NOAA/NWS look to be reasonably well distributed.”
OK, now, how is the distribution of Rural/Urban/Airport???
Boris,
” How many years should we give Anthony? How many years does he need to do this analysis? And how many times is he going to score propaganda points with an unfinished analysis whilst simultaneously complaining that he doesn’t have enough data or good enough data to do a real analysis?”
Since it is a VOLUNTEER effort and no one is getting millions in our tax dollars to complete it, I would say until there is enough data to do an EXCELLENT job of evaluating the network.
Also, since any negative conclusion he comes to will be attacked by you and other apologists, or alternatively any positive conclusion attacked by deniers, and any neutral conclusion attacked by everyone, enough data to be reasonably CONCLUSIVE.
You have any time to run around and help survey the last 100 or so stations??
Then he should shut up and not publish with Heartland. You keep defending Anthony, saying that he is being patient and thorough, but then his publication of trash totally makes you look like an idiot for saying that. You can’t have it both ways.