GISS has posted their December anomaly.The NH+SH anomaly for December is 0.59C down from 0.68 C for for November.The trends since 2000 and 2001 are illustrated below; a nominal trend of 0.2 C/decade is illustrated for reference:

It looks like this is the 4th warmest December in the GISSTemp record.
I’m afraid I just noticed this and there isn’t sufficient time for me to run the analysis on the difference between observations and IPCC model-mean projections from a variety of start dates before I flit off to have dinner with the inlaws at “The Downers Grove Moose Lodge”. But I thought you’d all like to see the temperatures now.
(source. )
Looks like the CCC folks were slightly off; they forecast 0.58 a few days back: http://clearclimatecode.org/gistemp-2009-anomaly/
OOpp! Time for an audit to track down the extra 0.01C
I wonder if just a trickle of new data arrived in the interim. There must be some reason it took GISS a little longer to post than CCC.
“It looks like this is the 4th warmest December ever. ”
Ever? Evah? I don’t see a smilie, and in its absence I have to think you are being serious. Maybe I haven’t been around long enough to detect sarcasm in your work, despite the “Quantloos” etc. being discussed, but this “warmest ever” stuff just sticks in my craw a touch and if I’m being too serious I hope to be slapped down, and SOON! 🙂
Something smells in Denmark, to coin a phrase. We all know the northern hemisphere has been the coldest in many years during early January. The stories abound everywhere (I in S. MN. on the Iowa border have yet to see the temperature above freezing this year and spent most of the first two weeks below zero F). Now as us skeptics (realist) are gloating. It just so happens the people behind the curtain, come out and say we just had the warmest January day in recorded history during the frigid plunge? ( Some Global Temperature recording site UAH) Well excuse me, I wasn’t born yesterday. I would like to add, I found this site http://data.giss.nasa.gov/gistemp/station_data/ I typed in my local rural city and asked for raw data graphed since 1886 (real temp data I assume). Anyhow here is the result http://data.giss.nasa.gov/cgi-bin/gistemp/gistemp_station.py?id=425744400040&data_set=0&num_neighbors=1 Amazingly their is not any Hockey Stick My city is near as cold in 2009 as it has ever been in recorded History! No wonder I do not buy into the GW frenzy. I am a Farmer and would wish it would warm up so I could consistently raise better crops, extend my growing season and have less fear of severe crop loss from sudden freezes in the spring and fall…and it I really do have Global Cooling here in Rural MN………..John
PS Why don’t some of you guys put in some pertinent cities and see if You also have Global cooling or at least zero warming over the last last 120 years Like I have…….John………
About the same here in (formerly rural, now suburban) Farmington, MN.
http://data.giss.nasa.gov/cgi-bin/gistemp/gistemp_station.py?id=425726580010&data_set=1&num_neighbors=1
Lookit all that warming!
Boris, thanks in advance for patiently informing me that regional temps don’t mean a thing, the rest of the earth is boiling, weather is not climate, one city’s climate is not climate, and that I need to quit believing my lying eyes and start listening to smart folk like James Hansen and Danny “Global Warming caused the Haiti earthquake” Glover.
Terry MN
Are we being taken for ride? I mean seriously, if there really was Global Warming why is the Center of a Continent in North America (Minnestoa) Not warming and maybe even cooling. Like I said it is no wonder I was not buying this whole Therory. We are not warming. I am sure interested where all the warming is. I do not think we will find any in most of the USA, yet we are to foot the largest bill. 100 Billion Dollars already commited to be paid to other poorer nations. Besides all the billions we are already spending. Plus what it may cost us in the furture if these alarmist win……John..
Terry,
Borris’ shift ended a few hours ago, so I’ll fill in.
>>thanks in advance for patiently informing me that regional temps don’t mean a thing,
They certainly mean something, but its quite possible one one part of the earth to be very cold and another to be quite warm. The Arctic and the U.S. over the last few weeks are case in point.
>>the rest of the earth is boiling,
certainly not boiling, but not particularly chilly either. See http://data.giss.nasa.gov/cgi-bin/gistemp/do_nmap.py?year_last=2009&month_last=12&sat=4&sst=0&type=anoms&mean_gen=12&year1=2009&year2=2009&base1=1951&base2=1980&radius=1200&pol=reg for the distribution of temps in the last month for GISS.
>>weather is not climate,
Yep, though as I always say to Anthony, saying it ironically doesn’t make it less true :-p
>>one city’s climate is not climate,
Ditto.
>>and that I need to quit believing my lying eyes
Alas, anecdote is not the singular of data.
>>and start listening to smart folk like James Hansen
Or UAH/RSS/HadCRUt, take your pick
>>and Danny “Global Warming caused the Haiti earthquake†Glover.
I’d suggest not. Its akin to judging all republicans by Rush, or democrats by Moore.
Zeke,
You mean not all Democrats think like Moore? 😉
And all Republicans don’t think like Rush?
Why do so many of the crazies have the big megaphone?
John P — all the warming seems to be happening in Australia if you run the graphs for Sydmey or Melbourne or Adelaide etc you get a fairly serious trend — still the climate of one city is not that of the world etc etc
Andrew Kennett (Comment#30372)
Well I have just spent the last 4 hours going over 100 of locations in the US and I have found but a pittance of recording areas that would show any warming in the 120 year period in the data base. So I believe some one has to be doing something with the data when the Combine them Try for yourself (just touch the amp with your mouse and area sites pop up close to you mouse click. http://data.giss.nasa.gov/gistemp/station_data/ Also I took away something about the Pine Beatles killing the pine trees out west. Of course that gets 100% blame from GW. Yet guess what try and find any global warming out West. Well what am I saying try to find Warming almost anywhere in the US during that 120 year period…….I feel violated and lied to by these Warmists. I use to believe there was a certain amount of warming. And maybe some could be blamed on Co2. But now using the actual city to ciy data all over the US. I can’t even find warming and maybe even cooling after the cold 2009 in the US for that 120 year period…..John……
“PS Why don’t some of you guys put in some pertinent cities and see if You also have Global cooling or at least zero warming over the last last 120 years Like I have…….John………”
If you want anecdotal evidence, it’s been damned hot.
I agree with bugs about anecdotal evidence.
How about a contest using rural stations with at least a 100 year record, using the GISS website/DB – you show warming, I’ll show flat. Bring on the hockey sticks, I say. What say you? Count ’em up at the end, hell, spatially weight ’em, and someone (not me) will declare a winner of what the ~100 year record shows us. I say this as a lukewarmer. In full disclosure, I plugged thru about a hundred rural stations around the country in the GISTEMP database before I made the above bet, so I’m not too worried about the outcome. But hey – there are a lot more! I know – the US is only 2% of the warming world and is probably an anomaly, but I thought it might be fun anyway given the number of articles I’ve read about AGW here. And yes, doesn’t prove or disprove anything, regional climate, blah blah, blah, blah. In any case, I say: Bring out your trends!
TerryMN (Comment#30361) January 15th, 2010 at 6:30 pm
Dr Inferno has all the information you wanted.
http://denialdepot.blogspot.com/2010/01/this-week-of-global-cooling.html
The week of global cooling.
Not much point doing it since the models aren’t valid over such a short timespan.
Or another, to avoid cherry-picking accusations might be – everyone who wants to “vote” (whatever) submits the one weather station (minimum 100 year record) closest to their house and we can use that. Both are completely unscientific, I know, but I get bored waiting for the monthly sat contest results.
For me – the Farmington, MN record is closest.
bugs- Oh? It’s not worth comparing simulations to observations since 1950? What do we need, 7 million years?
Where do you even get your odd notions about time requirements for testing?
bugs (Comment#30384) January 15th, 2010 at 11:15 pm
Bugs – I posted a +100 year graph. A week is weather, 100 years is climate. Right?
TerryMN (Comment#30388) January 15th, 2010 at 11:21 pm
You were referring to one location. AGW is about global climate.
lucia (Comment#30387) January 15th, 2010 at 11:19 pm
I was referring to this http://rankexploits.com/musings/wp-content/uploads/2010/01/GISSTempDec-500×341.jpg
If you used unadjusted data for this analysis…the actual data without GISS adjustments…would the conclusion of this last December being the 4th warmest still hold?
I’m just a dumb working engineer. When I adjust data, I tend to show an analysis of raw data in parallel. That’s probably the wrong way to do it. And, my question is probably foolish, too.
But, I thought I’d ask anyway.
Lucia:
Perhaps, I was partly involved with this?
I pointed out in another thread that the climate models don’t capture short period variability, and that probably you needed at least a 20-year average to adequately test them. From my perspective, it’s “not a big deal” if the models don’t agree with the data over periods of 10-years. To me, it’s much more interesting, and actually diagnostic, that they also don’t over periods of 50 years.
Gary:
In my opinion, showing it on the same graph isn’t very diagnostic, if we know there are problems with the uncorrected data, but I do like to plot the residuals (adjusted-original) on a separate graph to show the effect of the adjustments on the data.
Lucia I cannot believe that you believe the GISS NCDC data 0.58……. You have all been conned sorry…..
“E.Michael Smith notes “When doing a benchmark test of the program, I found patterns in the input data from NCDC that looked like dramatic and selective deletions of thermometers from cold locations.†Smith says after awhile, it became clear this was not a random strange pattern he was finding, but a well designed and orchestrated manipulation process. “The more I looked, the more I found patterns of deletion that could not be accidental. Thermometers moved from cold mountains to warm beaches; from Siberian Arctic to more southerly locations, and from pristine rural locations to jet airport tarmacs. The last remaining Arctic thermometer in Canada is in a place called ‘The Garden Spot of the Arctic,’ always moving away from the cold and toward the heat. I could not believe it was so blatant and it clearly looked like it was in support of an agenda,†Smith says”
This will be grounds for legal restitution in the near future so be ready.. I think you will find that nearly all your graphs will be seen as pure BS (except for UHA and RSS) sorry. Maybe you should have a look at the raw data and use those
VG, in my opinion, EM Smith needs to document his claims more thoroughly than he has done to date. I mean a list of specific stations that have been moved and so forth. I still wouldn’t read in motivation, unless I was sure it was there.
vg:
First, NCDC and NASA are not the same and don’t use the same data. For the US, GISS uses a combination of USHCN and GHCN data. For the rest of the planet GISS uses GHCN data.
Second, now that all the data are in, 2009 comes in with a .57 anomaly, in a tie for second with 2007. This is a point which Lucia conveniently forgets to mention in her headline post.
I guess I am a little dense. Isn’t it best to always lay all the cards on the table and specifically show the effect of adjustments whenever they are made, no matter what they are, no matter what the reason?
Whenever data is adjusted, doesn’t clear analysis of the effects those adjustments automatically become an essential part of your conclusions?
We all know that it has been alleged that the past has been altered to effect conclusions in the present in this data set. In this environment, doesn’t a “before and after” become an important issue in and of itself?
Working on writing up something more detailed on the whole “cold stations deleted” meme, but here is some food for thought in the mean time: a chart of raw data from all stations with a continuous 1900-1970 record that were removed post-1970 and those that were not removed post-1970. If the stations removals were chosen to leave a warm bias in the remaining stations, you would have expected a fair bit of divergence prior to removal (as it would be the criteria for removal). Looks to me like they track pretty well.
http://i81.photobucket.com/albums/j237/hausfath/Picture20.png
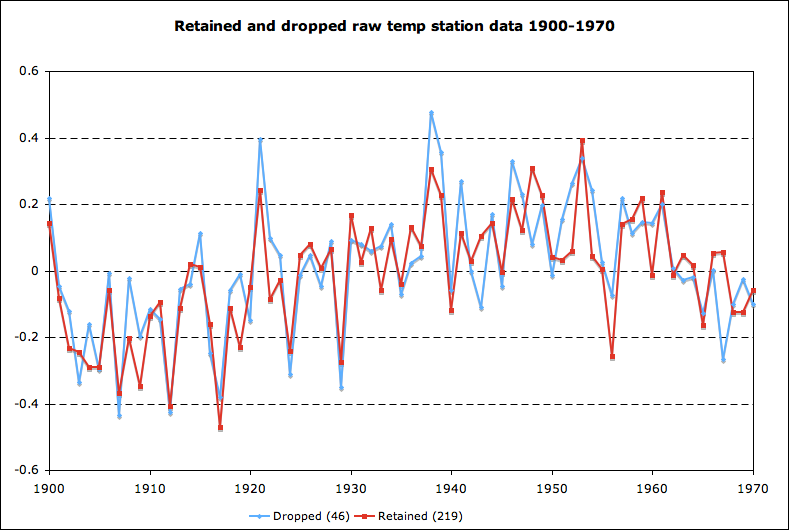
Source code (STATA) and raw temp data are here: http://drop.io/2pqk4vg . Its still a bit of a work in progress (as some of the raw temp data is a royal mess of missing values), but constructive criticism is appreciated.
More anecdotal stuff: January thus far has averaged about four degrees centigrade above average where I live. I haven’t seen snow in years. Oh, and I often have to sleep with the door open, it’s so hot. In fact, it’s very damn hot indeed. Hot. That’s what I said: hot. You heard it right here.
Hmm. GISTEMP is showing a 0.1 deg C drop from November to December, but the Global SST dataset they’ve used (OI.v2) since 1982 is showing a 0.05 deg C rise.

http://i45.tinypic.com/r29jir.png
Graph is from my monthly update here:
http://bobtisdale.blogspot.com/2010/01/december-2009-sst-anomaly-update.html
Where’s all the cooling at? I guess I’ll have to go have a look at the GISS maps.
What should one think of GISS numbers? Its director, caretaker of the data, is convinced the planet is warming. What do you think he will do vis-a-vis his hardened convictions.
I haven’t done an analysis yet, but GISS seems to take the satellite data and arbitrarilly adds anywhere from 0.20 to 0.40°C.
It is an El Nino year and one would expect a positive anomaly, but again this number is out in left field in some other ballpark.
What should one think of GISS numbers? Its director, caretaker of the data, is convinced the planet is warming. What do you think he will do vis-a-vis his hardened convictions.
I haven’t done an analysis yet, but GISS seems to take the satellite data and arbitrarilly adds anywhere from 0.20 to 0.40°C.
the directors of all those institution spend the whole month, just doctoring the next monthly release.
it is a really hard job, you know….
A week is weather, 100 years is climate. Right?
No, its 100 years of weather !!
over time, people get confused by their own confusion tactics. they start believing their own lies.
constant reports about cold weather events (always with a tiny “weather not climate” reminder) have left the impression that it was realla really cold on the globe. it was not.
constant reports about “raw data” have left many people thinking, that raw data analysis gives meaningful results. it obviously doesn t.
a constant look at microsite issues at stations, and endless repetition of the UHI effect, has left people with the feeling, that the globe didn t warm.
just look over at recent Wattsup events. UAH temperature was strongly attacked by blog replies. simply because they show warming.
people are incredibly dissapointed, that their “victory” feelings, caused by snow events, now will not be represented in global temperature data.
Sod–

In the post, I was referring to this:
I didn’t have time to update this to incorporate the new GISS data.
I’ll be posting showing how it looks if we test the model mean using GISS. Over time, I’ll show a variety of analytical choices.
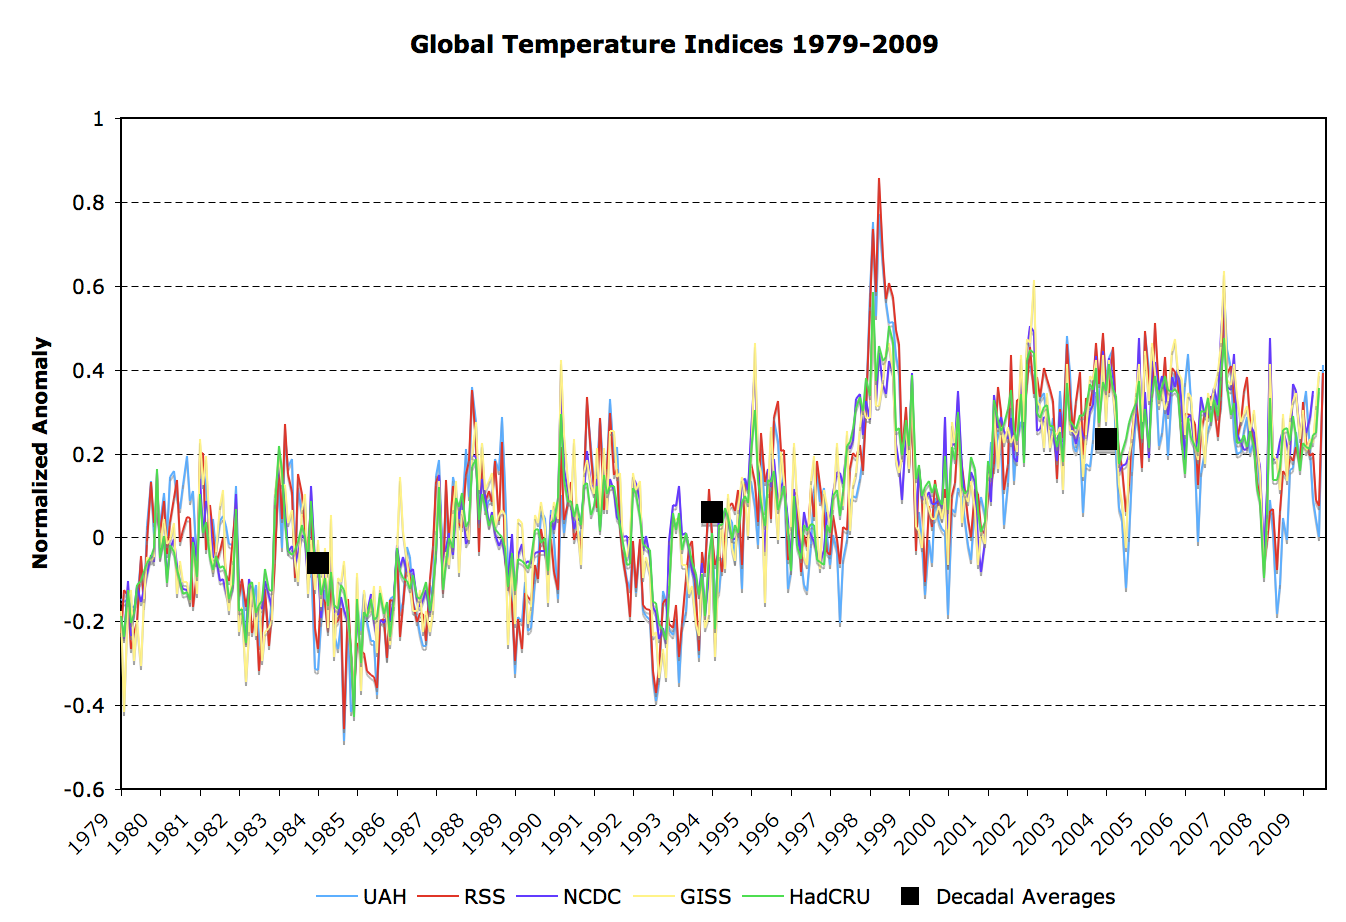
P Gosselin: the reason why GISS seems always to be 0.20 to 0.40°C higher than UAH is because they are on a different baseline. Normalize them for the same baseline period and they aren’t that different:
http://i81.photobucket.com/albums/j237/hausfath/FigureOne.png
For those who haven’t yet picked up on Jim Hansen’s latest:
“If It’s That Warm, How Come It’s So Damned Cold?”
http://www.columbia.edu/~jeh1/mailings/2010/20100115_Temperature2009.pdf
you’ll find pretty convincing answers to most concerns expressed above.
Zeke – Could you please post the list of 265 stations that have a continuous 1900-1970 record? I can only find 139 stations and I’m wondering what I’m missing. Thanks.
Len Orstein, thanks for the link. So according to the modeling arguments, the cooling of the stratosphere should increase the probability of a positive AO index.
Sounds good to me, but I don’t like cold weather, so….
torn8o: here is the list I’m working with
stationids = 150, 1000, 1840, 3810, 6500, 6880, 7100, 7150, 7580, 8460, 9620, 10120, 10350, 11460, 11520, 11820, 13160, 13690, 14920, 16400, 17060, 17620, 17650, 18360, 18520, 18560, 18690, 18790, 18870, 19010, 19020, 19600, 20270, 20990, 21470, 21960, 22010, 22060, 22080, 22170, 22220, 22230, 22310, 22360, 22420, 22510, 22610, 22660, 22700, 22780, 22800, 22900, 22950, 22970, 23040, 23100, 23270, 23340, 23380, 23390, 23400, 23630, 23660, 23750, 23910, 24040, 24050, 24210, 24240, 24280, 24340, 24560, 24580, 24690, 24750, 24830, 24940, 25027, 25180, 25200, 25300, 25370, 25400, 25460, 25500, 25530, 25620, 25640, 25670, 25720, 25830, 25860, 25870, 25910, 25940, 25950, 25990, 26080, 26190, 26200, 26390, 26410, 26540, 26550, 26580, 26620, 26710, 26810, 26890, 26980, 27430, 27540, 27640, 27720, 27770, 27850, 28070, 28670, 29090, 29330, 29740, 30570, 30630, 30910, 31190, 31280, 31490, 32740, 32790, 32950, 33330, 33390, 33450, 33510, 33630, 33710, 33930, 34040, 34180, 34240, 34340, 34360, 34440, 34660, 34720, 34730, 34950, 36140, 36310, 36580, 37800, 37810, 38210, 38370, 38420, 38490, 39530, 39800, 39860, 40130, 40710, 41200, 42100, 42500, 42660, 43260, 43600, 44920, 45780, 46720, 47520, 47680, 48570, 48680, 48800, 49590, 49750, 50050, 51210, 51880, 52600, 53580, 53600, 54170, 54220, 54720, 55740, 59340, 60110, 60630, 60800, 61860, 62180, 62420, 62600, 64580, 64600, 64910, 65750, 65850, 66440, 66450, 66600, 66790, 66800, 66850, 66920, 67000, 67020, 67140, 67300, 67450, 68700, 70830, 71500, 73450, 74120, 75490, 75820, 75950, 76060, 76120, 76180, 76500, 76620, 77500, 77750, 78070, 78170, 78270, 79180, 79360, 79640, 80620, 80730, 80970, 82220, 82750, 83010, 83250, 83670, 84290, 84380, 84390, 84570, 85070, 85120, 85210, 85260, 85360, 85460, 85880, 86980, 88420, 92630, 93790, 98380, 98660, 99006, 99014, 99032, 99071, 99085
bugs: You were referring to one location. AGW is about global climate.
AGW is about the A, not the GW, bugs. Be honest with yourself.
I picked the station closest to my house. Pick the one closest to yours, lets see what it says.
Frankly, I’m a bit annoyed that I’m missing out on all of this warming. Annoyed does not begin to describe what I’ll be if and when I have to start paying for it.
thanks Zeke, but did you drop a digit in the IDs that you posted? In the data file, most of them are 6 digits but you don’t show any.
This is the proof read it.
http://chiefio.wordpress.com/2010/01/15/ushcn-vs-ushcn-version-2-more-induced-warmth/
In fact its absolutely shocking what has Lucia have to say about this…. its OK?
Previous In fact its absolutely shocking what has Lucia have to say about this…. its OK?
Meant to have this link
http://www.rockyhigh66.org/stuff/USHCN_revisions.htm there are others just like this for each station
vg (comment # 30467)
Somebody needs to answer for this non-sense, some of the alterations are huge. So which data is right the old, the new, some, all or none? What a bunch of garbage. Running data into a data base is NOT rocket science. 10 year olds could enter the data better these clowns are doing to date. Is all this planned. Confuse so badly we (The Public) can not even fix the data for these clowns…..J
torn8o:
Thanks, you caught an error. My parser was accidentally dropping the first digit from a lot of the stations. I’ll fix that and rerun the analysis.
torn8o:
That issue explained the few really weird values I was getting where annual station temps would change ~40 C in one year, since apparently it was parsing together two separate stations.
To fix that error in the source file, the new input parsing code should be:
infix stationid 2-8 year 9-13 jan 19-24 feb 26-31 mar 33-38 apr 40-45 may 47-52 jun 54-59 jul 61-66 aug 68-73 sep 75-80 oct 82-87 nov 89-94 dec 96-101 ann 131-136 using “WMSSC_temperature.txt”
Also, we can drop the outlier correction, since those were an artifact of the bad parse:
*su ann_norm, detail
*drop if ann_norm r(p95) | if ann_norm < r(p5) // Remove outliers. No longer needed. This gives us: 51 stations dropped 220 stations retained The station graph: http://i81.photobucket.com/albums/j237/hausfath/Picture32-1.png
And the full list of stations used:
11520, 13160, 14920, 21960, 29740, 30910, 39530, 40130, 42100, 42500, 43600, 60110, 61860, 62600, 66600, 66800, 67000, 71500, 72220, 76500, 82220, 83010, 85120, 85210, 85360, 93790, 103810, 109620, 110120, 110350, 111460, 123750, 124240, 128400, 132740, 152600, 153600, 154220, 160800, 162420, 164600, 167140, 176060, 225500, 234720, 238490, 242660, 249590, 260630, 267020, 267300, 275950, 276120, 282750, 286980, 292630, 298380, 298660, 302300, 307100, 307580, 313690, 319600, 325400, 333450, 333930, 336580, 338370, 348800, 351210, 351880, 353580, 368700, 375490, 384570, 385070, 401000, 401840, 406500, 408460, 416400, 417650, 417820, 420270, 420990, 421470, 421650, 422610, 422950, 423390, 423910, 424040, 424510, 424750, 425870, 425990, 426190, 426710, 427540, 428070, 428670, 429090, 429330, 429700, 430570, 430630, 431280, 431490, 432790, 432950, 433330, 433510, 433630, 433710, 434040, 434180, 434240, 434360, 434440, 434660, 434730, 434950, 450050, 466920, 474120, 474200, 475820, 475850, 476180, 476620, 478070, 478170, 478270, 479180, 479360, 480620, 480970, 548570, 583670, 600150, 607150, 618560, 619010, 638940, 639800, 652010, 654720, 670830, 677750, 679640, 684380, 685120, 685880, 688420, 703810, 716000, 717060, 718360, 718520, 718690, 718790, 718870, 722010, 722060, 722080, 722170, 722220, 722230, 722310, 722360, 722420, 722510, 722660, 722700, 722780, 722800, 722900, 722970, 723040, 723100, 723270, 723340, 723380, 723400, 723630, 723660, 724050, 724100, 724210, 724280, 724340, 724510, 724560, 724580, 724690, 724830, 724940, 725027, 725180, 725200, 725300, 725370, 725460, 725530, 725620, 725640, 725670, 725720, 725830, 725910, 725940, 725950, 726080, 726200, 726390, 726410, 726540, 726550, 726580, 726620, 726810, 726890, 726980, 727430, 727640, 727720, 727770, 727850, 744920, 764580, 766440, 766790, 766850, 780730, 783250, 784390, 785260, 810010, 825860, 837430, 837810, 838210, 838420, 840710, 847520, 854170, 855740, 859340, 862180, 865850, 873450, 875850, 877500, 911820, 917620, 931190, 934340, 936140, 937800, 939860, 941200, 943260, 945780, 946720, 947680, 948680, 949750, 964910, 967450, 984290, 999085
Carrick What more proof do you need ???
http://chiefio.wordpress.com/2…..ed-warmth/
http://www.rockyhigh66.org/stu…..isions.htm etc etc….
Zeke:
Not true. You’re using a visual trick to hide a very real difference between the data sets. Their temperature trends are different. 1.27°C/century UAH versus 1.63°C/century GISTemp.
Almost a 30% difference.
John P has placed his exact same comment on Skeptical Science as comment 30360 above. link
John from Mn submitted the exact same comment to Watts Up With That link post on UAH trends.
John also placed the exact same comment on The Air Vent link
John’s 4th use of the same comments is here: link
Submitting the exact same comment on 4 blogs is …..
vg:
How about study of the methods that were used to adjust the temperatures, and the pinpointing of what is wrong with those methods that introduced the false bias.
What you have is simply proof that the adjustment makes a difference and that it increases the net trend. That doesn’t prove there is anything wrong with the adjustments or that the adjusted trend is less reliable than the original raw data set.
What we do know is there are problems with the raw data set that have led to them being adjusted, so we do know factually the original data set is wrong (in the sense of containing correctable errors).
D Kelly (#30488)
What is your point? They are called disscussion pages. Go back to your hole….John…..
Carrick:
I wasn’t implying that the trends aren’t different (UAH being significantly lower than RSS/GISS/HadCRUt). Rather, Gosselin’s argument of the difference being 0.4C in a single year is due to differing baselines (well, apart from 1998, but thats due to ENSO events registering more in the troposphere than surface).
Zeke:
OK. Thanks for the explanation, Zeke.
Re: John P (Jan 16 18:22),
Cross-posting (posting exactly the same comment on multiple blogs) is evil. The main reason is that the author is highly unlikely to monitor responses to the post on all the blogs. If you aren’t planning to follow responses on all the blogs to which you posted, you are, to all intents and purposes, spamming. If I had a blog and found someone cross-posting on it, they would probably be banned.
I still can’t see how adjustments to the data is not the core issue that has to be resolved before anything else.
In this example and others I have seen, the adjustments made to the data appear to be very wrong and strongly effect the trending.
http://icecap.us/images/uploads/NOAAroleinclimategate.pdf
Until the unadjusted data is fully analyzed and all adjustments to that data fully documented and rationally justified, I don’t see how there can be any confidence in any statistics based upon them.
Gary H:
It’s not that critical, because what matters is the temperature change since e.g. 1975, when human generated warming is thought to have kicked in, and not the putative warming from 1850 to 1975. And for 1979 to current, we have satellite coverage to “keep them honest”.
(Before 1975 as I’m wont to say, forcings from anthropogenic CO2 and sulfate emissions nearly balanced each other out..)
Gary,
Try http://www.realclimate.org/index.php/archives/2009/12/are-the-cru-data-suspect-an-objective-assessment/ and http://www.gilestro.tk/2009/lots-of-smoke-hardly-any-gun-do-climatologists-falsify-data for starters. This is well trodden ground, and its not like people have not examined adjustments by various groups in quite a bit of detail. There is also plenty in the literature, though most of it is behind the pay wall.
If you want to do the analysis yourself, Nick Stokes kindly posted some R code awhile back:
#### A program written by Nick Stokes, 13 Dec 2009, to calculate the changes to regression
# slopes caused by adjustments to the GHCN temperatures v2.mean_adj-v2.mean
# A function to calculate regression slope. I hope it is faster than lm()
slope<-function(v,jj){ m=jj-mean(jj) s=(v %*% m)/(m %*% m) s } ##################### # read data from v2.mean and v2.mean_adj, downloaded from http://www1.ncdc.noaa.gov/pub/data/ghcn/v2/
# I edited (emacs) to put a blank between the station number and year, and to change -9999 to NA (add .txt)
# Read in data from the files in matrix form
if(T){ #change to F after you have read in th efiles once
vmean <- matrix(scan("v2.mean.txt", 0, skip=0,na.strings = "NA"), ncol=14, byrow=TRUE) vmean_adj <- matrix(scan("v2.mean_adj.txt", 0, skip=0,na.strings = "NA"), ncol=14, byrow=TRUE) # Now, to save time, move to annual averages vmean_ann=vmean[,1:3] vmean_ann[,3]=rowMeans(vmean[,3:14], na.rm = T) vmean_ann_adj=vmean_adj[,1:3] vmean_ann_adj[,3]=rowMeans(vmean_adj[,3:14], na.rm = T) } # Initialise vv=rep(0.,200) # regression y vector jj=rep(0,200) # regression y vector grad=rep(0.,9999) # gradients (the output result) len=length(vmean_ann[,1]) jmax=length(vmean_ann_adj[,1]) j=1 k=0 kk=0 m=0 # counters. j is row of adjusted file. m is station counter # k,kk are local row (year) counter (for station m). k skips NA's, kk doesn't # loop over all rows in v2.mean for(i in 1:(len-1)){ kk=kk+1 # to find matching rows, first check diff between stat nos and years u=vmean_ann_adj[j,]-vmean_ann[i,] # If the adjusted counter has got ahead of the unadj, wait if(u[1]<0){ if(j
I stand in front of my house: 28oC,
I walk to the letterbox next to the driveway and asphalt 31.5oC
I go to the front of my chicken coop 26.5oC
Walk 25mtrs to the paddock gate 28.5oC
I walk to the end of middle paddock 26oC etc etc
I live on a 20 acre property.
J Hansen has divided the globe into 5X5deg grids.
Each grid is aprox: 550km X 550km
So who’s gunna tell me what the temperature of the globe is? Who’s gunna tell me they can “measure” anomalies to within fractions of a degree?
If weather is not climate (aren’t we sick of hearing that?) then how come these wags measure, graph, plot and compare weather, then tell me about their “climate” projections 50-100yrs hence?
All of this might be a good exercise in mathematics, but totally useless as an aid to determining global temps.
Nobody knows which year was the warmest or coldest, and nobody will know.
The energy entering the earths atmosphere is CLIMATE.
The consequences of that energy, how it moves around, is WEATHER
If you want to know about the earths climate, research the energy budget. The ensuing weather is in the lap of the gods.
Zeke, you are aware there were problems with that analysis, right?
It has a nice temporal trend in it (that’s what’s responsible for the highly leptokurtotic shape).
Hi Lucia on a lighter note:
OT but might lighten the atmosphere
On Mombiot’s blog. The comments are hilarious 99 to 1 against. I admire Monbiot for hacking it though….
http://www.guardian.co.uk/environment/blog/2010/jan/06/cold-snap-climate-sceptics
This is one of the funniest ones:
I was wondering when the climate change lobby was going to get its mitts off and explain away the cold weather.
I have nothing to say other than that I keep warm by tearing up climate change books and articles and stuffing them under my jumper.
I knew they must be good for something and it works for me.
Baa Humbug,
Your another Aussie right? I admire your logic and agree that the squabbling over fractions of a degree over a century is spurious to say the least. I too have carted my thermometer around the farm and found 10%variations in temp further distorted by shading, clouds and puffs of wind. Added to that; thermometers are not equally accurate and so the temperature record is at best a poor guide; at worst a complete distraction.
I’m a retired farmer with few qualifications but I do know that outputs minus inputs equal profit. Where does one find a year by year global energy budget?
I recently read a report by a Dr. Chan (U of Hong Kong) on cyclone frequency and severity. A warmer atmosphere leads to more powerful storms; fact. He says that in the past thirty years the freq and sev of storms has shown a slight downward trend which would allude to a stable or slightly diminishing energy budget.
I would really like the thoughts of the more learned here. There has to be a better way of arriving at the truth concerning CC than the temp system that is so easily distorted.
TerryMN (Comment#30447) January 16th, 2010 at 2:20 pm
The G is about Global. Picking individual stations is going to be a waste of time.
Lucia. “It looks like this is the 4th warmest December ever.”
Unless you have another graph, you are showing the 4th warmest since 2001. Hardly a headline, and not “ever”.
Wandering slightly off-topic …
Can anyone explain why the NCDC/NOAA gridded maps for December temperature anomalies disagree with the UK Met Office’s figures for the UK? The NCDC’s 1961-1990 baseline map shows anomalies of -1C to -3C for different parts of the UK. This sort of agrees with the Met Office’s calculations, which give a range of -1.3C to -2.5C and a national average of -1.8C. However, the NCDC’s 1971-2000 baseline map shows anomalies ranging from zero to +1C whereas the Met Office’s range for this baseline is -1.7C to -2.7C, national average -2.1C.
Assuming the two agencies’ temperature records for last month more or less agree for this part of the world (a big assumption?), it looks like the Met Office reckons British Decembers were 0.3C warmer between 1971 and 2000 than they were between 1961 and 1990 whereas the NCDC reckons they were two or three degrees cooler.
What’s going on? A slight warming in the later period is plausible and I suppose a cooling of that magnitude is not wholly implausible. But how can the two agencies have such hugely different notions of what UK Decembers were like in the two periods?
Have I misunderstood what I’m looking at? (It’s more than likely. I’m out of tobacco.)
Links:
http://www.metoffice.gov.uk/climate/uk/anomalygraphs/index.html http://www.ncdc.noaa.gov/sotc/?report=global&year=2009&month=12&submitted=Get+Report
P.S. Lucia, your RSS feed is broken again at this end. Ho hum. Such is life.
Please swap ‘warmer/warming’ and ‘colder/cooling’ wherever they appear in my last comment. (D’oh! And I would have got away with it if my connection hadn’t broken and pushed me over the ten-minute editing limit. Those pesky electrons!)
On a related note, I’ve found where the UAH and RSS raw data is stored. It’s at the National Snow and Ice Data Center in the “Data Pool†section of this page:
http://nsidc.org/data/amsre/order_data.html
You’ll want the AE_L2A.2 brightness temperatures data.
http://n4eil01u.ecs.nasa.gov:22000/WebAccess/drill?attrib=esdt&esdt=AE_L2A.2&group=AMSA
I’ve not yet come across any UAH or RSS source code that processes this raw data. However, there is some general purpose source code for working with this data here:
http://nsidc.org/data/amsre/tools.html
The raw data has the following noteworthy properties:
*) It’s huge. I’d estimate a single day of temperatures will be about 2.5 gigabytes of data.
*) It mixes binary and text data in a single file. The text data is in hierarchical format, but it’s not XML, JSON, or any other standard format. It uses custom tags to define the hierarchy.
*) It includes all levels of the atmosphere. Usually, you’ll just want the troposphere, so you’ll have to extract that information out manually.
For more information on this data and how it’s collected, see the WUWT post by Dr. Spencer, here:
http://wattsupwiththat.com/2010/01/12/how-the-uah-global-temperatures-are-produced/#more-15191
Bugs,
What is this ‘global climate’ you keep banging on about? There is no such thing, only local and regional weather and even the regional and local weather masks considerable local variations.
A recent example. We have had a fair bit of snow and ice here in Wrexham, North Wales over the last four weeks. Schools were shut for 4 days. Five miles south and west the snow and ice was much worse on most days. At one point, 10 -15 miles east there were far worse conditions than applied at that time in Wrexham – schools here were open then.
Considerable differences in weather and temperature over very short distances then. How on earth can you begin to equate this situation to a global scenario?
Dave Andrews,
Are you claiming that increases or decreases in the amount of energy reaching the earth have no impact on the earth’s climate? Were ice ages simply ‘local and regional variations’?
The GISS map is quite interesting..
http://data.giss.nasa.gov/cgi-bin/gistemp/do_nmap.py?year_last=2009&month_last=12&sat=4&sst=0&type=anoms&mean_gen=12&year1=2009&year2=2009&base1=1951&base2=1980&radius=1200&pol=reg
The weather in the northern latitudes was scorchingly hot, between 4 and 7.2 deg C above normal. But remarkably it cooled quickly to between 4 and 8.4 degrees C below normal across much of Russia and something near the centroid of North America. Go a little further south from either of those two areas, and things are back to hot again.
These are anomalies and not actual temperatures, but it still looks quite peculiar thermodynamically.
Zeke, I can’t buy what you are saying at all. To me, that is just blowing smoke.
The adjustments have a normal distribution. This seems an odd answer to the question to me. That implies that the adjustments have no effect without answering the core questions. Especially, the central question of what the heck the raw data looks like before you mess with it.
We are supposedly dealing with professional weather station data here. Why adjust at all? Data is sacred. You don’t change it without very good reasons and very good and open documentation.
I’m just a dumb engineer, so I have to ask questions in order to understand things. Right now, I want to understand why one wouldn’t start with the raw data as the primary record out front center, then show any adjustments made openly documented and discussed.
Gary H (Comment#30593) January 17th, 2010 at 8:48 pm
Raw data is usually useless by itself. If you have ever worked with collecting and using it, you will know the collection, the instruments, the storage, all have issues and compromises.
Lawrie (Comment#30533)
Hi Lawrie, yes I’m an Aussie. I”d like to see the report you refer to. Do you have a link please?
From all I’ve read and learned, the 2 things researches should be focusing on IMHO are the sun and the oceans. Oceans are the ONLY substantial way the globe can store energy. This energy is moved around by various forces (just like jet streams in the atmosphere only much slower).
The big difference between oceans and atmosphere is that in the atmosphere that energy mixes much quicker than the energy in the oceans (which really canot mix well but that’s another story. Cyclical events like ENSO PDO AMO are testimony to that.
Therefore David Gould (Comment#30580) yes there can be (and there probably has been) “regional” or better still hemispherical ice ages or warm ages, keeping in mind that the SH has a much larger ratio of ocean to land than the NH.
So I believe the SH cannot have as large or frequent difference in temperatures than the NH. The “little ice ages” referred to often were probably restricted to the NH whereas the major ice ages probably were global.
Any thoughts?
I am a layman who relies on logic and a very sensitive BS meter. Can a learned blogger help me with the following please.
Why did this planet wait hundreds (thousands according to M Mann and IPCC) of years for the minisucle anthropogenic GHG to be infused into the atmosphere in order to begin warming when IN FACT the planet had an almost limitless amount of GHG to call upon (water vapour in the form of the oceans)?
If the planet was going to warm due to GHG’s, why didn’t it warm with WV which was there to be had in abundance?
How is it that this WV never made it into the atmosphere? I am talking about the volume of WV equal to the volume of CO2 man has emitted in the last 200yrs. A fifth of a tenth of a quarter by volume couldn’t find it’s way into the atmosphere?
Please explain.
ps M Mann’s hockey stick graph wasn’t just about trying to prove that the recent warming was unprecedented. The removal of past warm periods also served to debunk the above argument. We all know what happened to that hockey stick.
Add as much CO2 to the atmosphere as you like, it’ll have next to no impact on global temps.
Baa Humbug (Comment#30607) January 18th, 2010 at 12:33 am
Water vapour is a response to temperature, if it’s cold, no matter how long you wait, the WV won’t go up. If temp goes up, WV goes up.
Baa Humbug (Comment#30607) January 18th, 2010 at 12:33 am ,
I second bugs on this. The scale height of water vapor in the atmosphere is only about 2 km. That means over 50% of the total water vapor in the atmosphere is within 2 km of the surface. As a result, equilibration is rapid. So to a first approximation, the climate drives the atmospheric water vapor content, not the other way around.
bugs (Comment#30609) and DeWitt Payne (Comment#30610)
I appreciate the response.
Atmosphere thins with altitude does it not?
But again, both CO2 and WV are GHG’s, what one does the other can do. In fact CO2 effect is supposed to be amplified by WV yes?
Don’t the oceans release CO2 when warm? If it can be claimed that CO2 can initiate a rise in temperature, same can be claimed for wv (which is a stronger ghg and more volumous) can it not? The planet MUST have had a runaway warming if the above is true, but it hasn’t. In fact, it can be said the planet has regular runaway cooling events, which means a feedback mechanism tending towards negative rather than the positive as claimed by warmists.
Baa Humbug,
http://wattsupwiththat.com/2009/03/12/global-hurricane-activity-has-decreased-to-the-lowest-level-in-30-years/
http://www.worldclimatereport.com/index.php/2010/01/14/listening-to-johnny-chan/
I got a buzz getting two links in. Another few years I might know what I’m doing. BTW I came across another item concerning the US Insurance industry having second thoughts about AGW and related risks. Climategate has caused pause. Check Reason.com
Thanks lawrie,
Yes I’ve read reports re: Insurance industry. Isn’t it wonderful how influencial money can be? Almost as much as self interest.
Dr Chan article is impressive. I found the graphs quite telling. The Phillipines has not been hit hard with hurricanes 2yrs in a row in 100 yrs of records.
To me, that’s more a usefull information than all of the volumes of IPCC reports.
But again, both CO2 and WV are GHG’s, what one does the other can do. In fact CO2 effect is supposed to be amplified by WV yes?
one of them stays in the atmosphere for a very long time. the other one is removed immediately.
why does a $200 wage increase change your financial situation, while a $200 lottery win does not?
because the wage increase is there for a long time. and it can feedback lottery wins (if you play more..)
on the other hand, the lottery win is a one off. and it will not feedback a higher wage.
Hey sod: “one of them stays in the atmosphere for a very long time. the other one is removed immediately. ”
LMAO Are you serious?
Anyway…Co2 concentrations in the atmosphere…I’ll show you what they really look like. See here:
http://i26.tinypic.com/25g8p3t.jpg
Please don’t ignore me and deny there was possibly over 60 glacial advances and retreats during the last 2 million years . And these occurred pretty much at “0” on that graph and at “0” C02 concentrations on that graph too. So don’t go screaming about this teeny tiny gas any more like you are.
(And hello! 10 yrs/200yrs/1000yrs/5,000 yrs of “data” is pretty much “0” data to look at for this planet’s climate and claim you know anything is “unusual”. The ice core record is much more data and it shows C02 lags temperature!)
Besides, this planet is in an interglacial period right now. ice is not supposed to melt? Don’t be silly.
Liza,
I’d suggest watching Richard Alley’s keynote at this year’s AGU for a bit of a more nuanced view of the role of CO2 in the earth’s climatic history: http://www.agu.org/meetings/fm09/lectures/lecture_videos/A23A.shtml
Given that the forcing effects of CO2 are roughly logarithmic due to partial saturation of LW absorption bands, the temp change due to increasing from 200 to 400 ppm is roughly that of increasing from 1000 to 2000 ppm. We have good reason to believe that glacial cycles could not occur given Milankovich forcings and albedo feedbacks alone without a strong GHG feedback, and the role of silicate weathering as a long-term regulator of temps and CO2 over geologic time isn’t particularly controversial.
Gary,
I’ve linked two datasets containing the raw station temps in this thread, as well as an R script that will parse and compare each station to the adjusted data for that station. If you have concerns about the adjustments, by all means go do your own analysis on them.
Carrick,
Problems in which? There are two of them there that use quite different methods. That said, if you are concerned about temporal-specific adjustments, its not hard to look at the magnitude of adjustments in a particular period (say, 1970 to present). The time the adjustments occur will have no effect on the trend over the entire period, but could potentially have effects on particular timeframes.
Zeke Hausfather, I am not a scientist. (I am just a lowly lady and mom who can read) The published earth scientist is my husband. Sea level high stands match the Milankovich cycles perfectly all over the world. I believe that whole “weathering” thing is a fairly new idea; coming from something like one paper I believe I saw on Real Climate not very long ago. I don’ t think you can say it’s not controversial. I even remember that I showed it to my husband.
I’ll check in with him, look at your link and get back to this when I can.
Liza,
Thanks for looking into it. As far as silicate weathering goes, there are literally thousands of papers going back decades, a good portion of which can be found via a Google Scholar search: http://scholar.google.com/scholar?q=silicate+weathering+carbon&hl=en&btnG=Search&as_sdt=2001&as_sdtp=on
That said, the volcanism/weathering thermostat only really operates on scales of tens of millions of years. Its interesting in its implications for the role of GHG regulation in the paleoclimate, but not particularly relevant to modern times.
As far as sea level matching Milankovich cycles, thats exactly what we’d expect. Few people argue that Milankovich cycles weren’t the primary forcing of glacial cycles; rather, the idea is that changing atmospheric GHGs were needed to explain the magnitude of the temp response observed, since Milankovich forcings alone are relatively weak (and mostly affect the distribution of incoming solar energy, rather than its magnitude). GHGs are a mostly feedback rather than a forcing in the paleoclimate (apart from long time scale volcanism), and respond to magnify exogenous forcings. I wrote an article a few years back that might help explain the relationship: http://www.yaleclimatemediaforum.org/2007/10/common-climate-misconceptions-co2-as-a-feedback-and-forcing-in-the-climate-system/
liza,
Weathering as a mechanism for removing CO2 from the the atmosphere was proposed quite some time ago. IIRC, the mechanism was first published by H.C. Urey in a paper in 1952. He also invented the oxygen isotope ratio proxy for temperature reconstruction.
CO2 does come out of the ocean as the temperature increases, but the time scale is long and the rate is low so only a tiny fraction of the current increase in atmospheric CO2 can possibly be attributed to that source. That also means that CO2, absent events like the PETM or the Deccan Traps, must lag the temperature in the ice cores. That does not mean that CO2 cannot amplify the temperature increase. I have a post on that very subject.
Zeke and Dewitt;
Thanks guys, I have to go for the afternoon and I will comment later (with the help of the hubby!) if I can. 🙂
“Weathering as a mechanism for removing CO2 from the the atmosphere was proposed quite some time ago.”
I know this (sort of lol) but what I was remembering was something about “mountains growing” just recently ala Real Climate. I’ll have to read that link too from Urey. Interesting. I was taught (by the hubs!) oxygen isotope ratios were used first to find sea level information (how much of the water was stuck in ice) not first used as proxy for temperature measurements- that came later. -I will look and look at Zekes’ link too!
I have to say though, words like “relatively weak” , “GHGs needed to explain the magnitude of the temp response” etc aren’t in our vocabulary at this house…the earth’s wobbles are narley! 🙂
Zeke, I was referring to this figure from Gilestro’s analysis.
There are two things one should always do when applying corrections, computing residuals and so forth. The first is to verify that the data are normally distributed (these are not even close) and the second is that the corrections/residuals are uncorrelated in time (when you plot the corrections they are highly correlated in time, so again the CRU adjustments fail the test).
Failing either of these is problematic, the CRU adjustments suffer from both.
When you look at the GISS global temp map for Dec 2009, It appears that the countries which have the greatest carbon footprint are the coldest eg US, northern Europe, Russia,northern China etc and the area with the least carbon footprint has the hottest anomaly ie Arctic.
liza,
You aren’t welikerocks who used to post at CA by any chance. Your bio is identical to a first approximation.
I suspect the mountains growing thing refers to Raymo and Ruddiman’s hypothesis that the uplift of the Tibetan Plateau when the Indian and Asian plates collided exposed fresh rock surface which increased the rate of weathering and was at least partly responsible for the reduction in CO2 over the course of the late Cenozoic. The relevant paper is Raymo and Ruddiman, Tectonic forcing of late Cenozoic climate, Nature, 359, 117-122 (1992).
Ruddiman is also the guy who thinks that humans have been modifying the climate ever since the invention of agriculture. He attributes the length and flatness of the current interglacial to this modification.
Dewitt-yep that’s me. Welikerocks.
Can’t stay long-long day; big rain storm here, hard day.. but my husband says in a nutshell you all are sort of grasping at straws; a desperate attempt to justify C02 as powerful climate forcing agent- when ten years ago it never came up and was not discussed seriously in any of the text books. If weathering etc (you say like that is in Urey’s paper (which I haven’t looked at yet but will) was all ” well known” and ” back in 1952″ why wasn’t it discussed as a climate forcing agent ten years ago when he was in school; before all this climate change hysteria (his profs warned him at the time to be suspect of the IPCC too!)?. My husband believes that people are trying to work C02 into any paper they publish to justify funding for their research. It’s that simple. I was right about the history of the oxygen isotopes/ and they may perhaps be used for a general idea of temperature/climate but he suspects not down to tenths of a degree like they claim they do.
He says it has been well understood for the last 15 yrs at least (at least when my husband was at school) that you can calculate paleo orbital parameters from differential erosion of rock layers and outcrop all over the world. And in fact, this is how paleo orbits are calculated in the first place. So you can’t tell him orbital forcings are not powerful enough. From deep sea cores to tops of the Himalayas you can see them.
Speaking of Himalayas, heard on the radio today the IPCC has to retract it’s stance that the glaciers there are “melting” unprecedented-like . The data was fraudulent. Not even a peer reviewed paper- ends up it was all just a 10 yr old newspaper article their projections were based on. (?) Wow if true! (same thing here in Calif. Air board scientist bought his PHD online who wrote diesel fuel regulations)
Cheers and we will be around when we can! 🙂
liza/Welikerocks,
I heard Hansen give a talk in 1988, I think, at the Pittcon (Pittsburgh Conference on Analytical Chemistry, hasn’t been in Pittsburgh in decades). Back then, he was just a voice crying in the wilderness.
Line-by-line radiative transfer calculations over the full depth of the atmosphere (100km anyway) correcting for pressure and doppler broadening of the lines, which is what you need to do to show the relative effects of the different ghg’s from first principles, requires a lot of computer horsepower. Most people didn’t have it then. The height of desktop technology then was the Intel 386 with a math coprocessor. I’m not even sure what the state of the HITRAN database on absorption/emission lines of small molecules was then either. MODTRAN was used for remote imaging mostly. Now you can do MODTRAN calculations of atmospheric emission on the web in a few seconds and desktop PC’s have enough power to do line-by-line calculations in a reasonable amount of time. An IR spectrometer, portable so it can be flown or launched in a satellite, with the spectral range, sensitivityand resolution to measure atmospheric emission spectra. That’s fairly recent too.
I can’t argue with the radiative transfer calculations. They show unequivocally that the contribution to the (admittedly mis-named) greenhouse effect from CO2 is second only to water vapor, and it’s a close second. But I have a lot of problems with the next steps. I have even more problems with the proposed solutions.
sod (Comment#30621)
“one of them stays in the atmosphere for a very long time. the other one is removed immediately”.
I assume you mean CO2 stays in the atmosphere for a long time. (how long?)
Does nature discriminate between individual molecules? Surely you are not saying WV disappears from the atmosphere whilst CO2 stays. WV recycles continuously, it is always present. 60% of the planet is almost always covered by clouds, with very small variations.
Also, rain is acidic because it “washes” CO2 from the atmosphere.
So again, whatever CO2 can do, WV does just as well, even better.
Bugs #30609 “Water vapour is a response to temperature, if it’s cold, no matter how long you wait, the WV won’t go up”.
What may be absolutely correct in the lab doesn’t always work the same in the real world. An analogy…
Given the choice between a warm calm day and a somewhat cooler breezy day, which will dry your washing quicker? the cooler breezy day. Even close to the poles, WV rises from the oceans in volumes that leave MM CO2 emissions tiny by comparison.
So I ask once again, given that there has always been an abundance of GHG available, why hasn’t the planet reached higher temps. before? why did it wait 650,000 yrs (according to the IPCC) for the minisicule volume of CO2 emitted by man?
I keep hearing that the oceans absorb CO2 better when cool, emitt better when warm. A simple bottle of soda experiment is used to demonstrate the point. So is there a study somewhere which quantifies this? i.e. at what temp does the ocean stop absorbing and start emitting and how much? what role does atmospheric presure play in this? At the current global temps, are the oceans nett emitters or nett absorbers?
Extrapolating a bottle of soda experiment to 333million cubic kilometres of saline ocean with variability to the max needs to be taken with a grain of salt. (pun)
The water vapour content is set by the temperature. Drop the temperature, the content drops, raise it, the content rises. Adding water vapour to the atmosphere won’t make the content rise higher than the atmosphere is capable of carrying as determined by the temperature. CO2 on the other hand will stay up there until a sink takes it out of the atmosphere. The sinks aren’t removing it as fast as it is being added.
If the amount is ‘miniscule’ doesn’t really matter, it’s a matter of the physical properties of the gas. These are well known and understood, since it has been studied for well over a century now.
http://www.aip.org/history/climate/summary.htm
http://www.aip.org/history/climate/co2.htm
The atmosphere reaches a ‘radiation balance’. It is a matter of the amount going being the same as the amount going out. Change a ‘forcing’, the radiation balance will be unequal, and the climate will change till a new balance is reached.
DeWitt Payne,
“I can’t argue with the radiative transfer calculations. They show unequivocally that the contribution to the (admittedly mis-named) greenhouse effect from CO2 is second only to water vapor, and it’s a close second.”
Interesting, you don’t agree with Miskolczi?? He seemed to come up with different results from his line by line analysis. ;>)
Baa Humbug. Of course there’s been a study to quantify CO2’s interaction with water. It’s been studied since long ago. Henry’s law goes back a couple hundred years, but I couldn’t tell you who studied CO2 specifically. I, like you, have also heard that CO2 is peculiar in that it is absorbed more when things are cooler. I also always heard that the ocean is a tremendous sink for CO2. Remember that in the sea carbon gets sequestered into calcium carbonate (or limestone). Some (like my freshman geology teacher) say that the reason there is so little CO2 in the atmosphere is because there are tremendous sinks starving (my word) for more CO2. Another thing, where I live I’m sitting above a column of limestone hundreds of feet think just full of little snails and trilobites and fossilized critters (Ordovician). All that limestone was built out of CO2 that was once in the atmosphere.
What I only recently learned was that there is also depth of the ocean ( shallow at the poles and deep at the tropics) named the carbonate compensation depth ( or CCD for short) where limestone dissolves…. so I guess it’s a complicated picture, but I do think it’s true that the ocean can absorb an awful lot of CO2 and I think Dr. David Archer of the University of Chicago spells it out in numbers on a chart, in a video that I’ve seen on the internet. Supposedly there is a satellite that was recently launched or that is soon to be launched that is going to provide measurements of CO2 levels at various places over the earth. That could be interesting.
kuhnkat:
It’s generally agreed among most researchers that Miskolczi’s arguments are badly flawed.
Hank Henry,
A chemist friend of mine also pointed out that the solubility of CO2 in water depends on pressure, temperature, impurities in the water AND the partial pressure of CO2. Unfortunately I couldn’t extract from him a chart or calculation to give a layman a rough estimate of the conditions for release or absorption.
Here is an interesting work on CO2 and solubility in oceans and ice!! The comments have a good discussion.
http://www.rocketscientistsjournal.com/2006/10/co2_acquittal.html
Any experts who can kick holes in the presentation??
Carrick,
those are weasel words. What about the “observations?”
Just because he may have overreached doesn’t mean he didn’t present something interesting. Heck, we’ve had scientists who got Nobels by lying who were proven right at a later date!! No one knew it until the real “proof” came along!!
Just because Miskolczi, Beck, Gerlich and Tscheuschner, or Monckton happen to say things you want to hear doesn’t make them right. Be skeptical about the bad skeptics :-p
kuhnkat, I find Arthur P. Smith’s argument much more persuasive.
Eli Rabett summarizes some of this, be careful not to choke on all of the snark!
If your Physics kung fu is up to it, there’s also this.
kuhnkat, thanks. I took a glance at the link. I think it’s something I’ll want to look at and think about.
Carrick (Comment#30720)
“It’s generally agreed among most researchers that Miskolczi’s arguments are badly flawed”.
That is rather a sad comment. Miskolczi’s peer reviewed paper has been around for 6 yrs. Not one paper since has been able to debunk it. Just because “they” generally agree doesn’t make it so. Why hasn’t any one of the “thousands” of IPCC scientists written a counter paper? 6yrs not enough?
Sounds very much like the usual argument to me, “there is a consensus”.
Bugs #30714 “The sinks aren’t removing it as fast as it is being added”.
How do we know that? As far as I’m aware, nobody has yet quantified these sinks. The IPCC AR4 SPM states the level of scientific understanding as “low”.What if the volume exchanged by the whole system dwarfs MM CO2 emissions? If nobody knows then nobody can make definitive statements, certainly not ones that lead to drastic economic changes. Also, “we” have a fair understanding of earths radiation budget, but to say that it is well understood is not correct. If it was well understood, we would not be having this debate for 22yrs
HankHenry thankyou. The CCD concept interests me 🙂
kuhnkat (Comment#30721)
Thnks for the link, I’ve downloaded it along with Gavin Schimidt’s reply, should be interesting 🙂
Carrick (Comment#30729)
Your links are also usefull, thankyou 🙂
bugs (Comment#30714)
“The water vapour content is set by the temperature. Drop the temperature, the content drops, raise it, the content rises”.
Can you please set me straight on this then.
During the many ice ages, (That’s not in debate is it?) the level of WV would have been low. We are also told CO2 levels have been steady for millenia (IPCC). If the atmosphere was so bereft of GHG’s (powerful ones in WV and CO2 at that) how did the planet ever recover from these cold periods?
Surely if the actions and forces of WV and CO2 are well understood we must know the answer to that simple question. If we do, we must also know why it applies (or doesn’t) to the current climate.
Baa Humbug, that’s a good question!
This was a terrible time for me to get into this debate. My husband has been leaving the house at 4am to get to his field site every morning since last week. It’s 4am pacific time right now. Yesterday I had to work too, and the rain storm was fierce.
Funny he had the same question for the peanut gallery as Humbug (this debate was on his mind) as he was leaving the house just now: How did that C02 fluctuate so rapidly all by itself?
He also has another problem with the “logarithmic” talk above. Mann’s hockey stick has got the human C02 contributions to the atmosphere rising at 1850 and the temps rising in step at 1850 right along with them. He says he wishes he had more time to “rip this thing apart” and he is talking about comments like this from Zeke above:
“Given that the forcing effects of CO2 are roughly logarithmic due to partial saturation of LW absorption bands, the temp change due to increasing from 200 to 400 ppm is roughly that of increasing from 1000 to 2000 ppm.”
I apologize (as always) for my lack of a big vocabulary and this channeling my husband thing I do!
Baa Humbug–
Failure to debunk means nothing. The most common response to any paper is for people to ignore it and devote their time to their own research topics. Miskolczi’s paper is disorganized and confusing. Many peoples response when encountering it in a journal will be to scan it, say “Huh?” and then flip through to find papers of greater specific interest to them.
Writing a clear debunk would be difficult and take time away from people individual research. You shouldn’t invest much meaning in any “failure to debunk”.
Lucia thankyou, point taken. I also take it from your post that the “disorganized and confusing” state of Mickolczi’s paper doesn’t necessarily make it “wrong”. Maybe he’ll rewrite it. His overall theory is what makes sense to me. (Relatively) as ignorant as I am about the subject.
Hi Liza, Don’t most of us “channell”? I certainly “channell” what I learn from literature and good sites like Lucia’s. So don’t be apologetic, join the channelling club lol
Baa Humbug–
Disorganized and confusing is different from wrong. But it does mean that it’s very difficult for readers to plow through it. So, if it’s right, many won’t recognize that because they will simply give up on the paper. By the same token, if it’s wrong many wont’ recognize that either. In both cases, people will be content for someone smarter than them to read the paper, decree it right and explain it all in a more organized digestible way. Or, they will be happy to let the incomprehensible paper linger in obscurity.
Lucia, you make good sense, thankyou for taking the time to respond to layman like myself.
I couldn’t fathom the paper itself but got the gist of it from Zagoni and Stockwell of Niche Modelling
Hi Baa Humbug; thanks for your comment on about channeling. 🙂 Looks like some people can’t or won’t answer our question? (or can’t address my husband’s points yet?) Hmm Hmmm Hmmm!
My father always told me; pay attention to what they don’t say!
Personal weather info: Sol Cal coastal area: under a Tornado watch yesterday. It was windy wild wet and cold. Water spout/ Cyclone of 2010! The storm passed over the house in about 10 mins around 1pm moving fast; didn’t touch down or anything near us. Nobody has basements around these parts. It was just… good luck to you see ya when its over time! After- when it was calm again and the sun came out for a little bit- all the birds started singing.
Already heard a friend scream ” OMG! Global warming! We have done something to the planet!” Ugh.
We were getting computer generated phone calls last night to be prepared today/tonight/or tomorrow for another storm (of greater strength possibly)- from our city officials.
Liza– If you have a bathtub, sit in that. It’s heavy and anchored. If possible, find a light mattress or padding to draw over yourself. (This is for flying glass.) Bathrooms are generally far from large glass pane windows, so there is less glass than in front of a picture window.. but still, most have a window.
That’s what they advise apartment dwellers here in the edge of tornado-land.
Unlike hurricanes, direct tornado hits usually make a tight patter. Often the tornados fly overhead and don’t touch down. Never had a waterspout around here, so I have no advise on that!
Thanks Lucia! I knew that but the trouble is the bathroom that fits the bill and has no windows is my teenage step daughter’s bathroom. All I can say is ewwwww about crawling into it. lol And no mattress would fit in that room (or down the hall!) because it is very small. (this is an old 50’s ranch house) Maybe I can get in the tub under a blanket and wear a motorcycle helmet. lol (You may laugh; but I really think someone should invent a giant bubble/pod suit that you can crawl into and inflates fast for all things natural disaster. The Tsunami/Wind/Tornado/Flood Pod © 2010!)
Just look at the GISS graph that Zeke linked to in #30364.
An enormous positive anomaly at the North Pole.
Of course there are no thermometers there, so GISS fabricates, sorry, extrapolates, an invented temperature for that region.
You can see the invented GISS arctic anomalies quite clearly in fig 3 of Hansens recent article “If it’s that warm, how come it’s so cold?”.
Carrick,
sorry I didn’t make it back sooner. No, my mathfu is not up to his paper or Miskolczi’s. Unfortunately his Physicsfu is not up to what he is attempting to calculate.
Without an atmosphere his examples are useless.
Computing the difference between an earth without an atmosphere and current and ASSuming that the difference is due to ONLY GHG’s is also pointless as the oceans and the rest of the atmosphere are non-negligible.
All matter receives energy from LW. All matter above 0k emits LW. Until this non-negligble fact, and others, are included the computations are flawed and the effect of GHG is at least overestimated.
Just for the fun of it take a look at this home experiment. Maybe you can point out the fallacy. It has me beat, maybe because I want it to be true!!
http://www.spinonthat.com/CO2.html
Scroll to the bottom and watch the videos.
I was thinking about things like all the bottles are the same. All the thermometers are reasonably close and the same material… The distance from the heater is about the same. The only diff may be the heat intensity from one end of the heater to the other. My guess is that he probably has done it in different orders. If the AGW theory is true at all, the CO2 bottle should be heating faster anyway so the start temp shouldn’t be an issue!! The CO2 bottle was handled last. The volume of gas in 2 of the bottles is equal but the density of the CO2 should be higher. What am I missing other than he misrepresents what was actually done?? I don’t want to go out and buy a heater…
kunhkat:
You didn’t follow his arguments. Smith includes an infrared-absorbing atmosphere in his model calculations.
Your discussion of oceans etc are not relevant to whether there is a greenhouse gas or not. Or if you think there is, you need to come up with a proof for why this matters. Simply claiming it does, when nobody else does, is not proof.
I’m running a bit behind so I don’t have time for TV or videos. If the point of the experiment is that CO2 doesn’t absorb infrared it’s just wrong. There are probably in the millions of measurements of the atmospheric absorption spectrum that contradict this.
If I get a chance later, I’ll look at the vids.