The guys at Hadley must have decided to wait for temporary lull in the violent arguing: the posted their January anomaly either today or yesterday. January’s HadCrut anomaly was 0.194C. This is down from December’s value of 0.253C, but exceeds the Jan 2008 anomaly value of 0.053C. The value is shown relative to all other anomalies reported since Jan 2001 below:

(Baseline Jan 1980- Dec 1999. Click to enlarge.)
For those of you thinking: Well, Lucia is showing the trend since 2001 ending now what was it last month/year/2 years ago, here are the trends since 2001 as a function of end-month since 2005:

(Note: My choice of 2005 was rather arbitrary. I wanted a “round” year, and I wanted to cut off the noisiest trends computed over the shortest periods of time.)
I’d been wondering if any of the computed trends since 2001 would reach 0.2C/decade during the past El Nino. As we all know, they did not. Naturally, we can’t know with certainty what will happen during the upcoming El Nino, particularly as rumor has it, the sun “woke up”.
For those who like to see more data, the January value is compared to all data since 1980 below:

(Baseline Jan 1980- Dec 1999. Click to enlarge.)
Here are trends as a function of end month since 2005.

As you can see, the trends since 1980 also have not risen as high as 0.2C/decade at any time since 2005.
February is a short month. We probably won’t have to wait to long to learn whether the anomalies rose or fell in February!
I don’t understand the graph. The “current” anomaly is plotted as something < 0.05, well below the 0.194 value. Presumably you are computing anomalies in a different way?
toto- Because anomalies are reported on different baselines, I always plot rebaselined to the 1980-2000 average.
And then there is GISTemp where the anomaly increased from .40C to .45C. I just don’t see how their numbers are credible.
ChuckL– Individual month to month drops and rises contain a lot of noise of the ‘measurement’ sort. If you look, you’ll see GISS dropped sharply from Nov-Dec, then it went up a bit. HadCrut rose from Nov Dec. From Nov-Jan, both dropped. Given the difference in algorithm you could probably eyeball the changes in the arctic and figure out why monthly changes don’t match up in any particular month.
I (kind of) understand that, but when I see that among the 4 global temperature records the GISTemp anomaly is the only one that seems to increase, more often than not, the reduction of temperatures in the 1930’s and 40’s records and the increasing of temperatures in the 1980’s and 1990’s with no clear methodology given, and James Hansen’s books and political leanings, I cannot help but be suspicious of those numbers. I hope that the BEST project brings come consistency and clarity to global temperature records since our govenment and foreign governments make political, social and economic decisions based on these data sets which affect us individually and as a nation.
ChuckL– Which metric (hadcrut, GISS, NOAA) looks like it shows the most warming depends on the start date you pick. Recently GISS tends to show more short term warming, but it’s not necessarily the case for all possible start and end dates.
Who is passing rumors that the ‘sun woke up’.
Solar Cycle 24 is on track to be the weakest in more then a century. Hathaway at NASA dropped his predictions for SC24 on February 3rd, 2011 to a peak of 58. Dalton minimum levels.
http://solarscience.msfc.nasa.gov/predict.shtml
A couple of X-class flares does not make a solar cycle.
harrywr2–
The bunny is passing the rumors:
http://rabett.blogspot.com/2011/02/happy-valentines-day.html
He wrote “Just in time for Valentine’s day the sun woke up”
The IPCC’s Third Assessment Report predictions are now way off the mark. Starting to resemble Hansen’s 1988 predictions with actual observed temperatures staying below even the “commitment” predictions with no further increases in GHGs from 2001(?).
Lucia,
I note that you routinely plot an MEI corrected trend line. Have you ever considered trying to account for the known cooling periods immediately following El Chichon and Pinatubo? The GISS aerosol forcing history says that the effects were strong. I have seen claims of ~0.3C cooling for El Chichon, and ~0.5C for Pinatubo over teh year following each eruption. If the dips in the history following these eruptions did not exist, I suspect the resulting LS trend would be a more accurate representation of the “underlying trend”.
I am in favor of starting the trend with 1998. Not because of any cherry picking reasons, but because James Annan’s $10,000 bet with Galina Mashnich and Vladimir Bashkirtsev used 1998-2003 as the base to compare to 2012-2017.
I know, 2017 is not just around the corner, and they will use NCDC temps, but the bet is interesting. And by 2017 US dollars will probably still be worth more than quatloos.
Re: Don B (Feb 19 18:37),
Don, the way thing are going 2017 US$ maybe worth more than quatloos but not by much.
SteveF– Yes and no. Many of the models attempted to account for those eruptions. So, we would be comparing “like” to “like” without any “correction” for aerosols.
DonB– We can do an Annan’s bet specific post eventually. I don’t think his bet means we should always show trends since 1998.
Steve F, Tamino attempted (I think fairly successfully) to correct surface temps for MEI and volcanic activity: http://tamino.wordpress.com/2011/01/06/sharper-focus/
Lucia,
To trust Eli as the source of credible information on any subject matter is to trust the Rabbett to take care of the lettuce patch..
Owen
All “succesful” attempts by Tamino to correct any given data set will by definition result in yet more proof positive for AGW/ACC. It is not dissimilar from Mann’s Hockey Schtick formula: no matter what you shovel into the hopper, out comes more AGW/ACC. In most scientific disciplines other than climate “science” this is known as GIGO.
In climate “science” however it is treated as rigorous “adjustments” and “corrections” to the raw data, in which neither the raw data itself nor the algorithm for the adjustments/corrections appear in the “materials and method” section of the paper. Contrary to most other scientific disciplines, the latter is not an elementary requirement for “peer review” and publication in climate “science”.
The thoughtful among the alarmists are contemplating Cheshire Cat Sunspots. Their fervor for the Sun’s rising may yet turn to worship.
==================
Can’t win, can they. Someone asks what the temperature record would look like if they adjusted for factors such as volcanoes, Tamino has already done that, and belittle him for doing exactly what SteveF has requested.
Tetris,
Tamino is bright and competent. His (her?) quantitative adjustments for ENSO and volcanic activity are exactly what one might have expected qualitatively: i.e., adjusted temps moved downward during El Nino and moved upward for La Nina and post-volcanic aerosols. In Tamino’s plot the unabated warming signal is becomes less hidden by large, low frequency noise and suggests strongly that warming has not abated in any way.
Owen– None of that means he adjusted “correctly”. But anyway, I don’t think the uncorrected temperature record says warming abated, so it’s hardly surprising a corrected one would say warming abated!
Lucia,
I agree that the uncorrected record does say warming is largely unabated in the last 3 decades. A 15-year moving-boxcar smoothing of the surface temperature data since 1970 ( http://www.woodfortrees.org/plot/gistemp/mean:180/from:1970 ) shows a persistent warming signal of ca. 0.5 degrees since 1980. The smoothing removes enough noise to make the warming signal clearly visible.
Lucia, Owen,
Not so fast. It seems to me that it started to dawn on a good number of people several years ago that there has been no “statistically significant” warming since at least 1998. The WMO [a statement at its 2009 annual meeting], Lindzen and several other skeptical observers aside, in the Climategate emails Trenberth explicitely complains several years back about the Team’s inability to “explain” this evident lack of warming, and Phil Jones acknowledged the absence of “statistically significant” warming in a BBC television interview a following Climategate.
I have argued this before: grandiose warmist press releases that 2010 was the “warmest year on record” [ “news” breathlessly trumpeted around by the MSM] when the actual data shows a 0.009C delta within a margin of error at least one order of magnitude larger is claptrap junk “science”. Crud, NOT science And 0.009C with that kind of margin of error is NOT statistically significant.
I suggest you have a look at the Dec 3, 2010 David Whitehouse temperature comparisons at the GWPF [david.whitehouse@the gwpf.org] for an interesting take on where 2010 actually sits on the scale.
Meanwhile, 30 year “unabated” warming both in the raw and “adjusted” data? Don’t think so, somehow.
” The smoothing removes enough noise to make the warming signal clearly visible.”
Excuse me but who says there’s not supposed to be “warming” of a constructed fraction of a degree (for a graph) during a tiny tiny tiny tiny snippet of time in an interglacial period on this Earth?
And I notice you non-experts (about Earth and its climate throughout geologic time) constantly ignore Bill Illis for example when they point out relevant flaws in this “science”.
It is 43°f here in Southern California right now and the mountains are covered with snow from the system that came through last night. I can stand by my pool and see them from my back yard. Global warming my ass.
Owen
Tamino is a Team groupy and therefore by definition suspect. Can’t be helped: as with sheep, odour wears off on those close by.
Let me put it differently: to paraphrase Roy Spencer’s wager, show me/the others here just one peer reviewed paper produced by members of the Team, GISS and their alcolytes that for the past 30 years – say the satellite era 1979-2009 – shows us 1] a downward adjustment to raw data anywhere, and 2] tells us how they arrived at their results.
Just so we are clear: what we are not looking for is for eample GISS “adjusting” 1934 downwards to make 1998 look warmer.
I, like others here look forward to reading your findings but I have to tell you, I will not be holding my breath for too long.
Owen,
.
Thanks for the Tamino link, I had not seen that. Sure wish he had included Hadley, and kept all trends on the same 1979 to present basis. Oh well, it is Tamino after all; he sure didn’t want his analysis to show a lower underlying trend.
.
Based on the volcanic adjustments he made, it looks like the underlying trend for 1979 to present is about 0.14 – 0.145C per decade. How much of this (if any) is a result of the AMO run-up over the late 1970’s to present, how much (if any) is the result of falling power plant sulfate emissions in Europe and North America, and how much (if any) is the result of rising sulfate emissions in China are (for me) the only significant remaining questions. The AMO free trend is likely over 0.1C per decade in any case; exactly how much over 0.1C per decade is unclear. The net contribution of changing sulfate emissions over the 32 years is (I think) essentially unknown, though my personal guess is that sulfate emissions will turn out to be much less important that many claim.
Owen (Comment#70146),
A 15 year boxcar average of 30 years of data? Not very interesting. Why not a 29 year boxcar on 30 years of data? Come on man.
And one might observe that 0.14-0.145C/decade is uhmm…’somewhat’ lower than 0.2/decade…
That’s a very good thing; I doubt you can spare the brain cells.
Fallacy within fallacy: tetris poists guilt by association with those that are not guilty, ignoring the obvious hypocrisy given psuedoskeptics’ history of repeated instances of every known variety of dishonesty, corruption, prejudice, and outright fraud. Power of projection, I suppose.
In five years the trend has not been .2C/decade? And you think that implies what?
Robert–
“Since 1980” is more than 5 years. Just sayin’.
Then why not say that the trend since 1980 has never been 0.2C per decade, or that the 11- or 20- year trend has never reached 0.2C per decade since 1980? You are still pointing to a five-year window of time, something I doubt would pass with you if the conclusion were less appealing. Just saying.
Somewhat is the word. From a policy perspective, the difference between 0.14C or 0.16C or 0.2C is utterly irrelevant. Any of them herald a warming trend which offers the certainty of highly costly and destructive changes, along with a variety of possible civilization-threatening disasters.
This is the essential incoherency of “lukewarmism”; the most modest estimates of climate sensitivity and speed of warming that are in any way compatible with observation fully justify the most aggressive mitigation efforts. Hence the question of who is right is essentially academic and can await more data. The case for “lukewarmism” is a case for immediate and dramatic emissions reduction and other mitigation.
Strangely, lukewarmers, seemingly enchanted with the emotional partisan game of the “Tribe” vs the “Team,” fail to realize this.
“Any of them herald a warming trend which offers the certainty of highly costly and destructive changes, along with a variety of possible civilization-threatening disasters.”
http://www.youtube.com/watch?v=GZxsR8DaPnY
Andrew
Robert
Oh? I think the rate of warming is the most important issue. I think whether the rate of warming is 0.14C rather than 0.2C matters from a policy perspective. Whether models are biased high matters from a policy perspective. And, moreover, whether the data are pointing toward the lower range of predictions or higher matters from a policy perspective.
Your simply presenting your claims to the contrary doesn’t magically make your notions correct nor does it make “lukewarmism” incoherent. Your tendency to argue by labeling people also doesn’t magically make your POV right– and it certaintly doesn’t make ti convincing!
Robert
What the graph shows is the 25-30 year trends starting in 1980 never reached 0.2C per decade. The only purpose in showing the graph is that some people might see short term trends in the previous graph and think that the failure to reach 0.2C /decade is because they are short, and so noisy. The trends in the 2nd figure I soehd areshort and noisy.
But we can also vary the start date, picking the start date for IPCC projections which are given relative to the Jan 1980-Dec 1999 baseline, it it happens we lag. I show a few years so people can see whether the current long term trend happens to be high or low relative to other trends starting in 1980. They aren’t. That’s all that graph shows.
If there are other trends with other start years that makes some point you think you want to make, go ahead and show them. Then we can discuss them and whatever point you think you are trying to make.
Robert:
I think there may be a typo above. Replace “policy” with “theology” or “ideology” and it would more accurately restate the warmist critique of lukewarmism.
lucia (Comment#70156),
“And one might observe that 0.14-0.145C/decade is uhmm…’somewhat’ lower than 0.2/decade…”
27.5% to 30% lower if I have done the arithmetic right. 😉
.
That 0.14C to 0.145C per decade represents something of an upper bound if one believes there is an underlying ~60-70 year cycle in the long term trend that contributed to the rise over the last 32 years. Unfortunately, the uncertainty in aerosols makes any conclusion that one draws from the 32 year trend not terribly informative WRT true climate sensitivity. However, if the current trend continues for another decade, then the “about 0.2C per decade” prediction from the IPC’s AR4 will be proven incorrect. I would bet that AR5 will not include any testable (quantified) predictions for anything less than 30 – 50 years out. The recent public comments of ‘widening model uncertainty’ with ‘improved models’ is I think a hint of what to expect in AR5.
I do agree with Robert though that Lukewarmerism is incoherent. The measure of Alarmism and Lukewarmerism is just a difference of degrees on the incoherence scale.
Andrew
SteveF (Comment#70154)
February 20th, 2011 at 10:04 am
Owen,
Thanks for the Tamino link, I had not seen that. Sure wish he had included Hadley, and kept all trends on the same 1979 to present basis. Oh well, it is Tamino after all; he sure didn’t want his analysis to show a lower underlying trend.
———–
Steve,
Try this link ( http://tamino.wordpress.com/2011/01/20/how-fast-is-earth-warming/ ) where Tamino updates the previous one I sent you and includes HADCRUT, but also includes solar cycles along with MEI and volcanic aerosols.
Tell me about AMO – is it not a cycle (i.e., involving reversible intra-planetary heat transfers)? If so, would it be expected to be a long-term forcing agent?
Why? Is it more important than whether the earth is warming and human activities are the primary cause?
How?
Of course, you are a long way from showing that the models are biased. The models predict an accelerating warming trend, averaging about 0.2C over the next few decades. Obviously, if the trend is acceleration, we would expect the early decades to have a trend of less than 0.2C, and the latter decades rather more, right?
Of course, 0.2C is an approximation, and we have a much more precise estimate in the form of the multi-model mean. How far off that are we? Not too far, I seem to recall.
If you did show the model had a bias, it would be what, exactly? A slight bias towards warming? 20-30% or so? How does that change anything?
Your simply asserting that a slight difference in the rate of anthropogenic warming matters from a policy perspective, without explaining how does nothing to address the incoherence of your position, and is unpersuasive in the extreme.
SteveF (Comment#70155)
February 20th, 2011 at 10:07 am
Owen (Comment#70146),
A 15 year boxcar average of 30 years of data? Not very interesting. Why not a 29 year boxcar on 30 years of data? Come on man.
———–
Steve,
In my line of work we worry mainly about the danger of the smoothing process obliterating the signal, and therefore stay away from large smoothing windows. In this case however the signal seems to be a consistent upward ramp that is best revealed by vigorously removing all noise. The up to 2-4 year ENSO cycles and multi-year volcanic effects require a wide window to remove. In any case, we can drop down to a 5-year window and still do a pretty good job of removing low frequency variations.
Robert:
Are you really that math challenged? A 30% difference isn’t “slight”.
It’s the e.g. difference between a sensitivity of 4°C/doubling of CO2 to 2.8°C/doubling of CO2. That has huge policy implications.
This has been well discussed (see Annan and Hargreave’s recent paper).
Oh, dear. Tsk, tsk, tsk. To quote our host:
You go on to assert:
How so? That is the question. I would argue that it is the difference between a mugger with 7 bullets in his clip, and one with 13. It’s of no practical importance because it does not affect the optimal strategy for coping with the problem.
Robert–
I don’t need to provide any counter explanations for things you merely assert.
I observe that 0.15 or so is less than 0.20 saying nothing in particular otherwise. In response, to the obvious fact that 0.15 is less than 0.20, you post a hodgepodge of unsupported claims that really are nothing more than you opinion. I point out that your hodgepodge of claims are nothing more than you opinion and say I happen to think otherwise.
And there we sit.
The fact I noted still remains a fact: 0.15 is less than 0.20.
Lucia, do you have a graph that plots global temps vs CO2 since 2001 or 2005?
Robert, saying a 30% difference is insignificant is math-challenged. Sorry, but it is.
And do you really need us to google why it is significant of it for you?
Simply because you haven’t bothered to do any research on it doesn’t make the original point (that a 0.14°C/decade trend versus 0.2°C/decade matters) incoherent. It just makes you uninformed.
Bob,
No. Moreover, I would categorize such a graph in the category of “stupid graphs”.
Owen:
Whether it makes sense depends on the data and the model you’re trying to test. We know that most of the large atmospheric ocean oscillations have periods of less than 10-years, and what we’re looking for is a slowly varying secular trend in temperature.
It’s easy to see from the data that 10-years is adequate, and 30-years is optimal. In fact, if you want to remove shorter-persistence anthropogenic effects like sulfates (as well as very long period climate oscillations like the 54 year PDO), it actually makes sense to grow the window to 60 years:
E.g., see this.
Robert–
Arguing by dreaming up a mysterious analogy that doesn’t seem to be a meaningful analogy also doesn’t make you very convincing.
Lucia, thanks for answering. I agree that a graph correlating(or lack thereof) temps vs Mauna Loa may not be exciting, but why do you think it would be stupid?
“I would argue that it is the difference between a mugger with 7 bullets in his clip, and one with 13. It’s of no practical importance”
Of course, it’s of practical importance. If you know he had 7 bullets and fired all of them, you can operate knowing he ran out.
Duh.
Andrew
Bob–
Because it’s not only unexciting, but tells us nothing about anyone’s claim about anything. So, it is pointless to make.
I second Bob’s request. Let’s see the graph, Lucia. 😉
Andrew
If the AMO produced a trend, they why hasn’t it done so for the past million of so years?
Lucia why is the sun all of a sudden able to affect climate? I thought it was a no no amongst you guys especially Hansen, hadcrut NOAA etc and co?
You have it exactly backwards; I have observed your failure to do any more than assert that a slightly lower trend than projected is meaningful from a policy perspective. That unproven assertion is a serious problem for “lukewarmism,” one that you have steadfastly resisted addressing.
Carrick:
Ah, more drive-by ad hominem from the formerly articulate.
I remember when you used to try and argue facts with me; I guess you just got beat down too many times to continue to engage rationally.
But, as lucia reminds us, insults aren’t persuasive (I know — why can’t she take her own advice? Sad.) I know you’re scared to engage me on the facts, but it’s time for you to man up and face your limitations — you might find you grow in the process. 😉
Robert, math challenged is a descriptive term in this case.
You claim something that is obviously significant is insignificant.
That, sir, is math challenged.
If you compare Ron’s graphs in this post and this one, the 30-year trend seems to have increased slightly between 1998 (included) and 2007, from .15 to .18. But that might just be noise. Maybe we need a p-value to be sure? 😉
Bob+Andrew: correlations with less than 10 pairs of points? Seriously?
Bob, I don’t know if this will help, but if you look at the variation in temperature over time, for periods less than 10-years, it is dominated by natural fluctuations. Making a graph to compare a slow secular drift in temperature to a large natural one would be pointless.
“math challenged”
Still, scared, I see. Oh well, I wish you well on your travels, and hope your growing up proceeds swiftly.
In a moment of solitude, you may wish to reflect that “significance” is not defined mathematically at all, unless you are talking about statistical significance, or measurement error, which no one was.
Best of luck.
toto, decadal scale is a good way to compare IMO:
To me, the implications of this isn’t that GHG forcing has stopped, but (per my previous comment) it is being “swamped” by natural fluctuations.
Robert, I already pointed you to how to determine whether it was significant or not (you’ve already been thrown a “bone”). If you can’t figure out how to use that, this tells us something about you.
At this point, if I wanted to sink to your level, I could make a comment about the “English language challenged.” However, I am not so insecure. I would rather teach you than insult you. Let the lesson begin:
1. Words can mean more than one thing.
2. Statistical significance is only one kind of significance.
3. You appear to be claiming to be able to determine mathematically whether a quantitative difference is significant in magnitude to be significant from a policy perspective. If you sit with the sheer absurdity of that claim for a minute, I think you’ll see where you went wrong.
Robert,
You appear to be jumping through hoops to argue that “significance” only applies to policy when it’s in the non-quantitative form.
This appears to be based on your earlier statement of
I think you have the wrong gun analogy.
http://letters2mindanao.files.wordpress.com/2009/04/5713-man-shooting-a-dud-gun-with-a-bang-flag-clipart-illustration.jpg
Robert, is there not a distinction to be made (policy wise) if observations do not demonstrate amplified sensitivity to CO2 beyond the direct radiative effects?
So, trying to parse this rather tortured sentence, would you be asserting that there is a mathematical rule which determines whether a quantitative difference is significant from a policy perspective? Please share.
Carrick claims to be able to prove mathematically what degree of warming implies a difference in policy (I await the fascinating math on that one). Pointing out the ridiculousness of that claim does not mean that mathematical tests of statistical significance have no impact on policy.
One might say that a statistically significant difference in a an estimate and a measurement of a quantity is a necessary but not sufficient condition for a difference significant in terms of policy.
toto,
Lucia could put up the graph and then explain to us what’s wrong with it.
Andrew
Owen (Comment#70167),
.
Too bad you didn’t link to that follow-up Tamino post in the first place, since it is much more informative.
.
Tamino did not say what the 1979 to 2011 least square tends were (shy fellow that he is), but my eye-ball guess from his graphs (really just a guess) is 0.46C over 32 years… 0.144 per decade.
.
The apparent magnitude of the longer term oscillation (AMO shows this, but visual inspection of the temperature record, and lots of published papers as well) is about +/- 0.1C variation around the underlying trend. If half a cycle is 3 decades, then the contribution since the late 1970’s could be estimated as 0.2/3 = 0.067C per decade. Which would drop Tamino’s “adjusted trend” from 0.144C per decade to ~0.08C per decade.
.
Some might argue that a factor of more than two in the “true” warming rate (0.08C versus 0.2C per decade) has no policy implications. Some would argue that those people are not being very rational.
.
More to the point, projections of extreme warming in the future are made by the self-same people (mostly modelers) who say current warming should be ~0.2C per decade. Are the models right? IMHO, it doesn’t look good for them. As Lucia (and many others) have pointed out, public policy, and the urgency of that policy, depends very much on the magnitude of future warming, especially when proposed policy reduces current economic growth in exchange for future reductions in warming.
.
Finally, as DeWitt Payne (and many others) have consistently noted, there is nothing short of exterminating most of humanity that is going to keep atmospheric CO2 from reaching at least 550 PPM. The long term policy goal of reducing the use of fossil fuels is something that is worthwhile, independent of any future warming, since humanity needs a long term alternative to fossil fuels, which are a finite resource. Forcing wealthy people to become poorer (or in the case of >25% of humanity, to remain very poor), is a complete non-starter. So please stop talking about “economic sacrifice” and start talking about economically realistic alternatives to fossil fuels. The study of projected warming from CO2 is more important in terms of evaluating the need for future adaptation than in evaluating how to most effectively impoverish the developed world. It is just not going to happen.
Lucia,
I’m a bit astonished. Are you allowing Robert’s comment about my brain cells to stand 🙂
And am I to take your lack of response as an objection to my point about “no statistically significant” warming since 1998? Can’t be. You are known to argue your point with hard numbers..
Meantime, given our respective backgrounds in academe, I would have expected you to support my comment to Owen at 70138 and my challenge to him at 70153. Care to comment?
If that were the case (and I don’t think it is) that would imply a climate sensitivity of about 1.2C/doubling. We would appear to be headed for two doublings sometime in the early to mid-22nd. That would imply a warming of 2.4C, greater than the very liberal estimate of 2C for dangerous warming. Hence, aggressive mitigation efforts would be called for, starting now.
Shaw:
That is alarmism of the worst sort, and entirely at variance with the estimates of all the economists that have studied the issue. Where is your proof, or even your argument that this is the case?
Owen,
Thx for your concern about my brain cells. They’re fine you’ll no doubt be glad to learn. Have in fact been for many years and still are, but thx again.
How about actually responding, ever so briefly and to the point, to my challenge at 70153. It would do wonders for your credibility all around..
Robert, is the direct radiative effect of CO2 a linear climate response?
Why is it some of you lot have a hard-on about 30 year trends? It is less than the blink of en eye as far as the planet is concerned. The observed warming since 1850 has been appx 0.8 deg C. 30-year trends are misleading within this context. Take a look at the actual HadCRUt3 (unadjusted) trend figures since 1850:
1850 – 1878 = 0,112 deg C per dec (Cpd)
1850 – 1944 = 0.06 Cpd
1850 – 1998 = 0.067 Cpd
1850 – 2010 = 0.057 Cpd
The dates after 1850 represent the highest peaks of the HadCRUt3 temp dataset.
You will notice that the trend up to 2010 is way shallower than the trend to the first peak in 1878. Of course there have been short-term trends that have been steeper in between the start and end of the dataset but unless they affect the overall trend (from the start) in a significant way, they remain of minimal relevance as interim trends. If the trend was increasing significantly, the overall trend would be getting steeper. It is not. The trend to 2010 is lower then the trend to 1998 which is lower than the trend to 1878!
Robert talks about [“…the most modest estimates of climate sensitivity and speed of warming that are in any way compatible with observation fully justify the most aggressive mitigation efforts.”]
When the observed warming amounts to less than 1 deg C in 160 years, and is currently rising at a decreasing rate, I suggest that ‘the most aggressive mitigation efforts’ are nugatory.
Talk about not seeing the forest for the trees! Why don’t you just accept the data for what it is, and quit applying your own dogma and assumptions to make it fit your preconception?
The reference for the dataset is here:
http://www.cru.uea.ac.uk/cru/data/temperature/hadcrut3gl.txt
No credible projections produce lower than 550 PPM, in spite of what some might hope.
http://www.ipcc-data.org/figures/ipcc_ddc_co2_all.jpg
.
The actual emissions growth (close to A1B) over the past 15 years suggests CO2 concentrations topping 700 PPM. Seems a reasonable guess. The world will not come to an end. Humanity will be too wealthy to let that happen.
Uhmm… I was watching tv and knitting….. It’s on a commercial. I’m going to go back and watch some more now….
Robert (Comment#70195)
February 20th, 2011 at 2:05 pm
It seems that this all started with your cumbersome insistence that policy decisions are based on being able to distinguish between “slight” changes in warming and “significant” changes in warming.
Since you are specifically leaving statistics off the table, that leaves us with your opinion versus mine.
BTW, your repeated attempts to claim that you are “winning” the argument by implying that others are being unclear brings to mind the term “deliberately obtuse”.
Luica,
“I was watching tv and knitting….. It’s on a commercial. I’m going to go back and watch some more now….”
.
Ouch.
John M, I beg to question the placement of “deliberately” together with “obtuse” in Robert’s case.
I expect Robert to do his own heavy lifting. Not my responsibility to bring him up to speed.
“Uhmm… I was watching tv and knitting….. It’s on a commercial. I’m going to go back and watch some more now….”
Hey, the planet is in Global Warming crisis! We have to do something! We can’t just sit around and watch TV!
Unless that show with Jennifer Love Hewitt is on, of course, then we can. Hubba Hubba.
Andrew
Lucia —
I set up an Excel spreadsheet, filled it with Hadcrut3 from your link, and quickly replicated the curves above (well, the Hadley ones anyway). But on fooling around with it a little bit, I noticed something which struck me as unexpected…
In your graph of (linearized) warming rate since 1980, the Hadcrut3 line moderates from .018 (deg C/yr) in 2005 to .016 in 2011. That seems logical enough, given that the trend from 2001-present is 0, or nearly so. But if you do the same exercise starting in 1950, the rate is around 0.010 over the 1950-2000 range, but goes up steadily through the 00’s until it reaches 0.012 over the 1950-2011 interval. Given the relatively flat trend since ’01, it seems counter-intuitive that the trend line should be increasing; my expectation was that it would decrease slightly, as the trend-since-1980 did. (But less so, as the 00’s represent a lesser fraction of this larger dataset.)
You’ve obviously done more of these trendline calculations — do you have a simple explanation of this behavior? Thanks.
SteveF
As you are no doubt aware, the geological record is pretty clear in telling us that the earth has seen CO2 ppmv levels of 7000 with intermediaries anywhere from 3000-4500 over thepast 5 billion years or so. N.B. without temperatures much above what we have now.
Turn that around, at 380 ppmv we are very close to the absolute CO2 lows in the geological record. The eco luddites have for the past 25 years been whipping up a pseudo scientific political froth based on the story line of “man-made” and “man-made” only CO2 [no other C02 need apply] causing irreversable and all consuming Armeggadon based on an increase from 270 to 380 ppmv over 150 years.
Colour and shape shifters as they are, politicians of all stripes around the world have [or are in the process of] ditched the AGW/ACC siren song. Problem is temperatures have not been behaving as directed by the IPCC for well over a decade now, and the great unwashed are no longer buying. 4 out of 10 bushells of US corn go towards making ethanol we don’t need, while folks dependant on corn for food go hungry around the world. Spain, France, Sweden [to name but a few] having witnessed the “benefits” of obscenly subsidized “green jobs”, many billions of dollars later are ditching them as fast as they can, and the lefty “Europe is the way to salvation” jurisdictions in North Amnerica are following suite.
And here we are debating whether or not global temperatures in 2010 were higher by 0.009C than in 1998… blindly sidestepping whether that is relevant or not.
“Climate science” having been exposed for the crud it is, the only bones in the real world left to fight over are the political ones, and there I dare say the “dark forces of evil” [represented here by yours truly 🙂 ] are winning hand over fist..
History teaches us that if we really have a problem, homo sapiens is the most adaptable species the earth has seen to date and we will in short order work out a way of adapting. And Darwin has shown us that we are surely not the only ones.
HaroldW (Comment#70209),
It is a consequence of the least square fit trend. More “high” data point vales can increase the long term trend, even if during the added years there is no additional increase. To see this, consider a perfectly flat trend for 40 years, followed by 5 points at a constant higher value, the trend will be slightly “upward” due to the last 5 points. Now add another 15 points at that same higher value…. now the calculated overall trend is larger, even though for “15 years there was no increase”.
SteveF —
Well, yes, but — if you have a straight line at a given slope, followed by a horizontal section, the trend over the slopey bit will (obviously) follow the slope, and as the interval includes more and more of the horizontal section, the trend line will decrease. I guess what you’re saying is that the 1980-onwards case is more like what I’ve just described, and the 1950-onwards case is more like the one you’ve outlined. Thanks.
tetris (Comment#70210),
.
Despite the fact that I think many in the eco/green loony fringe movement are terribly misguided, and despite the fact that for most, forced impoverishment of the developed world is a politically and philosophically positive (rather than negative) consequence of immediate and draconian reductions in fossil fuel use, I do not doubt that most believe what they say about global warming. Terribly misguided, but well intentioned.
.
I do not think that these folks have it in them to say the same about anyone who disagrees with them. That difference dooms them to failure, for it makes them incapable of compromise. For them, the practical is always the enemy of the perfect; it is always so with zealots. Like the anarchists near the start of the last century, and like the communists that followed them, their time will soon pass.
@ HaroldW (Comment#70209)
Harold,
I’ve just had a quick look at your dates on the dataset I linked earlier and have come up with the following:
1950-2000 = 0.112 deg C per dec
1950-2010 = 0.107 deg C per dec
Similar to yours but in a more intuitively correct sense possibly?
tetris (Comment#70200)
February 20th, 2011 at 2:23 pm
Owen,
Thx for your concern about my brain cells. They’re fine you’ll no doubt be glad to learn. Have in fact been for many years and still are, but thx again.
———–
I said something about your brain cells??
SteveF
I don’t mean it to be “ouch”. I just can’t be moderating every single minute. I’d like people to not call each other names or insult each other… but I’m just not here to catch everything.
Luica,
.
I was not suggesting that you should moderate all the time. I understood your comment as meaning you were less than very worried about tetris’s brain cells. Sorry, I misunderstood.
Sorry if it sounded that way. I think tetris can defend himself against Robert just fine.
Arfur,
That’s odd…I got my Hadcrut data from http://hadobs.metoffice.com/hadcrut3/diagnostics/global/nh+sh/monthly rather than your link http://www.cru.uea.ac.uk/cru/data/temperature/hadcrut3gl.txt , but it seems to contain the same values. [File formats differ: in the first link, the first column after year/month is the global average, and each month is a separate line; in the second link, each year is a line (well, 2) with months arranged in separate columns.]
For Jan 1950-Jan2000, I (well, Excel) got a trend of .0100 degC/yr; for Jan 1950-Jan2011, trend is .0117. (To 3 significant digits, same as Jan 1950-Jan2010.) I don’t understand why the linear trends differ from yours.
Re: Robert (Feb 20 14:14),
Alarmism, how so? What economists and where? Stern? It is to laugh. For the argument, I suggest you read The Climate Fix by Roger Pielke, Jr. Or go to his blog and start reading the archives. In short it’s that the technologies to replace fossil fuels are still way to expensive so they aren’t going to be implemented any time soon and the alternative, a massive and rapid reduction in the standard of living of the developed world, is not going to happen either. Meanwhile, the fact that over 1 billion people today have no access to electricity at all is morally unacceptable. Again, the only practical solution to this problem involves burning more, not less fossil fuel.
You only have to run fairly basic numbers to see that a reduction in total CO2 emissions of 80% by 2050, which is required to stabilize at 450 ppm, (IPCC AR4 figure 10.21) requires the commissioning, starting right now, of one 750 MW nuclear power plant per day for the next 40 years. I don’t see that happening, do you? Even then, we’ll probably still need breakthroughs in things like battery technology.
Adaptation is the only sensible answer right now. We need to make society more flexible, especially in the areas in the less developed world that are already maladapted to current conditions. That’s a no regrets solution. It helps people now rather than possibly making their descendants slightly less miserable sometime in the distant future.
Re: SteveF (Feb 20 14:38),
That assumes that there’s that much economically recoverable fossil fuel. There are a significant fraction of the IPCC scenarios in the A family that have oil production in 2100 as high or higher than today. I don’t think so. The estimates for coal are equally over optimistic. Natural gas remains to be seen. I’ve seen these recovery technologies over-hyped before. 550-600 is more reasonable IMO.
Robert —
Having just had my attention drawn to your post (Feb 20 14:14), may I ask how you extrapolated to two CO2 doublings by “early- to mid-22nd century”?
The rate of increase has been approximately 2 ppm/yr for a while now. See http://www.woodfortrees.org/plot/esrl-co2/from:1990/to:2010/mean:12/plot/esrl-co2/from:1990/to:2010/mean:12/trend
Taking the baseline pre-industrial value as 280 ppm, and rounding the current level to 400 ppm, to complete the first doubling (to 560 ppm) will take about 80 years [i.e. 2090], and the next doubling (to 1120 ppm) will take a further 280 years [2370] at that rate.
Harold,
Yep, its odd. I thought it just might be the difference between yearly figures and monthly but when I use the monthly figures I get Jan 1950-Jan 2000 = 0.013 C/yr and
Jan 1950-Jan 2011 = 0.011 C/yr!
I’m really not sure why, but my figures do seem to support a decreasing trend…
But I’ve been wrong before [well, once, but I think I got away with it! 🙂 ]
Got to get some kip now… early start tomorrow.
Re: HaroldW (Feb 20 17:05),
But the rate of increase isn’t constant. It’s increasing exponentially. It was less than 1 ppm/year in 1960. The annual rate of increase from an exponential fit is expected to be 2.6 ppm/year in 2020, 3.0 is 2030, 3.5 in 2040 and 4.1 in 2050. That gets you to 560 ppm in 2060 or so. 1120 would then be 2126 at which point the rate of increase would be 14 ppm/year. Of course that represents a mind boggling seven fold increase in fossil fuel consumption. I seriously doubt that’s in the cards.
DeWitt —
Thanks. I posted too quickly, and only then read the intervening posts (after 14:14), seeing e.g. the reference to IPCC projections such as A1FI. (http://www.ipcc-data.org/figures/ipcc_ddc_co2_all.jpg)
So now I understand from whence Robert got those projections, but I agree with you that such extrapolations (exponential!) over such a long period are highly speculative. [Just think how rich I’d be if the stock prices kept going up as they did in the 90s!]
DeWitt Payne (Comment#70225) February 20th, 2011 at 5:30 pm
“But the rate of increase isn’t constant. It’s increasing exponentially.”
The price for a tonne of 5500 kcal/kg has increased 400% in 8 years on global markets.(The US market is protected due to the fact that Gillete, Wyoming is landlocked).
How does one get a geometric emissions scenario if the price of the most common fossil fuel is also increasing geometrically?
Another 400% price increase and no-one will be discussing solar panel subsidies, we will all be nailing them to our roofs in order to ‘save our wallets’.
Economic substitution is business as usual, a cheaper prodcuct comes along and we use that instead.
Already nuclear power is cheaper then burning coal in most of the world. There are some issue related to industrial capacity. Japan Steel works, the leading manufacturer of nuclear forgings could only churn out 4 sets in 2008, they will have bumped that up to 12 sets in 2012. Other various competitors are coming on line bumping global capacity to 24 sets per year in the 2012 -2015 timeframe.
In order to ‘flatline’ emissions from electricity generation, the fasting growing energy segment(2.9% per year) one needs to add 580 terrawatt of clean generating capacity per year.
A 1,000 megawatt nuclear plant(we don’t build 750’s anymore) produces 8 terrawatts per year.
So to hold emissions at current levels we need to build 72 nuclear plant equivalents per year. One plant every 5 days.
In 2005 we(the world) had one nuclear construction start every 56 days, in 2010 we had one construction start every 28 days. Two more doublings gets us to 1 start every 7 days. It’s not realistic to believe the nuclear industry can double faster then once every 5 years.
IMHO It’ll be around 2020-2025 before the global nuclear industry can keep up with increasing energy demand in the developing world. Every nuclear plant that can be built is currently being built, there is a parts shortage that will take years to fix.
Europe currently has to import 40% of it’s coal. Japan and South Korea have to import 100% of their coal. Vietnam has 3 years worth of coal left. China and India are net importers.
It only makes sense that those countries that don’t have sufficient coal to meet domestic energy needs gets ‘first dibs’ on nuclear reactor forgings. Building a coal fired plant when you have to import the coal is really, really financially stupid.
The US has plenty of coal to meet our current needs. Getting a few demonstration plants up and running while waiting for the parts situation to sort out isn’t that bad of a plan. Rushing into a crash build program will just start a parts bidding war.
Put 0.194C for Jan 2011 on this IPCC chart (predictions from Far, Sar and Tar which are on the same baseline as Hadcrut3 currently uses and was reproduced in AR4).
http://www.ipcc.ch/graphics/ar4-wg1/jpg/ts26.jpg
Not hard to see how inaccurate the climate models are on shorter time-scales.
As a short-cut, I used a chart someone else annotated and added the recent numbers to it.
http://img80.imageshack.us/img80/7416/ipccpredictions1.png
harrywr2 & DeWitt –
Regarding exponential growth in pCO2, as mentioned above this seems dubious in the long-term future. But even in the historical data that we have, it doesn’t look exponential to me. Here is the change in CO2 concentration per year, in ppm:
http://www.woodfortrees.org/plot/esrl-co2/compress:12/derivative
The 2nd derivative (the graph is already of the first derivative) is positive; as DeWitt mentions the increase is ~1 ppm/yr in the 1960s and ~2 ppm/yr now. But the third derivative seems negative, as if the rate were approaching an asymptote. Note: I’m not making a prediction of asymptotic behavior, just commenting that the 3rd derivative is negative, while exponential growth requires that all derivatives are positive.
DeWitt Payne (Comment#70222),
I have talked with engineers who work at the Canadian oil sand projects, and a few who work in coal mining. They tell me that recoverable reserves are (if anything) very conservatively evaluated. Could they be wrong? Sure, but I am very cautious about discounting the word of ‘on the ground’ engineers (OTOH, company PR is dubious at best). There is an awful lot of fossil carbon that becomes recoverable at >US$100 per barrel energy equivalent price.
Illis: I used a chart someone else annotated and added the recent numbers to it.

.
Really? Adding the Jan 2011 temp as an annual mean? 😆
Here is my attempt
http://rhinohide.org/gw/publications/ipcc/ar4/img/ts26-updated-2010.jpg
.
I’ve added it to my wall of predictions
http://rhinohide.wordpress.com/resources/paleoclimate/anthropocene/predictions/
Re: SteveF (Feb 20 19:07),
Would that were true of petroleum. We know OPEC’s official estimates are bogus because there’s incentive to overestimate. Production quotas are based on official reserves. Exxon recently reported that for the last decade they’ve only been able to replace 95% of consumption with new reserves. Anything other than light crude, e.g. tar sands, coal to liquid, gas to liquid, will need a massive capital investment and lots of time to produce in significant quantities. Sure it can be done, but can it be done fast enough?
Re: HaroldW (Feb 20 18:55),
Third derivative??? Confidence limits on the value?
Re: harrywr2 (Feb 20 18:18),
I assume you mean by flatlining, keeping emissions from increasing. But to stabilize concentration, emissions have to be reduced to very low levels. All coal, oil and natural gas burning electricity generation will have to be replaced by non-carbon emitting plants. Then there’s transportation and all the other uses of energy plus cement making. I think that gets you to a new 1.5 GW plant every other day. In the end, it probably means air capture and conversion of CO2 back to hydrocarbons with electrolytic hydrogen.
harry:
Economics of fossil fuels is the speed limit on how fast we can burn fuel, and why an exponential law isn’t expected to hold.
(In fact if you look at the data, the data don’t look exponential either… at least since 1980.)
Get ready for a real shocker guys
http://www.accuweather.com/video/793604479001/a-week-of-global-cooling.asp?channel=vbbastaj
reality will bite hard this year and a lot of people will lose money on stupid bets
Robert.
take Carrick’s advice and read Annan and Hargreave’s recent paper. You’ll see a methodology for estimating cost in GDP from Temperature increase
Here:
“To examine the economic consequences of climate change, we use the
damage function of the DICE model (Nordhaus, 2008) to provide an estimate
of the consequential economic loss due to climate change on the global scale.
According to this model, climate change is estimated to cause a loss of the
form C (T ) = 0.284T ^2
where C (T ) gives the loss in percentage of global GDP
as a function of the global mean temperature change T .
DeWitt (#70235) –
In your #70225, you wrote “the rate of increase [of pCO2] [is] increasing exponentially”. With regard to the *rate* of increase, I’m talking of its second derivative. [It’s the 3rd derivative of pCO2, which is what I stated, perhaps not clearly, in #70231.] And while I’m not trying to give a best estimate for that figure, nor its uncertainty [I’ll leave that for Ryan or Steve 🙂 ], please look at the following plot of the year-on-year increase:
http://www.woodfortrees.org/plot/esrl-co2/compress:12/derivative
It’s a little hard to see what’s happening, so let’s take a 5-year average of the year-on-year increase, to smooth out the jaggedness a bit: http://www.woodfortrees.org/plot/esrl-co2/compress:12/derivative/mean:5
The rate of increase is positive, and it’s certainly getting larger year by year. But does it look like it’s *exponentially increasing*? Exponentially increasing means that all of its derivatives are positive. If you fit a quadratic to that curve, would you think it’s going to be concave-up or concave-down?
It looks like it’s concave-down, and Excel says it’s concave-down. OLS quadratic curve fit is:
rate of increase (in ppm/yr) = 1.873 + .0203*(yr-2000) – .0002*(yr-2000)^2. If this trend were to continue*, the increase would max out around 2050 at around 2.4 ppm/yr.
*No, I don’t believe that extrapolating such fits for such a long period provides any sort of reliable predictor. But it would seem to be more justified than extrapolating the pCO2 increase as an exponential.
Going back to the unsmoothed data (first link), the concavity is not as obvious to the eye, but a least-squares quadratic fit gives pretty much the same values as we saw above:
1.816 + .0191*(yr-2000) – .0002*(yr-2000)^2
[As an aside, there are two years in the early 1990s which have abnormally low changes in pCO2 (below 1 ppm/yr while the surrounding years are around 1.3 & 1.7). Perhaps due to Pinatubo? Anyway, if I excise those two values, the quadratic fit gives the rate of increase = 1.879 + 0.0159*(yr-2000) – .0004*(yr-2000)^2. I.e., a stronger deceleration term. No, don’t read anything into that…I was just wondering if the unusual event — whatever it was — which interrupted the relatively steady growth of pCO2 was affecting the fit. It does have an effect, but not one which changes the qualitative results.]
Originally posted by Robert
That analogy suggests that you regard any warming at all as unacceptable. Is that in fact the case? Some people have made the argument that a little warming will be overall beneficial. I’m not convinced either way and given the choice I’d prefer not to make the experiment, but I’m afraid we’re stuck with at least some warming. I am convinced however that curbing of fossil fuel use will cost some lives and cause some misery. I don’t give a damn about rich westerners such as myself no longer being able to fly or having to carpool in electric vehicles – we’ll cope. I do care about the developing world cooking with kerosene rather than wood/dung, or having access to artificial fertilisers and pesticides, or being able to sell their products on the world’s markets
I’d be interested to know what in your view the “optimal strategy” is. I think we have to balance how draconian we are in the decarbonisation of the world economy against the harm the warming will cause. It’s in this context that 30% less warming than currently predicted is important – it changes how fast we need to decarbonise, and transitions are always easier if they are more gradual.
SteveF [70232] and DeWittPayne
DeWitt Payne and I have had a couple of useful exchanges around the topic of hydrocarbon fuels -availability, rate of extraction, etc.
I too have contacts in the oil sand “patch” who confirm your point: that is that the approx 180 billion barrels quoted regularly are “SEC’ numbers, i.e the most concervative number the stock exchange regulators will allow companies to use in public. Those who work in the oil patch will tell you that it is pretty much accepted that -N.B. with current technologies – recoverable reserves are probably 5 times that.
As per a report published in May 2010, Canada has recoverable gas reserves of 4000 trillion cu ft, equivalent to approx 600 billion barrels of oil. The US numbers are approx 20% of that.
Why is this important? Because these reserves will be accessed and used, simply because there are no alternatives. This holds even more so in the face of what is unfolding in North Africa and the Middle East. And the fact -lest we forget- that there still is no demonstrable causal relationship between CO2 emissions and temperature -other than on a “calculator” based on supposedly understood insights into sensitivity. On that note, the 2008 Nordhause study referred to by Mosher has been severely criticized for introducing the same type of false formulaic, deterministic relationship between loss of economic growth due to climate change.
In the end it all boils down to the fact that there exist no alterbatives to hydrocarbon fuels, something e.g. the Chinese and Indians and Brazilians, and a few others understand all too well.
More crap from Nature
http://wattsupwiththat.com/2011/02/20/nature-unleashes-a-flood-of-bad-science/#more-34439
Just the usual Willis rant.
Re Ron and Illis
The IPCC AR4 ts26 graphic used the baseline 1980-1999 didn’t it?
So is it appropriate to use the Jan figure of 0.194?
Lucia has graphed using this baseline and Jan comes in at about 0.05 (what is it exactly?). Isn’t this figure more suitable?
Tetris,
I can agree with most of what you say, but not this:
“And the fact -lest we forget- that there still is no demonstrable causal relationship between CO2 emissions and temperature -other than on a “calculator†based on supposedly understood insights into sensitivity.”
It is true we do not know the true climate sensitivity. However we do know that adding GHG’s to the air must warm the surface by some amount. While I agree that many (indeed most) estimates of climate sensitivity are based as much on wishful thinking as on data, IMO it would be unwise to completely rule out the possibility of significant CO2 driven future warming. Figuring out an accurate value for sensitivity to radiative forcing remains important, if only to better understand the potential cost for adaptation.
“However we do know that adding GHG’s to the air must warm the surface by some amount.”
Only if All Things Are Equal, SteveF. The Squiggly Line still goes down sometimes, too.
Andrew
tony s: IPCC AR4 ts26 graphic used the baseline 1980-1999 didn’t it?
.
Good question. Not sure. But the HadCRUTv3 Global 1990 value is .248 and its 1998 value is 0.529 which seem to line up with the values displayed for those years in ts26.
.
tony s: Isn’t this figure more suitable?
.
I’m not sure if you are asking if using a one month value as an annual mean is suitable, but if you are, I don’t think so.
steven mosher (Comment#70239) et al.
Sheesh like you all really care.
FEB 11, 2011 by â– Lynn Herrmann
Mexico loses 80-100% of crops to freeze, US prices to skyrocket
The freezing temperatures were the worst the region has seen since 1957. Read more: http://www.digitaljournal.com/article/303583#ixzz1Ebb8UVNi
And on a different note: just paid $5 dollars for four rolls of toilet paper at the grocery store yesterday (same brand and package size we’ve been buying for years) that last year cost just over $3
Liza–
I have to admit I don’t even know what I paid for toilet paper last year. Still, I suspect the rise in toilet paper prices is unrelated to freezing vegetables in Mexico.
lucia (Comment#70255) February 21st, 2011 at 9:25 am
Um duh. Are you really that disingenuous in real life or is global warming discussions that calls for that sort of behavior for it to feel good for you? especially if I bring up FREEZING?
What does “on a different note” mean to you?
Liza,
The Blackboard isn’t as helpful as it used to be.
Andrew
Liza–
I thought the “different note” was at least in the same tune– the one having to do with ‘FREEZING.’ Out of curiosity, why the heck did you bring up the toilet paper? Was there any point, or is this just some stray factoid about your life?
This isn’t nearly as interesting as the price of toilet paper, or the relative future value of quatloos vs. US dollars, but Bob Tisdale has a neat post on SST near the US coast. The waters are colder than they have been in 40 years, or so. Might that affect US air temperatures?
http://bobtisdale.blogspot.com/2011/02/recent-drop-in-sea-surface-temperatures.html
lucia, I am trying to point out REALITY. Mosher et al up there talking about “warming” and what it does or may do to people as if they really care about “people”. When REALITY is that right now (which is all that exists in reality) freezing may be causing hardship to people. RIGHT NOW Don B points out that waters are colder then they have been in 40 yrs.
Liza–
As far as I can tell, the reality (or even REALITY) is that freezing in Mexico is unrelated to the recent $2 price rise in your favorite brand of toilet paper.
Ron,
Hadcrut3 uses 1961-1990 anomalies
http://www.cru.uea.ac.uk/cru/data/temperature/
So the rebaseline figure is required to insert in graph ts26.
Lucia can you please give us the figure for Jan anomaly 1980-1999 baseline used in your first graph?
bugs:
There are limitations to that study, I think even Gavin admits to that, and Willis does manage to hit on some of them. It’s not a terrible study, but the part they get right was known already, and the part they are presenting as novel either poorly substantiated or plain wrong. That doesn’t sound familiar does it?
This won’t prevent the AGW crusaders from coming armed to the verbal teeth ready to defend it of course.
lucia, DUH! ” when you say “on a different note” it means that you are changing the subject from whatever you have been discussing, to something else that is unrelated
tetris:
You can continue to repeat this until you are blue in the face, but you’d’ still be as wrong. We know a casual relationship exists and you are allowing your prejudices to lead you to the wrong conclusion.
Actually, liza just has the nerve complaining about other people trying to move the thread away from her uninspired thread-jacking attempts. (toilet paper??? really???)
liza has already admitted the only reason she posts here is to get a rise out of people. I’m sure the same is true of good old Andrew_KY.
No Carrick. You just proved the point I was making and it was a subject being discussed “economic consequences of climate change,” You as in ‘et al” don’t care about anybody’s hardships at all especially if it involves freezing.
And Edit Add on: prove to me that the cost of toilet paper has NOTHING to do with Climate Change regulations. At this point I have no idea but I can guess. It might just possibly have to do with some sort of regulations, cost of trucking, gasoline etc. Holy cow.
“I’m sure the same is true of good old Andrew_KY.”
Carrick,
I comment here because I think Global Warming is a fraud, and it’s interesting to talk about, because so many Smart People try and defend it.
If that gets a rise out of you, that’s your issue. 😉
Andrew
I’d continue to look up the reason for toilet paper costs on the rise and inform us all but I just read: that a recycled toilet roll uses “1.1g of carbon” compared to 1.8g for a standard toilet roll. And that Google declared earlier this year that each Google search generates 0.2g of CO2. So now we know that using one sheet of recycled toilet paper has the same carbon footprint as performing five-and-a-half Google searches.
AndrewKy exactly.
liza —
long term price of toilet paper
Short term price of toilet paper
I don’t know why the prices rose in your neighborhood. But evidently, Google thinks they peaked in 2009.
(Note– that time line isn’t literally the price of toilet paper. I have no idea what google is trying to report with those timelines.)
Re: HaroldW (Feb 21 00:56),
I fit the MLO data with an exponential function with the coefficient in the exponent increasing linearly with time. It’s a very good fit. However, you don’t start to get significant deviations from the fit and the various IPCC scenarios until 2020-2030. Even with smoothing, I find it hard to believe that the third difference doesn’t produce data that tests as random. And of course, smoothing introduces its own artifacts like increased autocorrelation.
Carrick
You are right: there exists a “casual” relationship between CO2 ppmv values and purported warming. A relationship that has been all too casually propagated by the AGW camp for the past 25 years. However, until further notice [and without facial discoloration on my part] we have no demonstrable causal relationship between [observable] increases in C02 ppmv values and increases in temperatures, even if as SteveF notes increased GHGs “MUST” [should, ought to,..] lead to higher temperatures.
In fact something interesting has been happening for several years now that [strangely] has not illicited much comment. 1] We observe steadily increasing CO2 concentrations. 2] Curiously, this steady rate of increase does not appear to be notably affected by the very rapid increase in actual anthropogenic CO2 emissions for the period. And 3] that development – which is puzzling all by itself – is occuring against the backdrop of statistically steady global temperatures since 1998 – including first indications of what appears to be a slight downward trend over the past 5 years.
In short, rapid increases in actual anthropogenic CO2 emissions do not appear to affect the rate of increase in atmospheric CO2 concentrations, and temperatures have not been increasing for a statistically significant period.
I would say that until we have a plausible and verifiable explanation for that particular three way correlation, we should put a hold on arguing that increased CO2 either MUST or actually DO cause increased temperatures.
Lucia:
I think it’s the amount of documents from each year containing the phrase (suitably normalized). Supposedly it tracks the “interest” in whatever you’re searching over time.
tetris:
Curious how you define that 🙂
tetris:
To be technical, there is a demonstrated relationship between CO2 ppmv and radiative forcing. The physics that associate the doubling of CO2 with an increase of 1-1.2 °C increase in global average temperature are on extremely solid ground, as is the atmospheric physics associated with water vapor feedback that give rise to as much as an additional 1.3°C of warming per doubling of CO2. [Follow the link, you’ll see even among skeptics you hold a small minority opinion, and one that’s easily shown to be wrong to boot.]
There are many other important forcings and feedbacks that aren’t nearly as well understood, and these could substantially modify the net environmental sensitivity to CO2 increases, but it’s just erroneous to claim that no causal relationship exists: It simply demonstrates you don’t know what you’re talking about.
As to the other: The hazards of trying to look at short-term trends to deduce anything about slowly varying forcings like CO2 has been discussed nearly ad nauseum. I usually advocate 30 year trends, but 60 year trends are more conservative (since they are less sensitive to PDO oscillations and shorter time-scale anthropogenic drivings like SO2 emissions.)
Until you grasp the fact that there are natural sources of climate fluctuation over periods of less than 10-years about the baseline temperature that are large compared to the change in that baseline from changes in anthropogenic forcing, you are doomed to continue to repeat the same fallacious arguments.
toto:
.
I'm thinking he misspoke on that one. I'm not sure what a "statistically significant period" means either. I'm guessing he was trying to say that the warming hasn't been statistically significant for a "significant period" (e.g., a decade).
Andrew_Ky:
I’ll take your word for why you comment here, but you never have anything new to say, and much of what you post is unrelated to the thread being discussed.
Seems like you’re more interested in disrupting the discussions than you are in discussing why you “think” (using that word loosely) AGW is a fraud.
“there are natural sources of climate fluctuation over periods of less than 10-years…”
Carrick,
…and more than 10 years.
All the Deep Time Squggly Lines I’ve seen fluctuate all over the place for periods of time longer than 10 years. No people around, either. so they say.
Andrew
Lately, I’ve been tempted to tweak a plugin to change Andrew_KY’s ‘name’ to “Andrew_’squiggly line’_KY”
What does that even mean, Andrew? (Other than you are a creationist/Young Earther and don’t believe in the “Deep Time squiggly lines” either?)
Carrick,
Please don’t go all Deliberately Obtuse on me like Lucia does.
It means natural variations occur on timescales longer than 10 years.
(sigh)
Andrew
Andrew_KY I think it’s fair, if the reasons for not believing something are religiously motivated, for you to state that so people don’t bother trying to “convince” you on the grounds of rational argument.
The fact that natural variation happens on time scales greater than 10 years implies absolutely nothing in itself wrt to the discussion of AGW.
DeWitt:
A simple quadratic fit of MLO CO2 to time also fits as well as you could expect anything to fit. I think that’s the danger is “fishing for models” in data:
I would think a realistic model would include economic effects such as price increases due in increased market scarcity
In any case, it’s not uncommon when expecting nonlinear saturating effects to see initially exponential growth. E.g., this is a fairly common form:
$latex {\displaystyle 1 \over \displaystyle \sqrt{1 + \alpha \exp(-t/\tau)}}$
“The fact that natural variation happens on time scales greater than 10 years implies absolutely nothing in itself wrt to the discussion of AGW.”
Yes it does. It makes your statement of
“there are natural sources of climate fluctuation over periods of less than 10-years”
ummmmm… inadequate? 😉
Andrew
Andrew, not at all.
You have to compare the magnitude of the fluctuation compared to the expected change in base line temperature. See my comment about the pointlessness of this discussion with you.
Stephan (Comment#70184) February 20th, 2011 at 1:22 pm
The sun has always been able to affect climate, and it often does. If it’s in a steady state, and not changing, it’s not going to be changing climate. The has had a cooling effect in recent years, if anything, but it’s still getting warmer.
“You have to compare the magnitude of the fluctuation compared to the expected change in base line temperature.”
‘Expected change’… which is…?
Andrew
Carrick
A couple of points: I am aware of what the basic GHG physics are purported to tell us. I am too, aware of your views about the “ideal” time line for “trends” [which by your definition excludes whatever we have been seeing over the last 33% of the 1979-2009 30 year period]. Food for thought.
I am also all too aware of your habit of talking down to me, which is getting to be pretty annoying. Once and for all – because there is only so much value in qualifying oneself- : PhD International Political Economy, head of interational risk for a major bank, 25 years of venture capital investments, founder/CEO/Chairman of five high technology companies, 25 board positions internationally and a few other bits and pieces. Ergo: I learned the hard way the value of being a skeptic.
That said, why don’t you suggest some coherent first answers to the three way issue set I highlighted in 70274 without ad homs or otherwise pissing in my boots?
Lucia,
Re 70219
Yes, tetris can surely stand up for himself.
Where it continues to be difficult is in the face of clear ad homs directed at tetris. Which has happened more than once here, something noticed by more than one observer posting here.
Either ad homs are OK here, in which case I will feel free to fire from all [proverbial] four barrels, or they are not. In which case you need to stamp out the bad habbits of some of your denizens.
DeWitt, before you take Roger too seriously, go look at how many power plants come on line and are retired each year. When you realize that the numbers he throws around are for a thirty year period over the entire globe, and that per year per country, the growth/replacement rate is about what we need to switch over to a mix of nuclear/solar/wind, the little man in the hat says goodbye.
tetris–
I discourage ad homs. But I am not always here and was not here at that time. So, some are going to get through, and I’m not going to catch them all. I didn’t catch that one.
I think you might have noticed that I had already chastised robert for previous behavior. Robert seems frequently unable to come up with real, coherent, fact based arguments, and often resorts to calling people names etc. I’m hoping at some point, he will learn to make better arguments. I hope you won’t lower yourself to his childish level just because he doesn’t want to do the work to think, while you are able to do so.
Owen
Any progress in finding the peer review articles I suggested you find for all of us at 70153?
Eli
My dear Rabbet, you should stop eating at the local mary-jane grow-op.
DeWitt Payne’s numbers are well within what is understood to be required in terms of nuclear plants to replace current “dirty CO2 polluting” energy production.
The very notion of shifting to wind or solar to replace what we get from hydrocarbon fuel sources is by now so rejected it’s getting tiresome.
Globally, we’ve by and large been using up more hydrocarbon fuels in the last 30 years than in the 60 years before. Temperatures since 1998 however, have refused to play ball.
Some people tell me you teach. Care to explain to all those gathered here how come, without resorting to a brush-off?
That is below my prediction 0.264 ( http://www.climateaudit.info/data/uc/GMT_prediction.txt )
Two out of 30 are now outside the 95% prediction interval :
http://www.climateaudit.info/data/uc/HADCJan2011.png
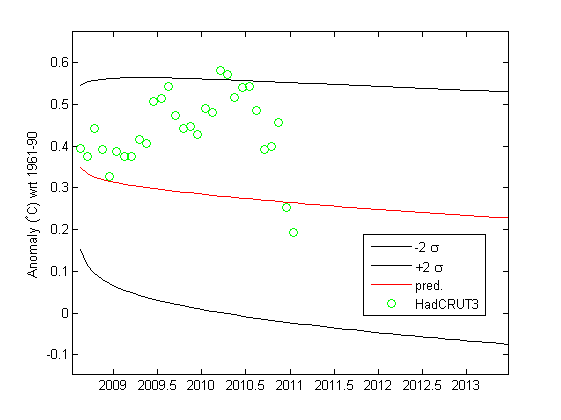
That is more probable than 0 out of 30 (assuming some independency stuff those statisticians tend to assume)
Lucia,
As you may have noticed, I may sometimes have a somewhat sarcastic bent [with a sprinkle of acid when it gets too close to the bone] but ad homs have never been my weapon of choice. In fact I consider it to be verbal cowardice.
🙂
tetris:
It’s not just “my views”: There are basic statistical methods to be used here. For you to ignore them tells us something about how you process information, and what you understand about how to apply that type of analysis to this problem.
First, you can call it “talking down” if you want, but when you don’t know what you’re talking about, and it’s easily established that you don’t, it’s just the facts, Jack. Deal with it.
In terms of training, you have none of the training necessary to understand the rational basis behind why we think there is a GHG effect, and a net radiative forcing associated with anthropogenic forcings. You are making the common mistake of assuming that your insight in one area is mutable to another, without doing any of the hard work to understand what people who’ve spent their lifetimes studying a problem have learned.
Since you accuse me of it, why not point to a single ad hominem that I’ve made towards you? (And saying you don’t know what you’re talking about, which you don’t, is not an ad hominem, last time I checked.)
As to the comments in 70274… they suffer from the same lack of understanding of the influence of short-term variability on a long-term slow secular trend associated with AGW that you’ve shown along. Is it my responsibility to educate you on this? Would you listen if I tried?
tetris:
And this isn’t, by the way, in your mind, an ad hominem?
Re: Eli Rabett (Feb 21 14:16),
As has also been pointed out, building nuclear power plants requires infrastructure that doesn’t exist yet for the needed power plant construction rate. It will be at least a decade, probably two before it does, once we get started, which we haven’t yet. The capital investment for a coal or gas fired plant is a lot lower than for a nuclear plant. Saying we are currently retiring and replacing old fossil fuel power plants with new fossil fuel power plants is irrelevant to the capability to replace fossil fuel power plants with carbon free power plants.
How many 1GW solar or wind plants are currently under construction? My guess would be zero. There are only a few 1+GW nuclear plants currently under construction. For wind, that’s 1600 2.5 MW turbines at a 25% capacity factor and you still need a significant fraction of that capacity of rapid spin up power, absent a major breakthrough in battery technology. Unless, like Denmark, you happen to live next to major hydroelectric generating capacity, it’s usually natural gas fired turbines so isn’t carbon free. IOW, wind isn’t, and probably never will be, ready for prime time unsubsidized. Solar photovoltaic is even further away and has similar problems to wind because it can’t supply base load. Solar thermal has a somewhat better load factor, but isn’t commercial yet either.
As a result, S450 isn’t going to happen. Maybe S550 or B1, but only because we’re going to have problems producing fossil fuel at a rate to go above 550. In the short term, that’s going to make life unpleasant.
Re: UC (Feb 21 14:37),
I would say that 28 out of 30 above the predicted value is way more significant in terms of rejecting the hypothesis than 2 above 95%.
tetris
Arguing by insult isn’t admirable even if the insult doesn’t happen to be an ad hom.
Andrew_KY:
Well, here’s how I’d do the analysis:
If you look at the period 1981-2000, the temperature trend for that period was about 0.17°C/decade (which is probably artificially high due to the decrease in sulfates and other pollutants that would tend to cool the Earth over that period). If you look at the RMS decadal scale variability, it works out to roughly 0.15°C.
I’d have to do a Monte Carlo to compute the chance of having a decade with no statistically significant warming, but off the top of my head it would be at least 1 in 8. That is, atypical, but not off the charts unlikely.
Lucia has done more extensive studies on this than I have, so if you really want to understand the problem, I’d encourage you to go look at those.
Carrick
My CV disqualifies me from discussing matters of AGW/ACC? You must be f… joking. Your qualifications in the matter, please? How about decloaking?
Because unless you have an academic background at the very least akin to our host’s, or Spencer, Christy, Lindzen, Latif, McIntyre and a good numner of others versed at doctoral levels in atmospheric physics, physical chemistry, statistics and the likes, you too should exactly like you tell me to, and shut your trap.
And incidentally, if you don’t understand the difference between irony, foiling, sharp sparring and sarcasm on the one hand, and plain ad hom on the other, might I suggest you enroll in a qualified debating course. It could do you no harm.
Meanwhile, you are deftly managing to avoid responding to my suggestions/queries. Well done.
tetris:
My background Ph.D. physics with ~ 25 years post-doc experience and a strong experimental background. So yeah, it’s at least akin.
And don’t put words in my mouth, what I said was your CV doesn’t qualify you to discuss the point:
Emphasis added.
Ignoring the silly nonsense about debate courses, perhaps I could once again ask you for an example of an ad hominem I’ve directed towards you?
Since you’ve been so busy wrapped up in CVs and bona fides and lecturing on debating, perhaps you could (in a civil manner) repeat your queries/suggestions?
tetris–
Bear in mind that I can see email addresses,and some commenters email addresses reveal who they are. I’m not going to spill the beans who they are, but Carrick has a ph.d. in physical sciences and publishes.
Ideally, you should tone all of these down in comments. I know sparring is fun, but it doesn’t work well in blog comments.
Lucia,
Pls see my response to Carrick.
There are a lot of people in business, academe, etc. who would benefit from attending debating classes, because it would attune them to the reality that there are many tools in the linguistic “arsenal” that can be used in an exchange. There is a world of difference between the sharp edge of words [ which in the eyes of some -and not always the recipient- may be perceived as insult] and a clear ad hom. You see, the insult can be directed at the argument [think of various fables and allegories]. The ad hom, is always -and always- aimed at getting at the other’s point of view by debasing the “man”. “Ad hominem”: at/to the man. CQFD
Re: Carrick (Feb 21 13:20),
Indeed. But the question is when do we see the sigmoidal fit diverge from the purely exponential. I did that fit and you don’t see much divergence until after 2050. In 2050 the exponential fit is 514 ppmv and the sigmoid fit is 508 ppmv and the inflection point where the rate starts to decrease is 2115. Actually a gaussian or the derivative of a logistic curve so it peaks and declines would probably be better, which is also initially exponential. I’ll try that next.
Re: tetris (Feb 21 15:31),
Carrick is only slightly more cloaked than I am. It’s not hard at all to find out who he is, as he has dropped enough clues.
Tetris–
I think you are misunderstanding me. I know what an ad hom is.
Whatever you want to call this:
It’s hardly an example of excellent, insightful comment.
On a thread where you already asked me to step in and chastise people for insulting you, and where you seem upset that I don’t step in to chastise them, you really ought to consider trying to refrain from throwing around insults yourself. Defending this sort of thing by saying it’s not an ad hom? Sorry, not a defense.
DeWitt, that exponential form is a good example of the problem with modeling fishing trips:
$latex {1\over\sqrt{1 + \alpha \exp(-t/\tau)}} \approx 1 + {1\over 2}\alpha \exp(-t/\tau) + {3\over 8} \alpha^2 exp(-2 t/\tau) + \cdots.$
The reason I bring this one up is the first form is one our group derived using a simple 1-d model with nonlinear saturation, while the second (Taylor series) form is one that a lot of experimentalists had been using to describe the measurements they were getting. They were calling this the “double exponential” model, and had been spending quite a bit of effort trying to come up with a physical explanation for the second exponential.
(Some of them still haven’t stopped trying, 15 years later, even though the answer is a “simple” nonlinear effect.)
No bugs its not the usual Willis Rant. I was passed the paper a time ago and the issues with it are pretty clear. I passed a copy to Willis and told him to have fun.
There are more issue in that paper than he covered, so its good hunting ground.
There are topics on instrumentation changes, on rare event stats, on gridding precip data (as opposed to temp data) on selecting GCMs for analysis, and on the time frame selected for analysis.
Willis is just getting going
“Lucia has done more extensive studies on this than I have”
Yeah, but does she remember that she did them? 😛
Andrew
Lucia/Carrick
Thank you both for the clarifications.
Carrick: with due respect for your background, I beg to differ [can not help it 🙂 ].
During my VC career, and “in spite of” my own academic training and business bent, I have had both the opportunity and challenge of being forced to master the fundamentals and crucial intricacies of -just to mention two- very complex pieces of science and technologies- mammalian artificial chromosomes [the ultimate genetic engineering tool with many attendant biological and ethical implications, as you no doubt can understand] and a unique technology that enabled us to structurally metalisize DNA in a reversable real time process. I trust you will agree that this is not your every morning “oatmeal”.
During the late 1990s and the again the early 2000s, I built companies around both technologies as founding CEO, in the proces raising very considerable amounts of capital. In both cases my team and I were subjected to sometimes excruciating due diligence, with confirmed outside “expert” advisors [loaded with all sorts of qualifications] telling not only their investors but N.B. us, that the [verified/confirmed and reconfirmed] hard data we were providing them -for a whole litany of purported reasons- simply could not be correct/credible. I am sure you get the picture and enough said.
Having dug into the AGW/ACC story for the past ten years -and for what its worth, with my reference background both as a “disher out” and “recipient” of hard nosed due diligence, I think that I have every intellectual capacity to be confortable in having reached the skeptical position I hold in the AGW/ACC matter.
If the now 25 year old AGW/ACC story where presented to me as a business proposal, my due diligence tells me that in spite of whatever the elementary physics that are meant to give it credence [and which I do understand] there are more red flags than at communist parade around it, and I would not touch it. Call it a mixture of analysis and intuition.
Enough said. Lucia has admonished me to put water in my wine, and I will do that. I’m sure will meet again.
Wow, things got kind of ugly there. There are a lot of very accomplished people who post here. You need only read the quality of the prose posted to understand that.
.
Tetris, IMO Carrick ought to be a natural ally for you in the climate wars, if only because I know he is by nature skeptical and is broadly versed in physical science. A little too rough around the edges? Maybe yes. Sometimes too quick with a dismissive comment? Yes, for sure. OTOH, he can evaluate some technical issues much more easily than most people without his technical background. Don’t get me wrong, I’ve had some disagreements with Carrick, and he has sometimes been very skeptical of what I was saying, even when I was for certain correct; that is just part of being skeptical. But Carrick will change positions if you can show him he is mistaken. That is not common behavior on climate blogs; ask yourself how many times Eli has changed his mind? Or Andrew_KY? Or Liza? Or Robert? No need to even mention folks like Tamino and the echo chamber groupies at CAGW blogs, or the most shrill that post at WUWT.
.
I guess what it boils down to is a simple question: If you are not willing to learn, and change your position based on new understanding, then why would anybody have confidence in what you say? IMO, people who are willing to learn are the only ones really worth exchanging thoughtful comments with. Political jousting may seem great fun (at least to some), but there isn’t much progress involved in that.
Tetris, I wouldn’t disagree with too much of what Steve has to say, meaning I recognize my limitations as well as my merits, and can also definitely say it’s the case I’ve learned things from him and from DeWitt and Lucia, and yes even people like Eli.
Re: Carrick (Feb 21 16:04),
Just for fun I fit a Hubbert curve. It peaks at 748 ppmv in 2137. Again, you don’t see any significant divergence until after 2050 or so. I should convert to Pg carbon to see what it says about total emissions. Peak emissions as measured by rate of increase is in 2074 at somewhat less than twice the current rate, 3.8 ppmv/year. That’s actually almost reasonable.
DeWitt, what year is your (pre-peak) inflection point at?
SteveF (Comment#70318)
February 21st, 2011 at 4:32 pm
“I guess what it boils down to is a simple question: If you are not willing to learn, and change your position based on new understanding, then why would anybody have confidence in what you say? IMO, people who are willing to learn are the only ones really worth exchanging thoughtful comments with. Political jousting may seem great fun (at least to some), but there isn’t much progress involved in that.”
—————–
Well said!
SteveF, Changed my mind about what? This is getting ridiculous. Al Gore bought a huge house on beach front property. Excuse me, more like ” $9 million Montecito oceanfront villa”
“Changed my mind about what?”
liza, I agree. What I’ve encountered here recently is Warmers avoiding answering more questions, playing dumb more often and then patting themselves on the back more.
So how is that persuasive?
Andrew
Carrick (Comment#70237) February 20th, 2011 at 9:22 pm
“Economics of fossil fuels is the speed limit on how fast we can burn fuel, and why an exponential law isn’t expected to hold.”
Carrick
The Chinese were exporting 5500 kcal/kg steam coal in 2002 for $27 tonne. Today they are importing it for $120/tonne. Up from $90 this time last year. Europe runs about $10/tonne cheaper then Asia.
Prior to 2003 the inflation adjusted price of coal in global markets had been declining for 30 years which created the impression that ‘exponential growth’ was possible.
The US is an exceptional case as our major reserves are effectively landlocked. How much coal is in Gillette, Wyoming has zero impact on global prices. It does have an impact on US Midwestern prices.
Even in the US, mining productivity east of the Mississippi has dropped from more then 4 tons/man hour in 2000 to less then 3 tons per man hour now. Obama’s only been in office a short time, a 10 year downward trend in US Eastern Coal mining productivity can’t be blamed on Ms Jackson at the EPA.
A single 1,000 MW coal fired plant in China burns $480 million worth of coal per year. One can build a Westinghouse AP1000 1,100 Megawatt Nuclear Reactor in China for $2 billion.
It’s going to take time to spin up the global nuclear industry.
DeWitt,
“There are only a few nuclear plants under construction”
By my count it’s 61.
http://world-nuclear.org/NuclearDatabase/rdresults.aspx?id=27569&UserSearchID=588
The world isn’t waiting for the USA to act on energy.
Liza, Andrew_KY,
“Changed my mind about what?” “liza, I agree.”
.
Let me be more clear: Changed your mind about anything related to climate? I am willing to admit I am mistaken about this, but honestly, I have never seen any change in your understanding based on your comments.
SteveF, again, my understanding of what about climate? What?
I insist that you are the people who don’t understand climate. I understand climate on this planet just fine and I understand TIME on this planet too. Apparently so does Al Gore who is not worried about sea level rise. (Which by the way 125,000 yrs ago when this planet was by my understanding of what “warm” really is like NATURALLY!!! was 6 meters higher.) You’ve got six meters to go before it becomes unusual!!
DeWitt, take a look at the history of nuclear power in France, They got the job done between 1970 and 1990
http://en.wikipedia.org/wiki/Nuclear_power_in_France
China has 27 under construction and more in planning. Also pay attention that Eli was talking about all sources of non fossil energy. Right now in Spain
————————————
Wind energy has consolidated as the third technology of the Spanish power system in 2010, having reached an output of 42,976 GWh, only overtaken by thermal gas combined cycle at 68,828 GWh and nuclear that reached 61,944 GWh. In 2009, for the first time in the annual calculation, wind overtook coal that produced 33,844 GWh. In 2010, wind energy has covered 16% of the demand, compared to 11.5% in 2008 and 13.8% in 2009.[3]
————————————–
http://en.wikipedia.org/wiki/Nuclear_power_in_China
“liza (Comment#70327) February 21st, 2011 at 7:27 pm
SteveF, again, my understanding of what about climate? What?”
.
I guess I am not asking clearly enough.
I’m not trying to be at all restrictive here. Has your understanding about anything related to Earth’s climate changed as a result of your many, many exchanges on this blog? In other words, have you learned anything which might change your POV related to GHG forcing, or recent warming, or radiative heat transfer, moist convective transfer, ocean heat accumulation, atmospheric aerosols, or… well, just about anything? It is an honest question. I can’t guess what your answer might be, since I really do not know.
I like Liza heres some help
http://chartsgraphs.wordpress.com/2010/08/19/enhanced-uah-channel-5-temperature-anomaly-trend-chart/
This is from a warmist guy but at least he’s showing this graph. The other graphs are taken from “adjusted” Hansen and co which show massive adjusted warming
Stephan (Comment#70331),
What?
How is that link related to the question (an honest question) I asked Liza?
SteveF,
My understanding of the climate itself has not increased since I began frequenting this blog. The reason is that no one ever presents anything other than speculation and marketing images.
My understanding of the behavior of the Global Warming culture has increased slightly. It’s tribe vs. political opponents, wrapped in the trappings of scientism.
Andrew
Andrew_KY (Comment#70334),
Thank you for that answer. I admit that I am not surprised.
DeWitt & Carrick —
Thanks for carrying on the conversation about fits to pCO2 while I was at work!
DeWitt, in looking at your comment#70273, I think you were fitting to pCO2 = 280*exp( (alpha+beta*t)*t) ? as you mentioned that the coefficient in the exponential was rising. I originally read your comment #70225 — “the rate of increase [is] increasing exponentially” — as fitting to the form pCO2 = 280 + K*exp(gamma*t). Anyhow, I’m interested, as Carrick is, in the numerical factors of your Hubbert curve fit, as that seems like a more logical type of curve than an unbounded exponential.
It’s not surprising that smooth curves which are fit to the recent history, don’t diverge significantly for some time, but I must confess that I didn’t expect them to remain close for quite so long as 2050. Can you make a graph comparing the evolution of the different forms? Or at least spare me the trouble of re-computing the parameters of the various fits? Thanks.
I mean, Zeke presents strict KGB Party-Line stuff, Lucia presents Luke-Warming Tea and Cakes stuff and most of the rest of it is Climate Celebrity entertainment …which is all fine with me. I admit it, I like it.
But to truly understand the science, you have to do the science yourself.
So here we are, not doing that.
Andrew
DeWitt, I wasn’t able to find good convergence using the Hubbert curve. I used the annual version of the MLO data from 1958 to present.
Andrew_KY:
OMG. What a complete pile of manure.
Carrick,
“OMG. What a complete pile of manure.”
You are only going to encourage more of the same.
Carrick, DeWitt,
The atmospheric CO2 does vary year on year with average sea surface temperature, independent of the underlying trend, with a best fit of about 3-3.5 PPM per degree change in average sea surface temperature. Maybe accounting for the ocean surface temperature change contribution would help clarify what the trend has been doing.
“You are only going to encourage more of the same.”
SteveF,
Not really. I said what I wanted to say.
Andrew
SteveF:
I’d still like to see a model based version: There are too many quantities that co-vary for me to be comfortable assigning cause and effect just based on correlation.
If this was your blog, what would you actually be doing?
In your comment #70251, you quote SteveF
and you reply
So it appears that you don’t disagree with the radiative transfer physics – you agree that all things being equal, GHG’s will warm the surface. Your comment implies that you don’t believe all things ARE equal: if you add GHGs, something else changes to counteract their warming effect. Is that in fact your position? Can you support it with data, or at least hand-wave-argue it with data?
I don’t know how you format quotes on this site, so I won’t even try, but I noticed some comments which were relevant to a question I’ve had for quite some time, and I thought maybe someone here could help with it. Specifically, people discussed whether it mattered if a global warming trend was .14C or .2C.
On the one hand, it is obvious a difference in the exact impact of global warming would matter (though there is a question of whether or not it would matter for policy purposes). On the other hand, is a measure of changes in average temperatures really that relevant? If half the planet warmed by one degree, and the other half cooled by one degree, the average change would be zero. Even so, there would be significant changes to the Earth’s climate.
So my question is this. Is there any direct relevance between the average global temperature and the impacts of global warming? Does it actually make sense to look at average temperatures, or does doing so simply over-simplify things?
Re: Carrick (Feb 21 17:51),
2074 is the inflection point. Peak concentration is 748 ppmv in 2137.
Brandon, you raise a good question. I’ve looked at, for example, the latitudinal effect on warming (Zeke has too).
See this.
My conclusion is, yes, average temperature has some meaning (for the oceans, especially), but it also implies that some areas see larger effects than others.
[In particularly, northern polar regions seem to get a large amplification effect relative to mean change in temperature. That in turn probably has some interesting consequences in terms of disruption of weather patterns, for example, for the US (& possibly Europe) in late fall/early winter. ]
DeWitt
Hm… you’re fitting to MLO annual data, right? I don’t find that solution with my LSF for MLO annual solution, 1958 to current.
(BTW, from what I read, it’s unsafe to use Hubbert extrapolation prior to the inflection point, unless you have other market data to constrain it.)
Or are you fitting to Hubbard + offset?
DeWitt,
but the process in question is very strongly correlated over time – that’s why statistical tests with iid assumption do not work well. The two values above 2-sigma limit show that the prediction intervals are not too wide. Whether they are too narrow remains to be seen.
Here’s a graph with exponential, Carrick’s modified logistic curve, Hubbert and A1B. The MLO data is in there too.
Parameters ( I should use TeX here but it’s easier to just use the Excel functions):
Exponential:
316*EXP((2.625E-03 + 2.98E-05 * t) * t) t is in years with t=0 in 1959
Carrick’s function (modified logistic?):
1062.1/Power(1 + 90 * EXP(-(t-1999.26)/30.3, 0.5)) + 257.2
t is in calendar years for this and the next function
Hubbert:
(1919.045 * EXP(-(t-2137.147)/48.537))/(POWER(1 + EXP(-(t-2137.147)/48.537),2) + 268.5464
liza:
“You’ve got six meters to go before it becomes unusual!!”
The issue is NOT that the rise is historically “unusual.”
This never has been the real issue. The issue over half of the worlds population lives on/near coasts. The issue is this. Our best understanding of the physics of the climate indicates that adding GHGs will cause the sea level to rise MORE THAN IT NATURALLY WOULD HAVE. So, if a rebound from the LIA would raise the sea level 10mm by 2100, if we add enough GHGs that rise will be MORE THAN it would have been otherwise.
So, the operative questions are.
1. How will our emissions progress going forward?
2. What is the best ESTIMATE we have for the additional rise in sea level that is attributal to this.
3. Can we do anything about emissions?
4. Should we?
5. Are there other actions (no regrets actions) that we should take in light of the concern about additional increases in sea level?
If you want to argue that additional GHGs will not cause warming, I’ll suggest you take that up with Lindzen or Spenser. Nobody here is going to waste much time on that debate with you. Go to science of doom, learn something.
if you want to argue that the additional warming will not be “unusal” in the entire history of the globe, nobody will disagree.
If you want to argue that the warming will be small or moderate, you’re in good company to discuss that.
Re: UC (Feb 22 00:13),
But you should still be able to calculate a run length probability. You can certainly do it for CUSUM charts, which are unit root by definition. If the data really are near unit root, then the confidence intervals expand over time rather than remaining parallel. For a pure unit root process they expand without limit, but then the process isn’t stationary.
Re: Eli Rabett (Feb 21 19:45),
All that wind capacity and yet Spain’s CO2 emissions continue to rise.
Look at the third generation EPR’s Areva is building now. They have one under construction that is expected to be finished in 2012. The won’t start on the second one until 2012 for completion in 2017.
One country could build a lot of reactors, or a lot of countries could build one reactor at a time, but not every country building a lot of reactors at the same time, not for decades anyway.
Not to mention that nuclear power is anathema to a lot of those clamoring for rapid cuts in CO2 emissions.
Re: DeWitt Payne (Feb 22 01:11),
Well, Portugal has gone even further, with 45% of 2010 energy from renewable sources (now up to 52%). And that is
having an effect.
Lucia,
Here’s what you’ve been up to as seen at
http://blogs.news.com.au/couriermail/andrewbolt/index.php/couriermail/comments/no_warming_for_a_decade/
DeWitt (#70353) —
Thanks for the figures. The curves are proof that extrapolation is hard, especially about the future. [With apologies to Yogi.]
There are two things that leap out at me from those charts, which together raise a single question in my mind.
The first is the difference in the measure trend since 1981 – a difference of 1 degree per century between the low (HadCurt) and the high (GISS).
The second is the virtual disappearance in that discrepancy (down to 0.1 degrees per century) when you simply shift the starting point in the trend back 12 months to 1980 (with the data series presumably only increased from 121 data points to 133 data points).
Both of those features of the analysis (the high spread in estimated trends in the first and the stark change in the difference from the first to the second) give me pause to wonder if we have too much confidence in our measures.
@ Nick Stokes
The numbers on Portugal don’t look great. Have a look here:
http://www.eia.doe.gov/
Some of the most damning are that Portugal turns only 30% of installed capacity into output. Compare that with France at 50%.
Worse, if you remove the non-hydro “renewables” capacity, Portugal would still possess in total installed capacity 200% of its annual electricity consumption.
The hydo is good and works for Portugal (as it does for Norway). The subsidy driven wind, wave, solar and geothermal in Portgual is horrendously wasteful and expensive.
steve mosher:
“Our best understanding of the physics of the climate indicates that adding GHGs will cause the sea level to rise MORE THAN IT NATURALLY WOULD HAVE. ”
“Indicates” yeah like that means anything. C02 concentrations have been orders of magnitude higher then now and this planet still had its water locked in ice. And when you say “Understanding” that means all you have is some computer models not a real planet. Not even one model either, you have a bunch of them all giving you different guesses. That does not equate “best understanding of climate”; physics or otherwise when you are a REAL earth scientist. A real earth scientist knows the vast geological record “indicates” no such thing about C02 and the climate.
“If you want to argue that the warming will be small or moderate, you’re in good company to discuss that.”
I will add to you list:
6. Some one like you has skipped years and years of education and the work required to be accredited as an Earth scientist and believe they know things that they don’t. Some one like me lives with a REAL earth scientist. I am in better company.
7. Some people need to feel needed and a reason to get up in the morning so they fixate on a tenth of one degree on little charts as if it means anything.
FACT:
The House of Representatives, a branch of our Government that George Washington and the other brilliant founders of this great nation helped to create just voted to defund the IPCC. The reasons are many. That’s a consensus too.
BTW that was the same George Washington who crossed the Delaware that our blog host has a painting of over her fireplace of. You know that story right Mosher? Maybe you should revisit that historical FACT because it had something to with The Little Ice Age.
Matt,
“If this was your blog, what would you actually be doing?”
If I was going to claim this was a science blog, I would go out and do some science to report. I wouldn’t take a break from watching TV to try and insult commenters and pretend that it’s science.
“So it appears that you don’t disagree with the radiative transfer physics – you agree that all things being equal, GHG’s will warm the surface.”
I have no reason to believe that GHG’s will warm the surface. The All Things Being Equal is phraseology used by Warmers on this blog. Even by their own graphs, things aren’t always equal, and they have no explanation as to why they are equal sometimes, and why they aren’t sometimes.
Andrew
I wonder: are most people just crazy, or does the Internet make them seem that way?
As a first-time commenter, I came for the science and stayed for the dramady.
Andrew KY, since by your own measure, that “to truly understand the science, you have to do the science yourself”, you do not truly understand the science, your views can be happily disregarded as ignorant.
People are going to look at 10 year trends. That said, the one Andrew Bolt shows is 10 years and 1 month. I tend to show “since 2001”. That should be good news to you because… if Hadley falls at or below the current value for the next two months, someone is going to make a graph showing temperatures have not risen since 1998!
Liza– I am seriously tempted to put “REAL earth scientist” in my list of blocked phrases. With all due respect to your husband’s credentials, if he wants to come and argue here, encourage him to present his arguments himself. Failing that, have him assign you some reading so you can make arguments directly instead of telling us your husband would have a good argument if he came here and presented it.
You persistently telling people that they are wrong because your husband is an earth scientist got old a long time ago and I would much prefer if you actually presented an argument instead of an argument by authority of an invisible person.
“Andrew KY, since by your own measure, that “to truly understand the science, you have to do the science yourselfâ€, you do not truly understand the science, your views can be happily disregarded as ignorant.”
Mark (I mean),
And so can yours.
Andrew
That’s ‘Mark’. And I haven’t expressed any views about the science. I’m here to learn. I’m not sure what you’re here for. You seem to not know it all already.
“I’m here to learn.”
Mark,
Good luck with that.
Andrew
lucia (Comment#70367) February 22nd, 2011 at 8:25 am
Give me a break. This knowledge is available to everyone and I just presented FACTS that come from the geologic record to argue what Mosher claims. FACT: C02 has been orders of magnitude higher then “now” and the water on Earth was still locked in ice. THIS IS FACT. You DO NOT make any sense at all except that you bring CENSORSHIP up. That doesn’t not surprise me.
BTW you also failed to acknowledge that it is also FACT the earth warmed enough all by itself without C02 higher then now 125,000 yrs ago. Enough to make sea level high stands measure 6 meters higher then today. This is the NATURAL climate of this planet. 125,000 years ago is this planets RECENT past. That is also FACT.
It is also FACT the power of C02 on climate is just GUESSED at in those computer models. Show me the scientific evidence besides those models that shows us that power. Point to it right now.
“I would much prefer if you actually presented an argument instead of an argument by authority of an invisible person.”
Lucia,
Global Warming is argument from authority (IPCC et al). You gonna block that too?
Andrew
Another Ian, I believe Bolt is correct, it didn’t warm in the last decade, and it does look more like a step function change than a ramp. Of course neither of these IMO are inconsistent with a long term increase in temperature associated with increase in CO2 atmospheric concentration level.
Andrew_KY–
The fact that the IPCC happens to concur with an argument doesn’t make their argument an “argument from authority”. Moreover, at least the IPCC is identifiable, we can find that body’s documents and read them, quote then and figure out what we think their words and figures mean by looking at them.
In contrast, when no-last name Liza “argues” we are presented with her interpretation of whatever some no-first-name- no last name ‘credentialed’ authoritative man might have told her. Given the way Liza presents it, none of us have the faintest notion what the original argument was, nor how to make any sense of it. So, I would prefer if Liza were to ask her husband to teach her enough to present the arguments in some other manner than “my husband, who is really credentialed and smart says X, so X must be right”.
Carrick, nice try. IMO means no scientific evidence to point to.
What you see on your charts could also be evidence of natural increase in temperature on this planet (fraction of a degree!) that has nothing to do with atmospheric concentrations of C02. There is more scientific evidence to support this idea then not.
“Andrew_KY–
The fact that the IPCC happens to concur with an argument doesn’t make their argument an “argument from authorityâ€. Moreover, at least the IPCC is identifiable, we can find that body’s documents and read them, quote then and figure out what we think their words and figures mean by looking at them.”
Lucia,
When you (and others) give weight to claims because of who presents them (IPCC et al) that is the defintion of argument from authority.
You are certainly doing that. Unless you want to correct me and disclose that their claims have no particular weight with you.
Andrew
Lucia, the funny thing is, if any of you had any of the educational background and knowledge I refer to and try to describe by mentioning my husband who represents an established and respected branch of science you wouldn’t use so much energy trying to discredit what I say. IOW you would respect the scientific facts that come from the geologic record, understand them, and not deny them!
Andrew_KY–
When have I given weight to any claims based on the fact that the IPCC presents a particular claim? It’s true that I agree that with some claims that happen to appear in volumes printed by the IPCC. I disagree with other claims, or at least think they are poorly supported.
I’m also under the impression that a heck of a lot of people think I frequently point out that I think some IPCC forecasts are off. This is hardly saying the forecasts must be right because the IPCC made them. In fact, I think suggesting that I give weight to the IPCC claims based on their authority is as ridiculous as someone suggesting I give weight to the Pope’s claims based on his authority. Do both sometimes say things I agree with? Yes. Do I argue for those claims by saying “The Pope/IPCC says this is true, so it must be?” Nope.
Lucia,
Fair enough. But I am also talking about the idea some people have (maybe not you) that since the IPCC considers itself an authority, that what it claims needs to be disproven. This is just political framing. What individual scientists claim, is what what needs to be scrutinized.
Andrew
““Our best understanding of the physics of the climate indicates that adding GHGs will cause the sea level to rise MORE THAN IT NATURALLY WOULD HAVE. —
I have to ask now. Who is exactly is “our” ?
Liza,
The relevant fact is that the first-order effect of an increase in GHG concentrations is warming. The optical depth by frequency for CO2 is well studied and understood (as are other GHGs, such as methane). There are laboratory experiments that you can do to prove these things to yourself if you do not wish to take our word for it. You can choose to ignore this if you like; but, in doing so, you will convince few.
Now let’s do a simple thought experiment:
1. What happens if the sun gets warmer (i.e., energy flux increases)? Would we expect the earth’s temperature to go up? If so, why? Down? If so, why?
2. What happens if the sun gets colder (with the same follow-on questions)?
When you have answered those, we can continue.
“There are laboratory experiments that you can do to prove these things to yourself”
Ryan O,
There is a difference between lab experiments and the earth’s climate system. The behavior in the lab may not mimic the behavior in nature. Did you do a real world experiment? What were the results?
Andrew
Andrew_KY–
I think it’s important to start at the beginning and take baby steps to discover where anyone’s arguments differ.
Do you agree that “The optical depth by frequency for CO2 is well studied and understood (as are other GHGs, such as methane)” and you could do the experiment yourself? The answer to this should be yes/no. If you can’t or won’t answer this sort of thing and don’t discuss then there is no point in anyone discussing nuances having to do with what might happen in the real world with you.
“OUR best understanding of the physics”
Argument from authority Take 1. 😉
Andrew
“If you can’t or won’t answer this sort of thing and don’t discuss then there is no point in anyone discussing nuances having to do with what might happen in the real world with you.”
Lucia,
It’s your own M.O. to not answer questions you don’t like. Now you are demanding answers from me?
“The optical depth by frequency for CO2 is well studied and understood (as are other GHGs, such as methane)†and you could do the experiment yourself?”
This is a claim. I would have to investigate it’s validity before I can give a definitive answer. I will say however, that a lab and the real world are still two different places.
Andrew
Andrew_KY (Comment#70384) February 22nd, 2011 at 11:07 am | Reply w/ Link
“OUR best understanding of the physicsâ€
Argument from authority Take 1. 😉
Andrew
#########
Actually not. You need to study logical fallacies. Take a class.
Ryan O (Comment#70381) February 22nd, 2011 at 10:28 am
I never said I don’t understand the greenhouse effect. What I do say and what I know for sure that NONE of you or anybody on this planet knows the exact power of C02 concentrations on the world’s climate. You are just guessing. Especially in such small times scales and in such small quantities as 100ppm “more” .
The last million years of geological history we DO KNOW a heck of a lot about that the climate warmed and cooled; the ice advanced and retreated; over 20 times. Just 18-12 thousand years ago this continent was covered in ice 3 miles high. That had nothing to do with the sun getting colder or warmer (and C02 concentrations were relatively constant for the last million years) We live on a wet rock traveling and wobbling, and tilting through space around a star. When you acknowledge this, we can continue. Or, go ahead and dismiss these facts. I am used to it.
Edit add on: Mosher, project much? Take a class? LMAO
Really? Point me to where C02 “physics” just like the atmosphere was used in any practical way to raise temperature? Did you even read my article from Mexico? It even said the growing houses froze.
liza (Comment#70380) February 22nd, 2011 at 10:22 am | Reply w/ Link
““Our best understanding of the physics of the climate indicates that adding GHGs will cause the sea level to rise MORE THAN IT NATURALLY WOULD HAVE. â€â€
I have to ask now. Who is exactly is “our†?
#####
In the present case it would be the scientists and engineers on this thread who have actually used the physics to build things that work.
Liza. Have you ever seen images taken from space? Do you believe in the physics used to CALCULATE that image?
Lucia, My ex wife says that Liza’s husband is wrong. And she’s a geologist TOO!
“Liza. Have you ever seen images taken from space? Do you believe in the physics used to CALCULATE that image?”
Steven Mosher,
Irrelevant appeal to images. They have nothing to do with the climate. Take a class, champ. 😉
Andrew
“BTW that was the same George Washington who crossed the Delaware that our blog host has a painting of over her fireplace of. You know that story right Mosher? Maybe you should revisit that historical FACT because it had something to with The Little Ice Age.”
Actually I did some research on actual temperature records for that period. It was nothing spectacular. Snow, sleet, rain. Nothing much out of the ordinary. And the painting has a number of inacuracies. Now you are not going to suggest that you can read the temperature to 1 degree accuracy by looking at a painting?
Are you going to suggest that it has never been colder than that rainy sleety snowing night since then ( it has) Your not going to suggest that we can infer a GLOBAL phenomena from 1 painting, when 10s of thousands of thermometers are not enough to capture a global phenomena.
But lets be scientific. Lets ask 100 painters to paint scenes when its 0F and then ask 100 to paint a scene when its 5F. And lets see if we can tell the difference. And no fair painting a picture of thermometers.
If you like you can go google temperature records ( jefferson I think) and see what the temps were like. But then we have to look at whether he calibrated his instrument, and what its bias is, and what the microsite was like. By the standards skeptics employ to attack the current record, the LIA never existed. Anecdotes and does eat oats and little goats eat liza.
No. It’s my policy to forbid people arguing by rhetorical question. That is: posing a question as if the answer will somehow reveal some “point” in the argument and also provide supporting evidence. That is a different from not answering questions. I think anyone who reads this blog can see I answer questions very frequently.
If you have not investigated that claim and are unwilling to take the time to do so, then there is no point in anyone discussing radiative physics in the real world with you. Clearly, if you don’t even know what happens in the lab, you can hardly know what happens in more complicated situations like furnaces, the atmosphere or anywhere else. I would suggest until you do learn the answer to what happens in a lab, no one should bother wasting any time with you about anything else.
(Maybe I should make the plugin modify your name to “Andrew_won’t_learn_how_radiative_physics_even_works_in_a_lab_KY”)
The next painting showed George hopping off the boat and everyone else frozen to their seats. He was a stand-up guy.
Andrew_KY (Comment#70384) February 22nd, 2011 at 11:07 am | Reply w/ Link
“OUR best understanding of the physicsâ€
Argument from authority Take 1.
Andrew
#########
Actually not. You need to study logical fallacies. Take a class.
Actually yes.
re: “Our”
A common variation of the typical Appeal to Authority fallacy is an Appeal to an Unnamed Authority. This fallacy is also known as an Appeal to an Unidentified Authority.
This fallacy is committed when a person asserts that a claim is true because an expert or authority makes the claim and the person does not actually identify the expert. Since the expert is not named or identified, there is no way to tell if the person is actually an expert. Unless the person is identified and has his expertise established, there is no reason to accept the claim.
http://www.nizkor.org/features/fallacies/appeal-to-authority.html
Andrew
Lucia,
If by chance you don’t have this painting over your mantle, ask your Father in Law if he remembers Harry Morgan. He’s alive and well and living in the Glen and actually does have a reproduction of the painting in their condominium. I can vaguely remember him saying it was a real favorite.
Liza,
You are arguing something that is not my point because you think you know where the questions are leading. If you answer the questions, then I will tell you where they are leading.
“No. It’s my policy to forbid people arguing by rhetorical question.”
Lucia,
Forbid?
You sometimes ask rhetorical questions yourself.
and…
You have declined to answer my questions on several occasions.
Andrew
Ryan O (Comment#70396)
February 22nd, 2011 at 12:51 pm
—————–
I’d like to see where Ryan O is leading on this.
Let’s go back 550 Mya when solar irradiance was 3.6% lower.
TOA TSI was 1318 Watts/m2 which leads to a solar forcing only temperature of 252.7K (down 2.3C from today). But that also assumes Albedo was the same as today 550 Mya. It probably wasn’t based on the geologic evidence which indicates that there were few land glaciers at this specific point in time. One could surmise that Albedo was close to the Earth average when there is small amount of glaciers which is about 0.273. The solar forcing alone temperature is then 255K, the same as today.
CO2 levels were about 4800 ppm or about 4.3 doublings so temperatures should have then been about +12.3C.
The do18 isotope data says the temperature was about +3.0C or so.
AndrewKY–
I answer my own rhetorical questions. That’s part of the rule. I’m not going to discuss moderation with you any further and if you decide to argue about that, I’ll moderate you.
Steven Mosher – Although the overall temps aroung the time of the Battle of Trenton were not out of the ordinary and not reflective of the Little Ice Age, the actual weather event that started Christmas Eve 1776 was a very significant Nor’easter that was considered to be near-record for quite a while. As such storms are wont to do around here (I live a couple of miles from Washington Crossing), it started as rain, then changed to sleet and snow in blizard like conditions. As you note, there are several instances of artistic license in the painting such as the major chunks of ice floating high above the water in the Delaware. However, contemporary accounts of the crossing do mention ice floes (usually large flat slabs that sit barely above the water line)
Liza – I am a geologist/earth scientist with advanced degrees and 20+ years experience in the environmental services industry. I am well aware of what we believe we know about geologic history, long past temperature regimes, estimated atmospheric CO2 concentrations in past millenia, etc. However, I don’t use that knowledge as a blinder to seeking out new information, having an open mind regarding other sciences or at least admitting that atmospheric CO2 concentrations may have some impact on the earth’s climate system.
DeWitt,
I think I can re-run the prediction, this time predict future 30-month means, and compare with the observation. This way the correlations will not matter. Will try (these fractional processes demand some CPU time …)
BobN (Comment#70400) February 22nd, 2011 at 1:19 pm
Good for you. But you don’t know how much impact. Like I said, not one person here knows for sure and is just guessing. Period.
I choose to remember what we do know about the Earth’s climate and hold on to my skeptical thinking especially in light of the politics and ideology infecting the “science”, and the behavior of the “top” scientists and the IPCC, the questionable data, flawed statistics and data not being shared etc etc etc. Most reasonable people do!!!
And Bill Illis (Comment#70398) February 22nd, 2011 at 1:12 pm just gave some more facts from geologic evidence. I am waiting still for Lucia, Mosher etc, et al to acknowledge those facts.
And whatever about the Delaware and the LIA…of courrrrrrse it was nothing out of the ordinary. At least BobN called it a “climate event”. Of course “climate events” are never hot right Mosher? LOL
Liza–
Everyone you list has conceded those facts that the earth has been warmer in the remote geological past before and told you they are irrelevant to assessing whether or not CO2 can result in warming. As for this:
No one here has denied that the earth travels around the sun, nor that it wobbles and tilts. I’m pretty sure everyone telling you that CO2 will tend to cause warming has accepted the solar-centric view of the solar system since they were in grade school. Demanding people to “concede” this is really, truly silly!
lucia (Comment#70403) February 22nd, 2011 at 2:01 pm
“Everyone you list has conceded those facts that the earth has been warmer in the remote geological past before and told you they are irrelevant to assessing whether or not CO2 can result in warming. ”
It’s not irrelevant.What authority gives you the right to say that?
Earth science is not based on the processes suddenly doing something different then they have been for millions upon millions of years. That is just silly.
“Clearly, if you don’t even know what happens in the lab, you can hardly know what happens in more complicated situations like furnaces, the atmosphere or anywhere else.”
Lucia,
Non-Rhetorical Question:
And what exactly are your lab experiences relevant to how C02 behaves?
I don’t think you can talk in nuanced fashion about how C02 behaves in the atmosphere until you can establish some kind of credibility on the subject. As far as I can tell you have none.
Andrew
Even Darwin took The of Principles of Geology with him to read in his voyage on the Beagle. Geology is based on uniformitarianism. Look it up! Reading that book helped him to develop the theory of evolution for pete’s sake!
Andrew–
Lab experiences:
1)Between senior year and grad school, I did a stint as a student in a science program at Argonne. Every week, we were hauled off o do 1 experiment that didn’t necessarily have anything to do with our specific project. (Mine was in multiphase flow)
One morning, they hauled us all in to do some spectroscopy on various gases one of which was CO2 and the other water vapor. This was not intended to have anything in particular to do with AGW. Those are just convenient gases to use.
2) I’ve done lab work on thermal radiation as an undergrad in ME, including the concept of back radiation. This is more general not CO2 specific exposure to radiative physics, but it’s helpful.
As for the rest: I’m going to add your name to the “slow down” list so that you can’t comment very often. So, budget your comments wisely.
Ryan O (Comment#70396) February 22nd, 2011 at 12:51 pm
I didn’t see this comment and want you to know I didn’t think anything about your comment before to me except maybe I don’t like being lead around like a child. Just speak you mind like I do.
Here I’ll answer: I woudn’t expect anything. And you shouldn’t either. See Bill Ellis’ information.
Liza,
Then I can safely ignore all further comments from you.
Re: BobN (Feb 22 13:19),
Yes, The larger point I am trying to make with liza and others is this. IF they apply the same skepticism to data for the LIA that they apply to the temperatures today, THEN the support they have to argue that there was an LIA disappears. AND on the other hand, if they accept the LIA on less well established evidence, then don’t have much epistemic ground to stand on in challenging temperature records today. Also, I will note with some joy that many people who use this painting (like it photographed the temperature) never stop to actually look at the reports from the day, as I recall it was rain turning to snow.
I should have been precise in discussing the type of boats used. But my main point was the blind faith in artistic representation. Silly actually, but that’s Liza. Trusting her husband and some painter. no puns about a-peeling to authority.
Minoan, Roman, Medieval Warm Periods. Sure, where’s the global evidence? Hey, climate varies for a number of known and unknown natural reasons. We have little to no idea what the net effect of this anthropogenic aliquot of CO2 is, or will be or how the carbon cycles will respond. Meanwhile, the oceanic oscillations concatenate cooly, and Sol grins Cheshirely.
=========
Andrew_KY (Comment#70390) February 22nd, 2011 at 12:26 pm | Reply w/ Link
Andrew:
Well Andrew answer the question. Since I do not believe in a thing called “the climate” I will repeat my question to you.
http://ww2010.atmos.uiuc.edu/%28Gh%29/guides/rs/sat/img/wv.rxml
Do you believe in the physics used to COMPUTE the image above and others like it? Well, do you?
Its a trick question, if you say yes, I’ll use that to prove that the arctic will melt on sunday. hehe. The funny thing is this. You dont know that you use things every day that depend upon certain physics being dependable. You believe in these things without knowing that you believe. You’re a closet warmer.
That’s right Kim!
Mosher, how about I knew you and others where going to poo poo my comment about the LIA and the Delaware and my whole family is reading it and laughing because you are so predictable. You go on about the same “same skepticism to data for the LIA” when it is NOT the same at all. Huge branches of science have studied the MWP and the LIA without POLITICS and MODELS. Glaciers advancing leave marks.
I don’t think you even understand why oxygen isotopes are used to infer temps . It is the RATIO between O18 and O16 in the sample that tells how much water was locked in ice for the entire the planet.
Climate forced and unforced:
The difference between them,
By Skeptics is unseen.
Ryan O,
“Liza,
Then I can safely ignore all further comments from you.”
.
Wise choice, and a conclusion I reached some time ago.
Re: Carrick (Feb 22 17:31),
ha, carrick channels kim.
You know, back when earth was a part of the big bang it was way hotter.
Mosh, Carrick,
.
Serious question: do you think expending all the energy you do to explain logical fallacies to people with closed minds is worthwhile? I mean, do you expect this will make any difference?
“Glaciers advancing leave marks.”
ya dont say. Gosh. and C02 still cause warming. go figure. Glaciers leave marks AND c02 causes warming.
But amuse me and let me know how much water was locked in ice for the entire the planet in 1776. And then, how you infer an global average from that? and the regional variations? But wait, we know how much water is locked in ice now. please, use that information to correct the land surface record.
SteveF:
You know those “Bing” commercials where the actors have search overload and spew out random, increasingly unrelated information?
Andrew_KY
Okay. I guess I misunderstood you. From your other posts, it appears that you (possibly) accept the effects of GHGs on radiative transfer in a lab setting, but not in the atmosphere. Fair enough I suppose, but it does kind of limit any discussion!
Could you narrow it down for me? Do you actually accept that GHGs affect radiative transfer in a lab setting? If so, do you accept that IN THEORY, if GHGs in the atmosphere DID affect radiative transfer in the same manner as in the lab, they would have a warming effect?
Hey Mosh,
If you can’t believe Discover Magazine, who can you believe?:)
http://discovermagazine.com/2004/may/a-new-ice-age-day-after-tomorrow
Anyway, to echo BobN, weather in colonial times did have significant overlap with current times. Odd, in that “warmers” are just as likely to say “it was a lot colder in America 200 years ago than now” as are “sceptics”.
Here’s a comment I made at WUWT a few years ago based on some reading I was doing at the time.
http://wattsupwiththat.com/2009/01/25/philadelphias-climate-in-the-early-days/#comment-77282
Note that all my rigorous research and brilliant analysis didn’t stop someone later in the thread stating categorically that “The winter of Washington’s stay at Valley Forge (1777-78) was considered the coldest anyone could remember.”
Sigh…
“You dont know that you use things every day that depend upon certain physics being dependable.”
Again with the irrelevant appeal to “everyday/certain physics” that have nothing to do with “climate”.
Look, my comments are being rationed now, so give me something worthwhile to respond to.
Lucia, what are my new commenting parameters?
Andrew
steven mosher (Comment#70424) February 22nd, 2011 at 5:59 pm
If you know how much water is locked in ice you know in general what the climate of the earth is like. I never said anything about “global average temperatures” and if inferred that they would be correct down tenths of a degree for the LIA or any other time. Before AGW, graphs had +/-margins of error on them for YEARS/TIME AND TEMPERATURE. At least the LIA lasted HUNDREDS of years not 30. The margin for error in the temperature record from all those thermometers you love is equal to or greater than the amount of so called increase in temperature from C02 I bet. Correct me. What is it?
Nothing anybody has said or suggested about lab experiments etc here proves that human provided C02 in such small amounts has the power you give it right now for the climate. C02 and it’s influence on a PLANETARY scale tells a different story in the geologic record and you sure spend heaps amount of time ignoring it.
Big fat ZERO evidence.
In terms of radiative transfer, what is the molecular collision frequency for a CO2 molecule when the atmospheric temperature is 20C?
In keeping with lucia’s rule, the answer is 6.1 billion collisions per second.
The average emission/relaxation time for a CO2 molecule that absorbs a 15 um photon is between 1 millionth of a second to a few tenths of a second.
That means an excited CO2 molecule (after absorbing a 15 um photon) collides with another molecule between 6,100 times to 1.2 billion times before it can re-emit that 15 um photon.
How does that change the physics theory behind radiative transfer and back-radiation? This time, it is not a rhetorical question.
SteveF (Comment#70154)
February 20th, 2011 at 10:04 am
“Thanks for the Tamino link, I had not seen that………Based on the volcanic adjustments he made, it looks like the underlying trend for 1979 to present is about 0.14 – 0.145C per decade. How much of this (if any) is a result of the AMO run-up over the late 1970′s to present, how much (if any) is the result of falling power plant sulfate emissions in Europe and North America, and how much (if any) is the result of rising sulfate emissions in China are (for me) the only significant remaining questions. The AMO free trend is likely over 0.1C per decade in any case; exactly how much over 0.1C per decade is unclear. The net contribution of changing sulfate emissions over the 32 years is (I think) essentially unknown, though my personal guess is that sulfate emissions will turn out to be much less important that many claim.
Steve,
You seem to want to adjust downward due to AMO. When I looked on Wikipedia (http://en.wikipedia.org/wiki/File:Amo_timeseries_1856-present.svg), if I am interpreting correctly, a strong positive phase (which I assume is characterized by higher SST?) was associated with a med-century cooling (1940-70), and the negative phase (lower SST?) associated with a robust temperature run-up in the 1980s and 1990s. Can you comment on that and on your reason for the large adjustment you mentioned for AMO?
Thanks.
–Owen
Bill Illis,
.
I will try to address this. Yes, an excited CO2 molecule (after absorbing a ~15 micron photon) will collide on average with lots of other molecules in a very short time; and chances are very good that the excited state (vibrational energy) will be converted to a “ground state” via a collision. The energy is converted mainly from vibration to translation (AKA sensible heat). Now the normal population of CO2 molecules will (via random collisions) also from time to time produce a CO2 molecule which is in a vibrationally excited state (the process works both ways, as it must), and any excited CO2 molecule can spontaneously emit a 15 micron photon in any random direction. The majority of vibrationally excited CO2 molecules do not emit a photon (they most likely become non-excited via collision), but there remains a finite probability that one will. Since there is always a population of molecules in the excited state, there is always a continuous emission of 14 micron radiation in all directions from CO2 gas. When the temperature of the gas rises, the population of CO2 molecules in the excited state rises, so the gas as a whole emits more radiation… one again, in all directions. It is the random emission of photos which represents the “back-radiation”. The warmer the emitting gas, the more “back-radiation”. Of course warming the gas with a flux of 15 micron photons (as from the surface of the earth, for example) warms the gas and results in more back-radiation as well.
.
Back radiation by infrared absorbing gases is well known, measured and quantified. This is not a subject that really needs debate.
Re: Bill Illis (Feb 22 18:51),
If you want more detail, I did a post at The Air Vent on just that subject.
The essence is that an excited molecule doesn’t know how old it is and a certain fraction will emit a photon at any given time. The lifetime of an excited molecule is irrelevant. Well, maybe if the lifetime was on the order of attoseconds. But it’s not. It’s a lot longer. That fraction is determined by the decay time constant which is the Einstein A21 coefficient. Oh, and most of the collisions are elastic so no energy is transferred. Still, the probability that an excited molecule will emit before being deactivated is less than 0.0001. This is, in fact, required for local thermal equilibrium to exist and emissivity to equal absorptivity (Kirchhoff’s Law of radiation). Old news in other words.
Think radioactive decay. The half-life of 238U is 4.5E9 years. So if I have a mole of uranium, how many decays will I measure in the next ten seconds? I’m running out of editing time so I’ll continue this later.
SteveF:
I think it does make a difference for the others who lurk, to have the reasons why Andrew is wrong explicated.
The answer is 2.9 E07. For one mg of 238U the rate is 12.3/second. Now the half life of an excited CO2 molecule is 0.45 seconds. That makes the decay rate or photon emission rate, which depends only on the instantaneous concentration and the half life, rather substantial even though only about 4% of molecules are excited at any given time and the concentration is only hundreds of ppm. Avogadro’s number is really, really big.
BobN
‘having an open mind regarding other sciences or at least admitting that atmospheric CO2 concentrations may have some impact on the earth’s climate system”
There’s that word “may”again.In other words you cannot state categorically that CO2 has an impact on the climate system.
Lot of people telling you it does,or are they all using “may”too?
Liza,you are wasting your time,people who have been fooled by the belief in their own intelligence will never concede that they have been fooled.
Steven Mosher-You are the one with blind faith.You have faith that the temperature records for the last 100 years are accurate.That completely ignores human nature.Sure the temp readers struggled through snow,ice,rain,heat to read the thermometers.
I believe that the temperature records “may”have been corrupted by people failing to do their job.
LOL.
Owen (Comment#70432),
I am not sure I completely understand your question/comment. The graph shows a fairly clear rise in AMO index from ~1978 to about 2006. If you regress the AMO signal against the temperature history, there is a very reasonable correlation; higher AMO corresponds to higher temperature. The correlation is not perfect, but is quite strong: the AMO index multiplied by ~0.4 – 0.45 is a reasonable proxy for average global temperature variation around an underlying trend. Some people (legitimately) question if this correlation is really related to causation. It is difficult to answer this question of course. However, remembering that the AMO is a detrended index of North Atlantic ocean surface temperatures, it is at least plausible (not certain, but plausible) that the AMO index is indicative of a natural period of oscillation. The same basic pattern shows up in the overall global average trend. Could it all be coincidence? Sure. Could it be utter nonsense? Sure. But there has been enough published about the AMO to suspect that it may reveal something useful about the magnitude of natural oscillation around an underlying trend. Time will tell, of course.
Re: Owen (Feb 22 18:54),
It’s not the phase, it’s the rate of change in the index. It was declining (more or less) from a peak around 1950 to a minimum in 1975. That’s the period when global temperature was flat to down. It’s been climbing since 1975 and so has the temperature. It’s possible that it’s at or near the peak now. There was a big spike this year probably caused by the El Nino. If the AMO index does represent an oscillation (controversial) and it does decline over the next decade or two, then global temperatures won’t go up as fast as predicted. That would then mean that the flat spot from 1950-1975 was not caused mostly by aerosols and the climate sensitivity is at the low end of the IPCC range.
Noelene (Comment#70438) February 22nd, 2011 at 8:22 pm
Thanks. 🙂
I’ve asked the question of error margins for all those thermometers more then once here. Never an answer. The gods must be jealous of their flawlessness. 😉
“Andrew_KY (Comment#70429)
February 22nd, 2011 at 6:19 pm”
(Not A Rhetorical Question:)
“Lucia, what are my new commenting parameters?”
Andrew
Steve and DeWitt, Thanks for your comments. I’ll buy (for now) the assertion by DeWitt that it is the rate of change of the index rather than the phase itself that is more important in predicting global temperature behavior.
Making this assumption, could we (i.e., Zeke or Tamino or another) not fit surface and satellite temps to the AMO index as they did to MEI and volcanic activity to adjust for its impact?
Tamino, by the way, has an interesting analysis (and of course, a different take) of AMO and global temps:
http://tamino.wordpress.com/2011/01/30/amo/
Great comment from a poster at CA
“I’m a chemist myself and understand exactly what you mean. After over 27 years in this discipline starting with RND and QC, even with advances in instrumentation, I’m fully aware about how much are the difficulties involved in measuring low concentrations like ppm and ppb and measuring nanogram levels. And I’m aware of error margins and sensitivities and the need for absolutely ruthless data and method validations and controls.
So when you see these so called †scientists †with their sloppy data, lousy methods, non-existent data archiving, blatant data manipulations, lousy maths and lousy statistics proclaim accuracies to the order of 3 decimal points, I feel like throwing a boulder at the whole lot of charlatans.”
January 2011 blizzards, everyone in the NH freezing…down all the way to Mexico and Florida…and you guys believe “warmed” Jan. anomaly is 0.194C for the whole world without disclosing any error margins. The arrogance is stunning.
Owen, I think Tamino is correct that the way AMO gets measured:
Unfortunately this is yet another example of Tamino assuming the conclusions, since it can still actually both ways, really not having an “open mind,” and furthermore Grant is constructing a strawman argument that nobody (with any sense) is making:
I doubt he “regularly” gets such comments, because he would moderate them into the bit bucket.
What people (with any sense) are saying is that ocean cycles can affect the baseline temperature, and this is a completely sensible observation:
Atmospheric ocean oscillations affect for example global albedo, global albedo affects net radiation balance, and this affects the the global “temperature set point”. It’s probably even the explanation for this.
(And yes, Dorothy, a negative temperature trend is cooling. That’s what cooling means.)
Good timing Carrick. I’m in the middle of doing the analysis for a post on AMO, looking at the problems with trying to correlate it with post-1970 temps, and alternative ways of teasing out the unforced component (e.g. differencing north Atlantic SSTs from global SSTs excluding the north Atlantic).
Sounds very interesting, Zeke. Looking forward to how you tease this out.
One thing I thought about was looking at other proxies for AMO.
Re: liza (Feb 23 10:10),
“January 2011 blizzards, everyone in the NH freezing…down all the way to Mexico and Florida…and you guys believe “warmed†Jan. anomaly is 0.194C for the whole world without disclosing any error margins. The arrogance is stunning.”
for hadcrut the error margin is documented in the papers ( the method). There are actually two datasets most people use the varience adjusted. If you or anybody else wonders about it you should read the science and not the press releases. Nobody believes that the average is known to 3 decimal places. the guys who paint pictures of todays climate are good but not that good.
Owen, Zeke and Carrick,
Ron Broberg has a series on fitting curves to the surface temperature record and analyzing for periodic or quasi-periodic behavior. Here’s one from somewhere in the middle of the series which fits a sine and exponential function to the different temperature records:
http://rhinohide.wordpress.com/2011/01/19/lines-sines-and-curve-fitting-11-more-extrapolation/
There’s more later including Fourier transform and wavelet analysis.
Andrew_Ky
I’d edited my “pause” comment plugin when the ‘haha’ arrived to create an array of people who have to wait much, much longer than everyone else. You have to wait a long time between comments. I’m not sure how long it is– about an hour I think.
Re: John M (Feb 22 18:18),
John. I think a few people here miss my point. What I am doing is highlighting the shifting idea of “proof” that some people have. Do I believe in an LIA? yes.
How precise is our understanding? how firm is the evidence? good questions.
Do I believe it is warmer now. Yes. and our evidence is better and our precision is higher.
One the other hand I routinely run into people who doubt that it is warmer now. they doubt the notion of an average temperature. They question the completeness of the network, the question everything about the data we have.
For these folks I like to ask the question “do you believe in an LIA?” OF COURSE they say! Do you believe in a MWP? of course they say. And when you ask for the evidence what do you get? well you get what we got. Scattered, imprecise, data and proxies. So I find this odd. I see a change in their skeptical attitude when it comes to something they believe in. I call this slective skepticism. I illustrate it by being skeptical of the LIA. as an object lesson. Which SteveF and Carrick will tell you is a waste of my time. (they are prolly right) but I’m always trying new ways to make people look at the beleifs they hold. old philosopher. shrugs
“slective skepticism”
“Do I believe in an LIA? yes.”
“Do I believe it is warmer now. Yes.”
Steven Mosher,
Sounds like they only difference between you and Selective Skeptics is your selective belief in Global Warming.
Lucia,
I got a message earlier that said I hat to wait 153 minutes. That’s longer than an hour, I think.
Andrew
Andrew–If it said 153 minutes then the correct answer was “over two hours”. When I wrote “I’m not sure how long it is” I meant “I’m not sure how long it is. It’s whatever length it is.
I would greatly prefer if you switched to a mode where your comments tells us what you believe and why instead of just interjecting snark as in your comments about Steve Mosher’s previous comments. Those don’t add anything useful to the conversation.
Mosh:
I don’t think it’s a waste of your time to say it once.
It’s a waste of time to keep repeating it to the same people who have never shown any real ability to reason.
I’ve started using the Gulf Stream in my reconstructions rather than the AMO (the AMO region is really too big anyway to be independent of the global temperature series).
The Gulf Stream along with the other major oceans currents going west-east at the 40 latitudes off the west coast of the continents (the Gulf Stream, the Kuroshio, the Brazil Malvinas Confluence, the Agulhas, the south Pacific Gyre) do not exhibit the trend upwards that the AMO and PDO show in the raw data. They also correlate better with the global temperatures.
http://img833.imageshack.us/img833/6932/gulfstreamjan11.png
You can see this idea in an animation of the last 30 days of ocean currents as modelled by the US Navy NLOM 1/32 degree model. (It is interesting so have a look).
http://www7320.nrlssc.navy.mil/global_nlom32/navo/WHOSP1_nlomw12930doper.gif
Re: Bill Illis (Feb 23 19:08),
That qualitatively confirms my theory that the short term oscillation in Arctic ice extent is due in part to pulses of warm water coming up past Greenland. I bet if you had the numbers for just the Greenland and Barents Seas ice cover the correlation would be near perfect.
Steve Mosher once again this is BS.
“”I like to ask the question “do you believe in an LIA?†OF COURSE they say! Do you believe in a MWP? of course they say. And when you ask for the evidence what do you get?””
NOT TRUE. Because of your lack of background in the sciences involved maybe you believe that. The LIA and MWP are NOT somet new idea. Both events were well understood years and years ago. I explained this to you before and you don’t get it. I said many branches of science are involved too.
Maybe your mind need to “get rid” of these facts so what you BELIEVE makes sense.
“Did you know that as a result of the Little Ice Age, better violins were invented and that Americans actually drink 11 times more beer than they do wine? Utilizing specific scientific evidence, extensive research, on-location explanations, expert interviews, historical facts, and first hand accounts of triumphs and tragedies, Little Ice Age: Big Chill explorers all facets of one of the greatest scientific phenomenons in recent history.”
http://www.history.com/images/media/pdf/ice_age_study_guide.pdf
” From a policy perspective, the difference between 0.14C or 0.16C or 0.2C is utterly irrelevant. Any of them herald a warming trend which offers the certainty of highly costly and destructive changes, along with a variety of possible civilization-threatening disasters.”
Considering that the global average temperature is 7.5C cooler than most of us set the thermostat in the house, that any day of the week there is a minimum 10C change in temperature outside where moust people live, I have a real hard time seeing that .2C PER DECADE is anything that any of us could feel in our lifetimes.