Folks may remember that about a year ago the National Review wrote an article called Bastardi’s Wager, remarking that meteriologist Joe Bastardi:
…proposes a wager of sorts. “The scientific approach is you see the other argument, you put forward predictions about where things are going to go, and you test them,†he says. “That is what I have done. I have said the earth will cool .1 to .2 Celsius in the next ten years, according to objective satellite data.†Bastardi’s challenge to his critics — who are legion — is to make their own predictions. And then wait. Climate science, he adds, “is just a big weather forecast.â€
I proposed to take him up on that wager for a Romneyesque $10,000, based on a model of combining past trend with noise originally proposed by Tamino:

After some discussion, we mutually agreed to make a wager on steak dinners instead, not in the least part due to the legal difficulties of making binding bets in this country. Joe suggested that:
Lets make it more fun. Lets take the global average via satellite the last 10 years and up the ante. Every .1C the temp is below the average per year, Zeke owes me one steak dinner. Every .1 its above, I take him out. We meet, discuss the overall idea, who is winning and losing and then see who is fatter at the end of the 20 years. So year to to year, we start now and see what is going on.
I accepted these terms, proposed using UAH as the record, and created this chart to show the relative areas that would allow each person to claim their steak dinner:

Its worth pointing out that even if the underlying trend remained constant or accelerated, I would still expect to pay for one or more dinners for Joe over the coming decade due to natural variability. I thought this was reasonable, as I would still emerge fatter and happier at the end of the decade, and it makes things more interesting when one side or the other wins more along the way.
So now that UAH has reported all monthly in 2011, we can see how things turned out! Would it end up a cool year like 2008, where I would owe Joe dinner, or a hot year like 2010 where he would owe me dinner?
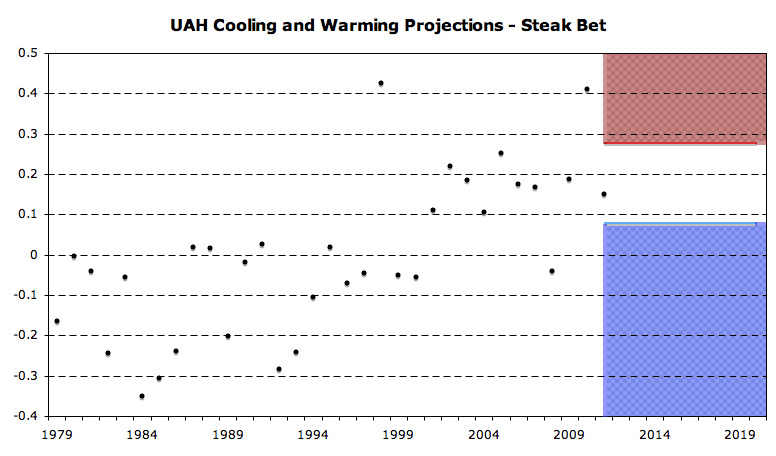
It turns out that the only winners this year are the cows, as the 2011 value of 0.15 falls just a tad below the 10-year mean.
Update:from lucia For those using feed readers, I have very strong reason to suspect that images are blocked for most of you. Owing to the way cloudflare works, they likely remain blocked even when you visit the blog. I didn’t know if this would happen, but I knew it might– that was why I was asking people about the lavender and yellow images. Weekends are a bad time to fix things, but I have time scheduled to fix this on Monday. If I can fix sooner, I will. If you do read in a feed reader and are having no problem, let me know that too!
Fixed the new graph to use the 2001-2010 average for comparison (accidentally used 2000-2010).
No steak dinner! Oh well, maybe next year. (Readers are likely to trickle in. Many are going to have to read, guess the blog is back up and click for the “live version”)
So if there is a strong warming, you will end up decimating cows, thereby reducing methane emissions….
Did you think of notifying the IPCC about this new negative feedback you’ve just added to the climate system? 🙂
toto,
Cows will perish, but has it been demonstrated that they will not be replaced by new ones? Is there an agricultural economist here who can advise on matters bovine?
Oddly enough, one could credibly argue that eating more cows actually increases the supply of cows (and, thus, methane emissions) by increasing market demand :-p
James Annan just lost a 100 British pound bet, betting temps would rise above those in 1998 during the last 4 years.
http://www.thegwpf.org/the-observatory/4748-winning-a-climate-bet.html
Zeke
Out of interest, as emissions of cows has been mentioned, does anyone have a figure or reference for percentage (excess) CO2 from cows and humans ?
There was another bet, for £100, between astrophysicist Dr. David Whitehouse and climate scientist Dr. James Annan, via the BBC radio programme “More or Less”, (a programme about statistics believe it or not). The bet was whether or not the years 2009 to 2011 would be warmer than 1998 according to HadCRUT3. As they weren’t, Whitehouse won the £100.
The programme is available to listen to on the following link, although I am not sure if those outside the U.K. can listen.
http://www.bbc.co.uk/programmes/b0196v3z#synopsis
There is also a bit of a discussion between the two.
BTW, does anybody know what J.B. is predicting for 2012?
A good day for cows!
Given the .2C cow safe zone designed into the bet, I suspect several more cows will have a chance to run free. With last month’s PDO reporting it’s lowest anomaly in 50 years (-2.33C) I don’t anticipate a rapid rise in global temps for a while.
re Annan-Whitehouse, it was interesting to listen to that because it shows how reluctant the modelling community is to relax any assumptions about the Earth being some kind of perfectly manageable and understandable entity. Whitehouse, on the other hand, clearly thinks there is a lot of not-understood randomness about what happens in the atmosphere.
“Out of interest, as emissions of cows has been mentioned, does anyone have a figure or reference for percentage (excess) CO2 from cows and humans ?”
Methinks its methane.
PKthinks (Comment #88583)
January 13th, 2012 at 3:06 pm
Zeke
Out of interest, as emissions of cows has been mentioned, does anyone have a figure or reference for percentage (excess) CO2 from cows and humans ?
Cows, having hitched their evolutionary fortunes to humanity, have emerged as one of the most successful – i.e. numerous – large mammals on the planet. Effectively, you should not distinguish between cattle and human CO2 outpuit since they’re tied in a more or less commensal relationship. Likewise with rats, crows, and increasingly, in the US, coyotes.
Far better to offer them a 50-50 bet.
If its above prediction for the year – you pay.
If its below, they pay.
Run for 10 years.
Methane in human farts is low.
It’s mostly H2.
DXuster
you forgot dogs…they can fart with the best of us
By the way: If anyone has any trouble seeing any images in this post, let me know. I know some requests are blocked (as they should be) but owing to some of the weirdness involved in cloudflare caching, I can’t tell if those are people. If you are a lurker and don’t like to comment, you can use the contact lucia link.
Thanks Zeke for laying out the graphs.
Don Easterbook, Timothy Patterson, Nicola Scafetta and others have published models that appear to align with Joe’s predictions.
I think I’ll vote with their rationality rather than with the opposing Empire.
PS Lucia – I don’t know if I see what you see or expect me to see (I presume I do but don’t know). I suggest posting a PDF of what you expect us to see at some archive that we can download directly to compare.
From a recent edition of QI hosted by Stephen Fry:
“The thing that burns when you set light to your farts is hydrogen. Only a third of people produce methane in their farts. On average you produce three pints of farts a day, releasing it between 10-15 times a day. The practice of setting fire to your farts is called “pyro-flatulence”. A study at Arizona University in 2009 showed that fat people fart more. Most of what makes a fart does not smell. The smelly bit is made out of skatole, indole and hydrogen sulphide.
During the Great Plague of London doctors recommended that patients should store their farts in jars, and if they felt unwell they should smell the fart to make themselves feel better.â€
Hmm. If the IPCC is “The Science”, then wouldn’t a fair bet look like one side taking less warming than the IPCC projects and the other taking more? So if the IPCC is right, then it’s a 50/50 bet. I would be willing to take one side of that bet. Do we have any “It’s worse that we thought” types out there?
I know this is of topic , but The figure of 1 kg Co2 http://www.epa.gov/climatechange/fq/emissions.html#q7
expired a day for humans and somewhat greater for cows( a billion ) gives a figure well in excess of 2.5 gigatons of co2 which has doubled in the last 50 years . Thats a significant amount of anthropogenic CO2
Tilo:
They’d always win. Everything is proof they’re right.
Warmer, colder, wetter, drier, cloudier, sunnier, the same. All proof.
David:
There are a bunch of graphs in this post. The logs suggest that either some people or some bots cannot see any graphs. That is: if you see absolutely no graphs, I want to know that.
You wrote
This suggests you can see graphs and answers my question: You are seeing images.
The reason I asked in comments is that looking at my logs, I was surprised no one volunteered “I can’t see the graphs!” hours before I asked people if they could not see them. Given how many image blocks the script through up, I should have had several dozen people complaining they could not see the graphs.
No one complained. This suggests that the things not seeing the graphs are bots who are either: a) spoofing referrers or b) subscribing to the feed and hoping to strip images that way. In both cases, it means what I did is actually achieving it’s goal of thwarting bots without blocking people.
But I can’t be sure I’m not blocking people because unless I ask I can’t know whether the people being blocked might not just be silent lurkers who don’t like to complain. Right now, I need people who see no images (i.e. graphs) in Zeke’s post to complain.
If I were Joe, I wouldn’t have made that bet. The expected outcome in an environment of rising GHG forcing is gradually rising average temperature (the important issue is how much/fast that expected rise!). While Joe may be treated to some dinners just due to variability, and might even win more dinners than he pays for if a pseudo-oscillation like AMO keeps the temperature for responding to rising GHG forcing, in the long term, increasing forcing has to increase temperatures. Maybe Joe has some information on AMO (or similar) that makes him think this is a reasonable wager for the next 20 years.
Lucia
Fisrt two graphs do not appear. The last does. Reading directly from the site not a feeder.
Lucia –
I’m in the same boat as Dudley: first two graphs don’t show up, the last one does. I could see those graphs yesterday, though, if that helps.
And by the way, I can’t see a lavender box with an X on this post! 😉
Dudley—
Weird. You have a very unusual user agent. There are only 11 requests with that all clustered together so those must be you! It also shows you commenting 10 seconds before the requested the image! I’ve long suspected there is something odd about times and server logs. Or, maybe not odd, just something I don’t understand. I know for sure things look weird with cloudflare, because I look after I connect, and I’m pretty sure some of my hits must just come straight from cloudflare and never get logged on my server. This makes somethings really weird to interpret!
Assuming you don’t spoof agents (and I don’t know why you would), I can’t figure out why you were denied the image. Maybe it has something to do with cloudflare and caching. Cloudflare makes a browser cache for somthing like 4 hours and you can’t overide it. Do you remember if you viewed in a reader before you visited the blog?
Could you clear your cache and then tell me if you can see the images?
Harold: Could you clear your cache? Also…. tell me if you remember viewing in a reader before visiting the blog.
SteveF
Maybe he thinks he does. But my impression is that Joe thinks AGW is negligible; if so, it makes sense he would not expect long term warming. But even so, he’d have to be very confident about the AMO to bet on short term cooling.
Lucia –
Cleared cache, same result. And I wasn’t using a feed reader; I only visit directly.
HaroldW–
Hhhmmm…. Well, that’s data. I’ll go look at the logs and see if I can figure out why you are having the problem.
I think (though I am not sure) I’ve learned what I need to know. I think what I’ve learned is that I do need to add about 5 lines of code to a particular php file that I use to handle certain image requests. I was planning to do this, now I need to move it up in the schedule. 🙂
Lucia: “By the way: If anyone has any trouble seeing any images in this post, let me know.”
I see the 3 graphs. If there are images of people, dogs or cows farting, I’d rather *not* see them.
Harold, Dudley,
Thanks for the data. I think I’ve figured out what happens! It has to do with cloudflare. Now I need to think of a practical work around that will thwart the bots while creating minimal interference with images on recent posts.
By the way HadCRUTv4 is being released and shows 2010 and 2005 as warmer than 1998 because they added in Russian and Arctic Stations. See James Annan’s website.
Robert, I don’t think it’s statistically significant though, is it?
People like to play with central values, but as scientists we know there are uncertainties in the measurements, and you really shouldn’t compare differences in numbers without folding in the uncertainty associated with them.
Lucia
First 2 graphs missing. I cleared cache. I am not using feed reader – direct visit, always.
Carrick–
It will be interesting to see the numbers when they come out. Last year I was watching to see if we set new records, and it will be interesting to see if retroactively, 2010 was a record with the soon to be available HadCrutv4. Squinting I can’t see if it was warmer than 2005.
Lucia:
I also see only the last image. In the other two spots it says “image1” and “image2”
Hope this helps.
Roy
lucia,
I see the third image but not the first two. I’ve tried with Firefox 9.01 and IE 8.06 in WinXP and IE9.08 32 and 64 bit in Win7 64bit.
Taras/Roy–
Your data comfirms my theory of what is happening. I think I know how to fix, but will be doing it Monday. It will involve about 4 lines of code, clearing the cache at cloudflare, and changing a few things in .htaccess! It won’t take much time, but I want to make sure I don’t screw up– and also monitor after I do it, and we are on or way out to the inlaws in 30 minutes.
RE #88608
Carrick,
Contrary to popular belief I think Joe has a good shot at the next 10 years. I do think Zeke will own the following 10 though. I am one of those kooks that believes in long term GHG warming but the Sun and the oceans still rule average annual global temps.
Get your cardio in now and eat whole grains Zeke cause some steak dinners are coming your way:)
DeWitt– Yep. My theory– based on who has reported it’s happened to them and inspection of access logs and my special purpose log is this:
Around 9:25 am this morning, someone loaded images using an iphone based feed reader. The way they accessed sent them to the “imagediversion” script– which is what I wanted. This then my server send a “refused” to them. So far, so good. That’s what I wanted to happen. (It might not be what they wanted, but it’s what I wanted.)
But then, what? Well, cloudflare is involved. The cloudflare IP address 173.245.52.75 that was involved with that specific access. Now, cloudflare has “filled” the cache for that IP with the redirect to the image diversion script. So, now, everyone who accesses using IP address 173.245.52.75 is going to the image redirect script. This applies to one image, a slightly different IP applies to the other image!
To fix this I’m going to add something to the image diversion script that looks at how you accessed. If you are a “good” access, it will fetch the image using
imagecreatefromjpeg($imgname) (or the appropriate for png and gif)
and then even if people get redirected to the image diversion script because of the glitch, they will see the good image.
But.. I need to program things to pass the correct stuff and check! I’ve been writing and testing… but I don’t think it’s going to be properly tested before I go out for pizza. So, likely it won’t be fixed until Monday.
But you guys are great! Telling me really helped (even though I was really scratching my head with Dudley Robertson. But the fact that he uses a relatively rare useragent helped eliminate a huge number of alternatives! So, thanks Dudley for using an unusual user agent.)
Will the use of Hadcrut4 likely change the trend? It would seem to be good timing if so – next months data would certainly have led to Hadcrut3 showing 15 years of cooling. Which of course many would have used for PR purposes…
FWIW -all images are present and correct for me.
We always have a clear signal here in London 🙂
Carrick
It’s like religion, you can always find a quote in the bible that proves your point.
Be warned, Anteros. Your clear signal may be about to be interrupted by a re-entering Phobos-Grunt satellite! Although, according to the news reports, in London you may be a bit safer than I am (some 25 miles South of you). 🙂
lucia,
Now I see all three graphs. How odd.
You may have screwed up by not giving yourself an out in case of a large volcanic eruption during the decade of interest. That could cause you a couple of years of steaks. It doesn’t mean Bastardi is right, though.
Oh, and by the way: I see 1 and 3, but not image2.
If HadCRUT4 makes 2010 and 2005 warmer than 1998, it seems a fair bet that it will change the trend.
DeWitt/Kap–
Yep. That means someone came along and filled the cloudflare cache for the IP cloudflare sent you through with interfering stuff. Meanwhile, the IP that used to hold “image 2” for DeWitt cleared it’s cache. The effects are very weird– but I can fix it now that I know what’s happening. In fact….it occurred to me that I don’t need to use imagecreatefromjpeg($imgname) . I just need to redirect back to the image for those that shouldn’t be getting the thing cached at cloudflare.
Ray –
Fair point (and which renders my question a little naive..) although it might be a adjustment that has some ad hoc features… but you’re right. I suppose I don’t know the adjustment being made so something in me erroneously assumed 1998 would be ‘warmed’ as well.
My suspicions are definitely aroused, but then that is probably very tribal of me – I don’t have the same feeling when I hear that version 6 of Roy’s algorithm will remove some recent ‘warming bias’.
Holding my two reactions together is quite instructive..
*
In fairness to myself, when I take a quick look at “what is going on with global temperatures” I use the Wti composite data set. Seems a neutral un-paranoid thing to do.
*
Lastly, I’d got my head around the fact that it was going to be fun to see Hadcrut3 showing 15 years of cooling, so it’s perhaps a little bit more than paranoia on my part
Bovine belching is what contributes, not insignificantly, to the methane in the atmosphere. Grass feed cattle produce more than those in a feedlot.
Sorry, but I originally posted this at a non flatulence and non belching thread.
In the National Review article, Bastardi is quoted as saying ““Carbon dioxide is a trace gas, a tiny gas, part of this huge system. You’re trying to tell me that’s going to control the system and influence the energy of the system? When you have things like the sun, which is obviously the greatest contributor to the world’s energy? It almost defies common sense.â€
Anteros.
Sorry, I may be wrong, and we won’t know until we see the actual figures but it’s just my guess that the trend will be more positive.
I am suspicious too, since as far as I can tell, the additional stations have been included with the precise intention of reducing the recent cooling trend. Of course the argument will be made that this is simply “correcting” HadCRUT, which to an extent is true, but I can’t help thinking that there is something wrong in adjusting a data series with the purpose of making it go in the direction you think it should be going.
Zeke,
In light of all the incivility surrounding the topic of climate change, I commend you and Joe on your civility and good cheer. We all need to spend more time breaking bread with each other rather than hurling names.
But speaking for the cows, couldn’t you just bet a garden salad? 🙂
Why would you trust UAH, they still have not published the software for computing the majic TLT product?
Lucia,
Images 1 and 2 are not displayed; the third graphic is displayed but I’m not certain that it is complete.
Why hasn’t UAH published their software?
Eli –
Surely you Josh?
*
It isn’t a question of ‘trusting’ UAH – who is doing that?
Betters are just gambling on a published figure.
*
Perhaps you should change Wabbett to Muppet 🙂
http://thinkprogress.org/wp-content/uploads/2011/08/bastardi5.jpg
Does anybody know what Bastardi’s name means in Italian? 🙂
Some may have heard of Lovelock’s Daisy World. Well in this instance we have “Cow World” the cows are going to adjust their emissions and spots so as climate will stay within the 10 year range thus ensuring they are safe from climate punters.
Hi Lucia
can see the colour box’s as you describe.
Happy new year by the way from a lurker
oops & you to Zeke
SteveF
Maybe Joe realises that Co2 is the lowest its been for a very long time geologically. And with an 800 year lag he knows it doesnt affect temperature more than a negligible amount as lucia said.
Just a thought.
Ant42–
Point of clarification: I think CO2 affects temperature more than a negligible about. I think Joe may think otherwise.
posted for SteveF-lucia
“Ant42,
I’m in the Far East right now, so I’m “upside down” on time.
WRT to CO2 concentrations, the last half million years or more it appears to have varied between ~175 PPM and ~290 PPM. Current CO2 levels (~395 PPM) appear higher than at any time in at least the last half million years, and probably longer than that. Whether that counts as “geological” depends a little on your definition I suppose.
.
WRT sensitivity to CO2: it really is not clearly known what the true sensitivity to forcing is, although I am pretty sure that it lies near or below the IPCC estimated range; my best guess is ~1.5C per doubling or a bit more. But that said, I don’t think 1.5 C per doubling is negligible. 800 years of lag? Not sure where that comes from. There is a lag between temperature changes and CO2 concentrations during glacial/interglacial cycles (of about 800 years), but I am not sure how that is related to CO2 increasing independent of temperature change (due to fossil fuel burning); they are completely different effects. “
Zeke and Bastardi should still meet up for dinner and have a discussion. Having a healthy discourse can only be of benefit to both of them. On the issue of paying the bill, just go Dutch.
I don’t know what Zeke could learn from Bastardi.
tests to see referrer when I post a comment.
2nd test to see referrer when I’m not spoofing. 🙂
Joe has new post on WUWT. Apparently, temperatures are “in a crash”.
.
He’s using the same UAH data as you.
.
No, I don’t get it either.
Re: toto (Jan 19 09:03),
From the linked WUWT post, it appears that Joe doesn’t believe in RTEs, thus [CO2] is irrelevant to surface temperatures.
People are free to not “believe in” Bernoulli’s law, evolution, or information theory. They can still benefit from commercial air travel, new antibiotics, and iPhones.
Hard to argue with such things. But probably not fertile ground for a technical conversation on the subject in question.
Re: AMac (Comment #88772)
He does seem to live in a separate reality.
I’ll make a “bold” prediction right now: the UAH 13-month running average (red line in this figure: http://icecap.us/images/uploads/UAH_LT_1979_thru_December_2011.png)
will never again drop below -0.1. I’d be very surprised if it ever even touches zero again.
julio –
I’d concur….until I saw Pinatubo-the-sequel on the horizon. Especially if it coincides with the 2014 La Nina…..
julio:
If we have a major (equatorial volcanic) eruption in the next five years, it easily could drop to that level for a few years.
Long term, it all depends on what plays out in terms of anthropogenic aerosol emissions, and what influence they end up playing on climate. Some models are predicting no observable anthropogenic warming until around 2040 for example (shades of 1945-1975).
[Postscript: What Anteros said. Note that Pinatubo lead to about 0.4 °C of cooling.]
julio,
You may be right, since the (mostly ENSO driven) variation about the longer term trend, absent volcanoes, seems to seldom go more than 0.2C below the trend. (http://www.woodfortrees.org/plot/wti/mean:12/plot/wti/mean:120) But a big volcano would almost certainly do it, and if the ~60 year pseudo-cycle apparent in the temperature history repeats itself, the trend could be pretty flat for a couple of decades, in spite of rising forcing. I wouldn’t bet any money on the 12 month trend never reaching zero if I were you.
I wouldn’t be surprised to see the anomaly reach both of those levels. Besides the objections stated above, there is the fact that the chart can be rebaselined, just as it has been not too many years ago. So you are really arguing for temperatures will never dip below a 30 year mean.
OK, a massive volcano in a La Niña year… could get us below 0. But my impression is that the current La Niña has run out of steam already, and things will start warming up again soon. In fact, the next minimum will probably not be much below 0.1 C, which points to a new “baseline” of around 0.3 C. My guess is a warming of about 0.1 C per decade for the immediate future…
For those of us saying to julio “I wouldn’t bet that if I were you” perhaps we should be less equivocal [or as bold as julio] and say OK I’ll bet you that it does!
*
Putting it like that, I’m suddenly not so sure, so kudos to julio for boldness..
I don’t think you even need a La Niña year, just another Pinatubo-like eruption will do it.
Carrick,
The interesting thing is that the effect of Pinatubo was reduced by el Niño where the temperature would have hit a minimum. The effect absent that el Niño would have been greater.
UAH will be adjusting recent years downward in Version 6.0 due to a spurious warm bias in AQUA, which will include 2011.
SteveF:
That is interesting. Do you know why that it?
I grok that a la Niña is not an “anti-el Niño”.
Point taken, though my belief is the temp should increase as Co2 increases, which just isnt happening for many other reasons. I think there is still a lot we dont know, but there is no way to prove Co2 has any more than a negligent amount on temps as yet.
And the point Joe rightly points out is we need another 150 years or so of data because all the other historical records have been adjusted so badly it should be dismissed, satelitte data in 150 years or so will probably be about 5 PDO cycles and 7 AMO cycles, plus many others, giving us a much better read on the climate.
Given we are still under Hansens scenario C since 200, which was his zero emissions target, who in their right mind could believe anything that AGW proponents say?
Julio –
You say the La Nina has run out of steam already. Do you have any quatloos wagered on the Jan anomaly? I think I’d be happy to have a little side bet that both Jan and Feb will turn out colder than Oct/Nov/Dec…..
Hansen has been very busy lately, auditing crucial surface station records, locating suspicious readings and making the necessary adjustments.
Pretty soon, the 1930’s will be back to the LIA.
Julio your own comment suggests you would lose the bet. If the new baseline is .3C, and the low value is .1C, then temperatures have reached -.2C. You think it’s impossible for the minimum after that to get no more than .1 or .2 above the last one?
For that matter, you specified the chart. And your chart would clearly have a point after 2010 that is at -.2C, even if it is only after an adjustment of baselines, and not at the time.
MikeN, I’m sorry my remarks about baselines were confusing. Let me clarify what I meant: I believe the 13-month running average will never again be as low as it was in 2008 (the previous minimum, according to that figure I linked). Is that fair enough?
And yes, a new Pinatubo could prove me wrong, but I think Pinatubos are very rare–volcanos are going off all the time and hardly making an impact at all. Basically I am assuming that by the time another Pinatubo comes along, the average anomaly will be so high, even that will not be able to bring it back to the 2008 minimum.
Anteros-
Put my quatloos where my mouth is, eh? But the monthly anomaly is such a random thing, I’d really not feel confident with such a bet at all. How about this: of the next three months, the anomaly will go up in at least two.
Julio –
Interesting.
FWIW, my feeling is similar to yours – I’d be surprised if the 2008 low is reached again (but that doesn’t mean it won’t)
I think your near-term monthly expectation is about right [a bit boring for quatloo-risking]. From the position of Jan being lower than Dec – which I expect – there is an evenish chance that Feb and March will both head back upwards. Especially if Jan is as low as a) the recent aqua reports are showing b) Bastardi is predicting c) I’ve gambled 5 quatloos on already [minus 0.017..]
*
Slightly O/T… RSS looks odds on to show 15 years of cooling when Jan numbers are in. Not particularly meaningful but I expect it to generate some noise and kerfuffle.