In comments on the most recent betting announcement, Steve_Ta wrote
Steve Ta (Comment #120978)
November 12th, 2013 at 10:22 amAs usual, the vast majority of bets (75%) are on the cool side. What does this say about the denizens of the Blackboard?
My response was
lucia (Comment #120986)
November 12th, 2013 at 11:08 amAs usual, the vast majority of bets (75%) are on the cool side.
I’ve never run statistics on this. Have you?
What does this say about the denizens of the Blackboard?
I don’t know.
ArfurBryant bet 0.342C which was too high. What does that say about him?
If we use their projection for the month, the vast majority of models AR4 and AR5 runs have overpredicted monthly values for temperature. What does that say about models runs?
Anyway, the exchange, particularly the “as usual” part of the exchange made me curious. I wanted to know of there is a cold bias in betting on UAH values and if it existed I want to know if it is strong. As I have access to the database, I pulled out all bets on UAH from the database. A file with moderately informative headings is here:UAHBets.
Bettors who examine the list may be surprised to learn that I do not store the actual observation in the file. Instead I store what the better bet it would be (example: 0.4C) and the difference between what they bet it would be and the actual value. So, if the bettor bet the outcome would be 0.4C, but it turned out to be 0.231C, difference is 0.400C-0.231C=0.169C. That value is stored as the difference. Note that if difference is positive, the bettor’s prediction exceeded the observed value.
 After creating that file, I wrote a simple R script. The script first filtered the “stupid” bets with “stupid” defined as those that were off from reality by more than 2C. Why 2C? Because that’s what SteveTa selected in his first cut in comment previously. This left what I call “saneBets”. Statistics of the saneBets are:
> mean(saneBets$Dif);

[1] -0.03599473

> median(saneBets$Dif);

[1] -0.03165

> sd=sd(saneBets$Dif); sd;

[1] 0.1813454

> count=length(saneBets$Dif);

> se=sd/(sqrt(count-1));

> t=mean(saneBets$Dif)/se; t;

[1] -9.27808
So: if we consider the mean and median difference between what betters bet and what Roy posted, the mean bet at the Blackboard was cooler than what Roy later posted. If we consider this in light of the standard deviation, the mean difference is piddly and corresponds to a ‘t’ of -9.27808. Using a rule of thumb, we can decree any t with an absolute value greater than 2 statistically significant, and this simple analysis suggests that Blackboard readers do bet cool relative to future outcomes.
Going a bit further, if we exclude bets that were bang on correct, we see roughly 41% of the “sane bets” are to warm. That means 59% are too cool.
> Denom=length(saneBets$Dif)-sum(0==saneBets$Dif) ; Denom

[1] 2179

> BetWarmFrac=sum(0
From a point of view of betting: if you want to win, you might want to consider bumping up your estimates of next months temperature about 0.03C.
I still can't answer SteveTa's question about what this "means". It may very well mean that the people who bet are rooting for cooler outcomes and are biased by what they hope will happen. Or, it could be something else. I suspect if someone was interested they could try to see if the effect remains if we consider the previous months reported temperature, the annual average temperatures, the values that were being reported at the UAH online satellite page and so on. I'm not going to do that, but if you are interested in doing so, you can snag the betting data.
Assuming I correctly uploaded, the script I used is here:AreBetsCool.
Wow – my simple sample of 10 months got a 58% low bias, which was pretty close to the final value.
I’m sure Lewendowsky could come up with a theory on why we tend to bet cool – something to do with moon landings, I guess.
Steve Ta:
Sooner or later there’s no point collecting more data. (not, as some have apparently decided, at n=0.)
Personally I never bet. But I usually look at the results. And if I did bet, my guess would tend to be close to last month’s value, or exactly the same as last month’s. If the global temp was going up and up in a straight line… I’d bet cool every month. If there were more “up” months than “down” months, I’d be cool by that proportion.
Note to self: if the global temp was going up in a straight line, only a fool would bet on last month’s value and not last month’s value plus the monthly slope…
As I stated in my earlier post, the “warmists” who bet consistently high in accordance with IPCC predictions lost all of their money early and simply quit playing!
R is cool. Apart from the spurious bracket (line 31, column 49) it’s just amazing that such a tiny program can do all that with pictures and all.
Steve Ta
Yeah. I’ve been postponing playing with it forever now, but I downloaded it yesterday and finally gave it a look. Importing HADSST3 data from a file on my machine was a matter of typing ‘SST <- read.table("SSTSavedDataFile").
I thought my eyes were going to pop out of my head. Really? That easy? Yup, that easy.
I could've parsed the file in C or C++ of course, but it was sweet to not to hafta. Loving it so far.
Lucia,
The bias does not surprise me. I bet that if you broke the bets down further there would be a strong correlation between the bettor’s estimate of ECS and the bias of the bet. Same bias happens with climate modelers, it is just a bit more sophisticated because of the complexity of the models. 😮
SteveF,
I’m most curious how people arrive at their bets. Do you think people consider CO2 for month to month estimates? (honest question).
I’m trying to roll an algorithm now to see if I can come up with a bet for next month, and after a first look around I’m thinking sea surface temps seems like the easy place to start. (I haven’t specifically looked at ENSO yet but it’s on my to do list).
Anyone care to offer any insight on how they come up with their wagers? Not asking in order to steal your secret sauce ( 😮 ) ’cause it’s not like my motto is ‘steal with pride’ or anything like that.. But seriously, do you use an algorithm or is it more subjective or some mixture of the two?
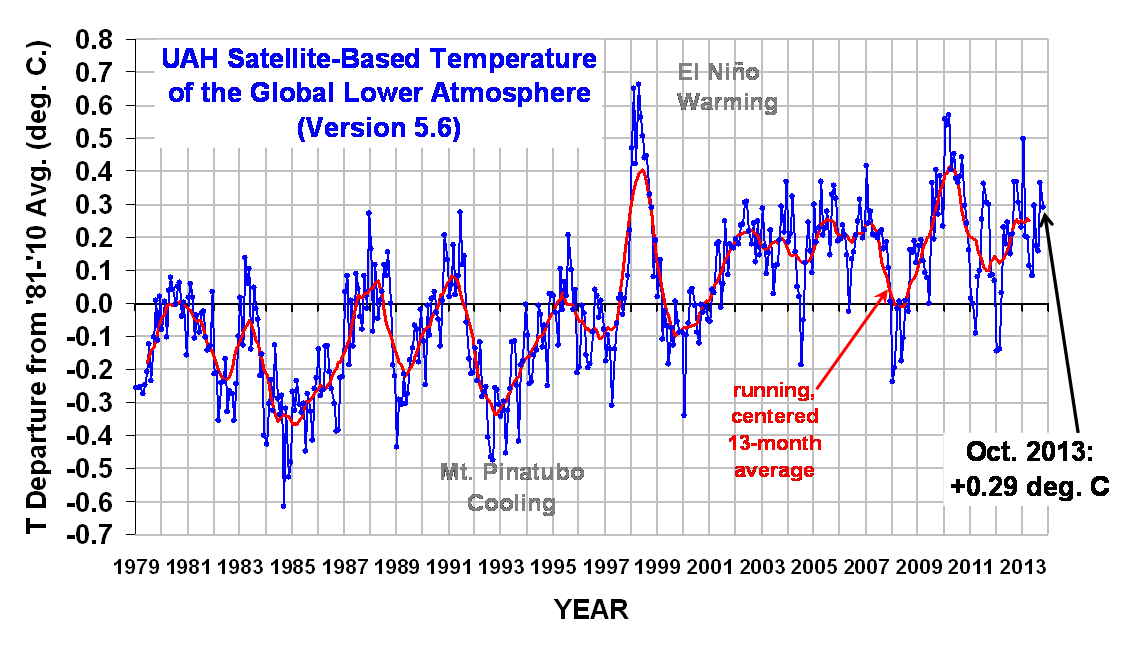
For temps, I eyeball a big copy of the temp graph, like the one in #120997, guess where the trend line seems to be heading, add or subtract a bit for likely movements for the time of year, then smudge the final number to make it seem more scientific.
From this month onwards, I’ll then add 0.03 (which I’ve just realised would have put me in 2nd place this month!)
Jit
Which monthly slope though? Since betting started (Aug 2009?) Since UAH started taking data? Since 1900? If we went with the nominal IPCC projection of 0.2C/dec, we’d expect a monthly increment of 0.001666667C. That’s much lower than the bias relative to the bets.
One difficulty is establishing a “cause” is that we have been betting only since August 2009. That was just after we came out of a deep La Nina, then temperature went above the previous 5 years.. then back down again.
And previously at least people used the AMSU– which then went faulty. So, what does it “mean” to have bet low?
I admit that like SteveF, I’m not surprised. This is the direction I would have guessed and my reason for guessing this is the flip side of bias I think modelers have. But the fact is, while it is clear that bettors did bet slightly higher than observations reported after the bets, and while the direction is consistent with what I might guess, I don’t really know my theory is correct. It might be that the bets could be “explained” by saying people just bet last months values and so on. To know we’d have to look. Then to confirm, we bet another 4 years to get out of sample data!
R is definitely cool, but I hate how it manages data at times. There are so many things like keeping track of when I can use []s to extract data and when I have to use $ that cause me trouble. The latest one was when I made a data frame of numeric data but somehow the data was read as a factor. Fixing it should have been a simple matter of using the as.numeric() command, but that turned out not to work. After some internet searching, I found I had to use as.numeric(as.character()) for some reason.
I imagine if you use R enough, you get used to all the nuances. I just wish it didn’t take so much work to do so.
Brandon,
Yes, probably just like anything else. My next simple effort was to plot two tables on the same graph. I devoted about 10 minutes to it (all the free time I had left) and didn’t figure it out. But I’m sure it’s easy once you know how, just like most everything seems to be in the end.
Mark Bofill,
I don’t think anybody looks at CO2, but who knows?
.
When I have done more than just a quick guess, I looked at the lagged Nino 3.4 index (look at one of my earlier guest posts for how this is calculated) and the previous month’s temperature. But alas, there is so much short term variation that even when you do your best to generate a rational guess the likelihood is that you will finish ‘out of the money’ because two or three people will better your guess by 0.01C or something. I think you could come close with an algorithm based on ENSO, the past moth’s temperature, and a very slight upward trend; but that is no guarantee of finishing in the money…. ever.
Mark Bofill wrote, “I’m most curious how people arrive at their bets.”
My betting method is similar to that of Steve Ta (#121045). Suspiciously similar!
By my Mark I Eyeball estimates, temp anomaly tends to change by 0.05 C to 0.2 C, month to month. Up, or down 😉
Building on this, my (soon-to-be) patented four-step process is to:
1. gaze at the UAH data (e.g. #121046),
2. ask, “Up? or Down?”
3. pick a number bounded by 0.05 and 0.2,
4. add (subtract) that number to (from) the most recent observation.
I note with humility that this sophisticated algorithm propelled me to Show (gross 0.128 quatloos) this month!
SteveF,
Thanks! I’ll go back and see if I can find that.
I see what you mean about short term variation. This is a lot harder than I thought :). I mean, it’s all very well and good to look at SST’s and say yeah, I sort of see how UAH follows it. Sometimes. Mostly. Sort of. But using the data to actually come up with a number that’s close?
Suffice it to say I’m not making any plans to retire on my hypothetical quatloo earnings at this time.
SteveF,
The fact that everyone recognizes there is a lot of noise matters. And it doesn’t do anyone any good to have the annual average of their bets be closest to the annual average for the year or anything like that. (Though we could concoct something complicated. After concoocting it, I would then have to explain it.)
To some extent, even though betting this months value is probably a decent strategy for minimizing your rms error over the long range, it’s also probably a bad strategy for winning because often, there are several bets near that value and so you can get edged out in the pack and you win nothing even though you were within 0.005C and the 5th closests. In contrast, if you bet the temperature will swing up or down 0.1C, you may have a high rms in the long run, but you might actually win more money. Betting is different from actually predicting! And that’s one reason why it’s difficult to figure out what the bias “means”.
Still, the bias is in the direction many of us think we would have suspected. And many of us have similar reasons for having that expectation. So…. 🙂
Jit,
“Note to self: if the global temp was going up in a straight line, only a fool would bet on last month’s value and not last month’s value plus the monthly slope…”
That’s what the bankers thought.
I usually bet high, due to my preference for whole numbers.
Carbon-based life forms are often concerned about the oceans boiling away (were a bet of, say, 9999 to come true). As an adding-enabled robot, I don’t worry about that too much.
AMac,
That’s a good heuristic for finding lost Viper pilots on planets where sensors don’t work well too.
So far people are coming in on the heuristic side. That’s interesting! Is this going to turn out to be one of those problems where people can kick a computer’s butt on results because of … whatever the reason people kick computer’s butts on some problems is?
(Do I have a speech impediment, or is it more of a thinking impediment… mmm).
Lucia I thought it might be interesting to see what Mother Nature has been doing since the betting began (caveat – everybody hates short term trends, there was an El Nino in 2010!)
Anyway Hadcrut 4 seems to have an annual temperature trend since Aug 2009 of -0.03oC/yr. With a bit of wonky logical I’m going to suggest this indicates that Blackboard bettors are roughly a year ahead of the curve!
I’m curious if you took the output of global daily temperatures from the models that predict our weather for us 5 days in advance and calculated the monthly global temperature change would it be within 0.03oC of the UAH temperature?
HR,
My reactions
1) That would be a shitload of work.
2) Given what the AOGCMs are intended to do, there is no reason why they should match UAH’s monthly temperatures. They are not intended to predict weather.
So, all in all, I’m not curious about the answer to that question. It’s almost certainly “no”, but it’s being ‘no’ doesn’t tells us anything about reliability of models at doing what they are intended to do.
SteveF,
Could you link me your post on the lagged Nino 3.4 index? (cringe! I know, I’m lazy! I did go back through old posts through about 45 pages or August 2011 I think. I’m not sure I didn’t just miss it though and my goldfish like attention span is impeding me in my search).
Mark Bofill (#121062)
Tip – Here are SteveF’s posts.
I suspect he’s referring to this post.
Harold,
Much obliged, thank you.
(edit: also, SteveF, much obliged, thank you.)
I phone my dad every week and ask about the weather. If he says its cold, I guess low. However, hes 78, lives in England and always says its cold.
My paternal grandmother blamed the Apollo Program for the heatwaves of 76 and 77, claiming before 69 the weather in England had been quite stable.
Lucia, “… As I have access to the database, I pulled out all bets on UAH from the database.”
So who cares about a cool bias, who is winning?
John– you mean overall? Clearly, I need to write a script that keeps track of people’s balances. I want to patch an R script first though.