November UAH is out; it looks like a nice downtick for the end of the year. It fell to +0.193, down from Octobers +0.290 and September’s +0.365C. Who’d a thunk? Well, RickA, RiHo08i and KreKristiansen all thunk about that much, and take win place and show! Here’s how the rest of you did:
| Rank | Name | Prediction (C) | Bet | Won | |
| Gross | Net | ||||
| — | Observed | +0.193 (C) | |||
| 1 | RickA | 0.192 | 5 | 87.091 | 82.091 |
| 2 | RiHo08i | 0.2 | 3.5 | 48.771 | 45.271 |
| 3 | KreKristiansen | 0.18 | 4 | 44.59 | 40.59 |
| 4 | ScottBasinger | 0.21 | 5 | 44.59 | 39.59 |
| 5 | Rick | 0.21 | 4 | 15.208 | 11.208 |
| 6 | JohnF.Pittman | 0.212 | 5 | 0 | -5 |
| 7 | BillW | 0.214 | 4 | 0 | -4 |
| 8 | Skeptikal | 0.214 | 4 | 0 | -4 |
| 9 | JonP | 0.17 | 5 | 0 | -5 |
| 10 | angech | 0.17 | 2 | 0 | -2 |
| 11 | BobKoss | 0.167 | 5 | 0 | -5 |
| 12 | SteveT | 0.22 | 3.75 | 0 | -3.75 |
| 13 | LarryGoldberg | 0.22 | 5 | 0 | -5 |
| 14 | YFNWG | 0.22 | 5 | 0 | -5 |
| 15 | eddieo | 0.227 | 5 | 0 | -5 |
| 16 | mwgrant | 0.236 | 5 | 0 | -5 |
| 17 | denny | 0.236 | 5 | 0 | -5 |
| 18 | Levi | 0.238 | 5 | 0 | -5 |
| 19 | DavidJay | 0.239 | 5 | 0 | -5 |
| 20 | GeorgeTobin | 0.24 | 5 | 0 | -5 |
| 21 | itronix | 0.245 | 5 | 0 | -5 |
| 22 | Freezedried | 0.249 | 5 | 0 | -5 |
| 23 | MpG | 0.25 | 5 | 0 | -5 |
| 24 | lance | 0.251 | 5 | 0 | -5 |
| 25 | JCH | 0.253 | 4 | 0 | -4 |
| 26 | edward | 0.128 | 1 | 0 | -1 |
| 27 | March | 0.123 | 5 | 0 | -5 |
| 28 | MDR | 0.264 | 3 | 0 | -3 |
| 29 | SteveF | 0.264 | 5 | 0 | -5 |
| 30 | Dunna | 0.268 | 5 | 0 | -5 |
| 31 | TomBolger | 0.27 | 3 | 0 | -3 |
| 32 | RobertLeyland | 0.114 | 4 | 0 | -4 |
| 33 | Perfekt | 0.112 | 5 | 0 | -5 |
| 34 | MikeP | 0.111 | 5 | 0 | -5 |
| 35 | Cassanders | 0.111 | 5 | 0 | -5 |
| 36 | LukeWarmist | 0.277 | 3 | 0 | -3 |
| 37 | LesJohnson | 0.278 | 5 | 0 | -5 |
| 38 | Bill | 0.279 | 5 | 0 | -5 |
| 39 | mct | 0.282 | 5 | 0 | -5 |
| 40 | BobW | 0.284 | 3 | 0 | -3 |
| 41 | EarleWilliams | 0.289 | 5 | 0 | -5 |
| 42 | Pieter | 0.289 | 5 | 0 | -5 |
| 43 | AndrewKennett | 0.29 | 5 | 0 | -5 |
| 44 | LaurieChilds | 0.093 | 5 | 0 | -5 |
| 45 | Hal | 0.089 | 5 | 0 | -5 |
| 46 | lancewallace | 0.301 | 2 | 0 | -2 |
| 47 | JohnNorris | 0.082 | 5 | 0 | -5 |
| 48 | Genghis | 0.314 | 5 | 0 | -5 |
| 49 | TimTheToolMan | 0.32 | 5 | 0 | -5 |
| 50 | MarkBofill | 0.33 | 5 | 0 | -5 |
| 51 | Simon | 0.05 | 5 | 0 | -5 |
| 52 | Jefff | 0.34 | 4 | 0 | -4 |
| 53 | DenisC | 0.35 | 5 | 0 | -5 |
| 54 | AMac | 0.411 | 3 | 0 | -3 |
The net winnings for each member of the ensemble will be added to their accounts.
Open Thread
Feel free to discuss what you like.
What’s Lucia doing?
I know some of you are probably wondering why blogging is light. On the home front: Just before Thanksgiving. Jim asked for more pants. The pants I made last January are being worn regularly– and he loves them. He especially loves the wool ones because (a) they are lovely and (b) he can generally find jeans in size 28″ waist; it’s dress pants that are difficult.
However…. I am not entirely content with the old pants. There is something about making something oneself that causes one to be hypercritical of fit issues. Even when I made them, I noticed that the fit in the butt-o-lor region was not optimal. Specifically: they sag in the back near the crotch. That is not as cute looking as pants that don’t sag in the back near the crotch.
 Why do they sag, some of you ask? They sag because 120 lb-28″ waist-Jim has a “flatter than standard butt” even for his otherwise small frame. This is the opposite of the “bubble-booty” condition many are aware of. I say “standard” because what happens with sewing (and ready to wear) is the pattern maker designs their blocks to a specific build whatever that might be. With ready to wear, different brands sometimes do aim to fit slightly different builds. Since I mostly sew for Jim or myself, I’d like to improve the fit on all future pants I make for Jim.
Now, I’m not going to discuss how to modify (or draft) patterns for either “butt” type here, but modifying pre-existing flat patterns for the “butt” issue is a pain-in-the-butt. (The “seam” method for the changes are shown here. But it’s easier to understand the geometry issues using the “slash and rotate” method of altering the pattern. Be aware that this whole butt fit issue is a common complaint with slacks. Also each pattern company must have a different notion of “standard butt”, because the crotch curves are all different. See this post. ) Let’s just say that I want to solve the problem “once and for all” so that I can always have a fresh pattern draft and not adjusting every single men’s pants pattern I buy.
 Anyway, given all these “issues”, I decided that the best way to ‘solve’ the problem of pants for Jim involves (a) buying a book on pattern drafting (e.g. Amazon.com, (b) evaluating the instruction and then writing a script to create a pattern I can easily adjust later (c) applying a tape measure to Jim (d) making a fitting sloper based on the script created pattern using fitting defaults (i.e. standard butt for that author) (e) making a fabric mock-up out of old sheets, (f) forcing Jim to put on the ridiculous mock-up and figuring out the adjustments by pinching fabric and pinning and (g) after figuring out the adjustments, altering those features in the pattern that affect fit in the “butt/thigh/hip” region. Once that’s done, I can re-run the script (which was made flexible in (b) with the new ‘dart /butt-ease /crotch-rise’ parameters when I want to create a new pattern that fits in the butt. I can also re-run for other people etc.)
Now, some of you are wondering how this could possibly the be best solution to fitting the butt. It’s certainly not the only solution, nor is it the fastest solution. I know that because the whole “calculate using a script” method I the same one I use for sweaters. It’s time intensive at the front end both for knitwear and sewing. Nevertheless, I do plan to do the same with these as with pants– and possibly shirts because Jim also likes shirts.
Why do this you might ask? Well, the best answer is likely “Lord knows?!”
On the one hand, it’s very time consuming. Fabric to sew the pants arrived last week. If I hadn’t gotten obsessed with the notion of making them fit the way I like, they’d be finished by now. On the other hand, I’ve always gotten a small trickle of donations for the ‘sockulators’, various sweaters and socks. I also make some money on ads for pages that let people run those. (Ads work there because the topic is associated with things consumers might buy: i.e. yarn, needles etc.). So, potentially, I can get a small trickle of income from these things if over time I make some pants, discuss the patterns and/etc.
But, mostly, I just want patterns for me, and I want to be able to extend these. I also don’t want to store a bunch of cut, taped, retaped, retraced and so on bits of paper over and over and over. Having all these as pdfs is useful, and (oddly) writing the script is more convenient for me that buying commercial pattern drafting software for the home sewer.
I’ll be engaged in sewing next week. If someone wants to guest post, now is a good time!
Open Thread
Just a reminder: open thread.
I see inflation in a couple of spots today. After the commentary that seems to favor a low bias, nearly everyone went high this month. Only 15 out of 54 were low.
The other inflation of course, is in that disturbing picture.
The record of accuracy of my forecasts continues unabated.
Les Johnson,
It’s likely that singer starts out with a round booty. That said, I understand these garments are sometimes used as well
(Hope that shows.)
In principle, Jim’s fitting problem could be solved with a similar item without side pads. Underwear of that sort might even be utilitarian if he spent lots of time sitting on cold aluminum bleachers at outdoor sport events. In practice, he is not going to buy or wear any such garment. (And why should he?)
I’d rather just adjust the pants.
Lucia, I blame you for me not getting the prize this month, as I had adjusted my original estimate of 0.19C upwards by 0.03C as per your calculation regarding the general low bias, and thus overshot by almost exactly 0.03C!
I’d have otherwise been in 2nd place. Sulk ;(
I now recall the January number and your comment: “With that kind of start out of the gates, maybe temperature will break a record this year.” 😉
Anyway, getting back on-topic, I recall learning in the 1980’s that such garments were fashionable in Japan at that time to make the clothed article look “more Western”.
AMac d’oh!
Are the over/unders going to oscillate for a little while based on Steve Ta’s question and Lucia’s answer? Is the oscillation recognizable against the noise?
We might drop to 0.23 for the yearly average (still 4th warmest in UAH).
Wow, I didn’t expect to win Quatloos this month! I’ll try not to spend them all in one place, but if the past is any indication of the future I expect that I’ll whittle it away as the sheer statistical predictive power of the modellers catches up with my guesstimating.
I am a 28-30″ W and 28″ ISL.
Nothing I buy fits me.
I was in a very nice and expensive clothing store and the manager came over to me and said “Could I help you sir”. I replied that the smallest waist size on sale was 34″ and I would never return.
I have more chance of getting nice trousers from Goodwill as a clothing store.
I don’t have a big butt either. Jeans, 505’s, I can get from the outlet Mall and can wear the tan ones to work.
Can you run me some up?
Ahh.. So if the pant fits—Wear it….(:))
DocMartyn,
Heh…
Interesting you should say that you don’t have a big butt. I suspect many adult men who wear 28″ have “flatter than standard” butts. Bear in mind that “standard” doesn’t necessarily mean “average” or even “conditional average given known hip dimension” or anything of the sort. It’s just the shape the designer designs too.
Reading the pattern drafting book and also the section on “pattern grading” explains “why”. In places the author describes what designers working for production manufacturers could, in principle do, and also what they do do. The later is adequate, but it seems to involve making some assumptions about certain little rules of thumb in the patterns do not involve scaling with any body dimension. So, for example: the dart at the top of the back of the pants? It’s the same width for all sizes (2.5cm). And there is a rotation involved in creating the slant of the back of the pants– it is not a constant angle– it is a constant linear shift for all sizes (2.5 cm). And there is a specified amount to extend the crotch– once again a constant. Using constant values gives someone an ok fit– and minimizes the complexity of the charting process. But overall, it tends to assume that if you see a small man from the side he looks equally as “thick” as a large man. Meanwhile, from the front or back, he obviously looks narrower– otherwise he’d wear a larger size!!
Of course, in reality, the degree of roundness or flatness does differ even for men of similar hip size and height. So given the wide variations, and the fact that wearing ease takes care of a certain degree of imperfection in fit, it’s mostly fine for them to do this. But these three features being constants for all sizes means that patterns are drafted as if small guys generally have roundish sorts of butts (and biggish thighs) and large guys have flattish sort of butts (and thin thighs) compared to medium sized guys. (The standards are generally set on medium sized guys. )
And a man will wear anything comfortable,no matter its age or style; a woman will wear anything new , even if its not comfortable…
And some of these attitudes might carry over to how men see science…
I have an American clothes question for you Lucia.
Why is there almost no correlation between the size stated on a label and the actual size of the clothes? I have some 28’s that fit me, some 30’s that fit me and even had a 32 that fitted. Some 30’s are a least 3 inches too big. The children clothes, where I sometimes shop, seem to be less prone to false advertising, but the adult ones are all over the place.
Oh 5 precious Quatloos down the drain!
Doc Martyn
This is a great mystery. Google “vanity sizing”.
Yes. Women’s sizes are a crap shoot. Men’s aren’t quite so bad.
Lucia,
I remember we had the ‘vanity sizing’ conversation once before. If sea level rise were as extreme as human weight gain over the past 30 years, lots of coastlines would be in trouble. Vanity sizing does exist in men’s clothes, but it is not so blatant I think.
I looked it up and can only conclude that clothing manufacturers must employ moonlighting climate scientists for pattern making.
SteveF–
Yep. And we don’t need any scientific authorities on this. Just family photo albums.
It exists a little.
The thing is men can be vain, but their vanity isn’t all about achieving a “small” size. Some guys want to be larger. They don’t want to be fat, but they want to be taller, and bigger. Sort of like imaginary Arnold Schwarzenagger in his youth. So the vanity factor isn’t all in one direction.
Beyond that, men’s sizes are pegged to body dimensions, which makes them a little more difficult to shift. At least size 28″ waist does mean something that can be pegged to a body dimension.
People understand that 28″ waist pants are supposed to fit guys whose waist is 28″. It’s one measurement, not 3.
In contrast, a “Misses size 8” is just whatever it is. Who is to say whether that is “supposed” to correspond to a 24″ natural waist or a 34″ natural waist? Or even a 44″ natural waist (which would be beyond obese.) You have to look at a standard sizing chart to even remember what it’s “claimed” to mean. Eventually, the charts are just worthless.
Human weight gain? And where do you get your statistics on average human weight, pray tell?
Granted I imagine fewer people proportionally are dangerously underweight from starvation than any prior time in human history. So it’s not an outrageous hypothesis. Still, where is the data?
Andrew_FL, the context was Americans, not everyone around the world. My own anecdotal experience leads me to believe that there has been an increase in weight over time, or at least in obesity.
But you asked for data, not personal observations — fair enough. The data may be found in a CDC report on the changes from 1960 to 2002: “Mean weight and BMI have increased for both sexes, all race/ethnic groups, and all ages. Among adults, mean weight increased more than 24 pounds.”
HaroldW, SteveF said “Human weight gain.” You can see where that might be confusing, right?
Anyway, as far as the US goes, yeah, there’s data, although the BMI data is going to be at least a little misleading, as far as a *literal* interpretation of gaining weight, poundage will do just fine. Though it doesn’t answer the question, how much of that weight is fat? Anyway, I haven’t looked yet, do they analyze the distribution or just the mean? That’d be important, too.
Andrew_Fl,
I travel quite a lot internationally, and have for the last 23 years. Unless my eyes are going out of calibration, there is a stong tendency for weight gain in many countries. For example, from Forbes in 2011:
.
“Brazil’s obesity rate is growing. And this is a country known for thong bikinis (personally, they are not all that popular) and supermodels. But according to Brazil’s Health Ministry last year, if Brazilians keep eating fast food and drinking 24 oz sodas, they will be as heavy as Americans by 2022.
Around 14% of Brazilians are classified as obese, up from 11% four years ago, according to the Health Ministry. In the US, the number is around 34%.”
.
Could be coincidence, but I had noted this trend a decade earlier from visiting beached
SteveF,

My mom reports El Salvadorans have grown both taller and stouter. Did she do a systematic study? No. But she said whoever she saw who she new had kids much taller than they were. For example
Mom said the relative height of generation II vs III is as shown.
Mario Siman is in the middle. He is my age as would from my Mom’s point of view be “generation I” as that is ‘her’ generation and so that of people she knew. Felix III is to his left. (I’m guessing Felix III is Mario’s nephew, since Felix I was my sister’s godfather, and Felix II (aka “Felixito”) was Mario’s brother.)
I admit that this picture might show an exaggeration of any increase in height because when I last saw Mario, I was 13 years old, 5’3″ and he was roughly the same (on both counts). Felixito was older and taller than Mario; I don’t know which one ended up taller as an adult. So it may be the case that Felixito was taller, and married someone tall. If so Felix III would be taller regardless and not an example of some general increase in height in the country. But… Mom said this was typical in the whole country. Not just the Siman family, but even the high-proportion Maya ancestry people who tend to fall in the ‘less affluent’ portion of the population. When we lived in El Salvador, Mom, at 5’6″ “towered” over people. She says that is no longer the case.
Hey, like I said, it’s entirely plausible. Much more food is produced now, even in per capita terms I think. That would tend to lead to weight gain.
Much like temperature, I suspect big data gaps over Africa and the Arctic. Perhaps we could krig to estimate those 😉
Andrew_FL,
It is not just anecdotal. Key “global obesity epidemic” into Google and you get about 1.5 million hits. Lots and lots of data. Sure, very poor regions (like some parts of Africa) probably don’t have enough food for many to become grossly overweight, but globally, the trend is pretty clear. My eyes do not deceive me… many thong bikini’s and Speedos in Brazil would now be better left in the dresser drawer. That was the rare exception 20 years ago.
Fries go better with coke ’cause fat and salt washes down great with sugar.
SteveF (Comment #121797)-Well now, average weight increasing and obesity increasing are a *little* bit different, which is part of why what I want to know is what the weight *distribution* is doing. And I suppose while one is at it, what the height distribution is doing. The global mean *could* be stable and the high tail increasing, but what I *suspect* is happening, is just that the whole distribution is shifting to higher weights. Probably something similar with heights.
Fun fact, apparently the heaviest (that is, highest average weight) people are the Micronesians. I would not have guessed this. I wonder how tall they tend to be…
Andrew_FL,
If you want distributions, you may need to contact the authors and see whether they have them. I wouldn’t be surprised if they did have them. But the paper reports mean heights, mean weights and discusses BMI.
The paper mentioned mean heights. They increased a little. But not enough to justify the weight increase. That’s the point of looking at BMI. Even if BMI is imperfect for individuals since it can’t distinguish whether a persons BMI is high because they are a body builder (e.g. Schwarzenneger) or because they are fat, but it’s likely a pretty good number for tracking public health. BMI overall has increased, that suggests that people may well be getting fatter– which the method of the eyeball used at the beach or the mall also suggests. ( Heck, looking at old photos suggests this two.)
Now I know someone might suggest the arguments for why BMI doesn’t distinguish “fat” from “muscular” in individuals might mean that increasing BMI might not suggest the population is getting fatter. After all, maybe BMI is increasing because the entire planet has taken up body building along with steroid consumption, and the increase in BMI is due to people becoming more muscular. Doesn’t look that way to me based on my application of “method of the eyeball” at malls, beaches, grocery stores, old family photo albums and so on. But if someone thinks the reason BMI increased is not fat gain but rather everyone getting more muscular and increasing muscle mass and so body density, the data in the paper won’t disprove that notion. After all, no one put people thousands of people in a dunk-tank to learn their body fat percentages.
Maybe. But based on the BMI scaling, it looks like the weight gain is larger than one might expected based on the height gain because (supposedly) healthy weight tends to scale as the square of height. (Mind you, I’m not convinced there is any really good reason to believe healthy weight really does scale with the square of height, especially not in the sense of
healthy_weight_range = height^(2.0000000000000…0000).
Where the power is exactly 2.
If people kept constant aspect ratios (e.g. ratio of waist/height= cons., ratio of hip/height= constant) , weight would scale with the cube of height that is
healthy_weight_range= height^3.
Of course, there is no particular reason to think it’s “healthy” for people aspect ratio to remain constant as they get taller. Biology doesn’t have to work that way.
I don’t know the scientific basis for saying “BMI” which is the ratio or weight / height^2 “should” be the right sort of number to look at nor why the power is supposedly exactly 2 rather than say 1.8 or 2.2 or something. But BMI seems to be used.
That said: maybe you could get the data and look at the distribution of weight, height and BMI. It might be better if someone measured fat, but possibly that data doesn’t exist. In the meantime, I’m going with “method of the eyeball” and it seems to me Americans generally have gotten fatter since I was in college. (Same with since gradeschool, but I recognize that when one is young they tend not to really notice adults sizes.)
Lucia,
I think a simple test for true obesity would be a waist measurement compared to height (which may be different for men than women of course). Lean body builders don’t have big waists… no matter how much they weigh. IIRC, waist measurement is a very good estimator for life expectancy as well.. over 42″ for men and your life expectancy is much reduced.
.
But that being said, the eyeball method is good enough for me; there really has been a big increase in obesity in the States during my adult lifetime, and obvious increases in several other countries I have visited regularly over the past 20 years.
SteveF,
Waist measurements is something some guidelines suggest people check when interpreting their individual BMI. Though, I would say women’s fat-packing on profile is different than men’s and sometimes they lard up their butt, thighs, breasts etc more than they lard up their waist. It depends on the woman.
Still, it might have been nice if the paper cited above had reported waist measurements as well. Demograpically, average waist increasing at a rate unexplained by height does suggest the population is getting fatter, not more muscular.
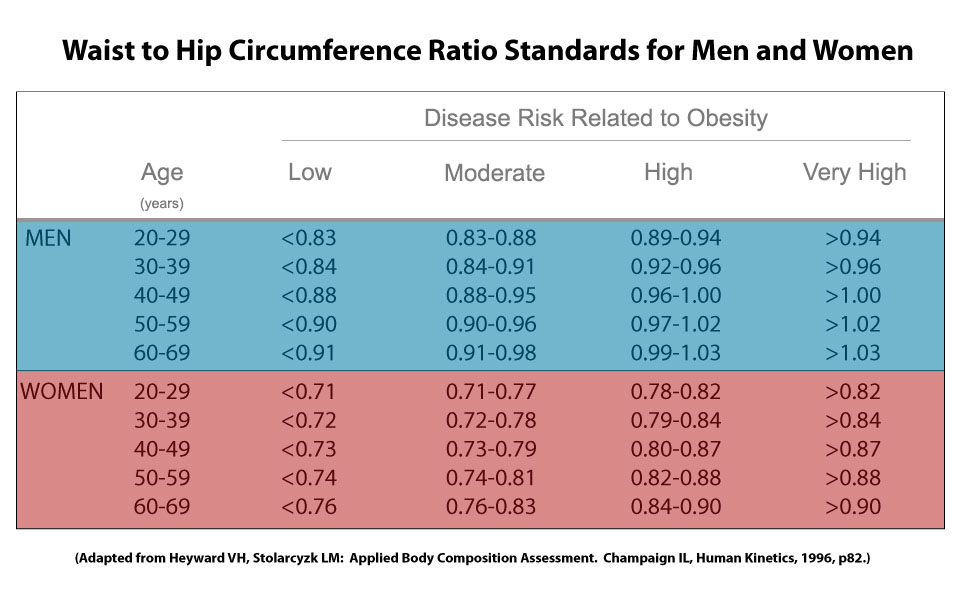
BTW: Waist measurement is a healt diagnostic for women too. Often the guidelines suggest checking waist to hip ratio:
http://www.healthcalculators.org/calculators/waist_hip.asp
http://nutritionfirstfitness.com/includes/images/Waist_to_hip_ratio.jpg
Then I am going to die young, as I have no hips to speak of, I am like tube.
the ‘obesity epidemic’ is over-blown.
HR,
It may well be overblown. It may not be as unhealthy to be overweight as they say (though I’m sure it’s unhealthy to be morbidly obese.)
But I still think American’s are fatter than they used to be and the difference is sufficient that people my age can tell based on “method of the eyeball”. It may well be that people in their 20s can’t discern this because they didn’t see how their elders looked in their younger days. But my generation at our current ages are fatter than my parents generation was and the younger generation is fatter than we were at their age.
Now, this BMI 25.80 woman is going to go eat more than she should. (Yes. I am officially overweight. Sigh.)
My point wasn’t that one accounted entirely for the other. My point was that the mean doesn’t tell you if there is, for example, a larger or smaller shift in the low or high tails.
Some people getting fatter might simply be a consequence of better fed people in general.
Andrew_FL,
We all know that reporting only the mean doesn’t tells us details about the shape of the distribution.
Maybe. Or not. It’s a bit difficult to believe the changes in the US since the 70s are due to alleviating low-calorie under nourishment. Maybe in other countries, but really, Americans were not starving in the 70s.
http://win.niddk.nih.gov/statistics/index.htm
About half way down the page it says this…
“Since the early 1960s, the prevalence of obesity among adults more than doubled, increasing from 13.4 to 35.7 percent in U.S. adults age 20 and older.”
Trends in Overweight and Obesity among Adults, United States, 1962–2010**
■ Overweight ■ Obesity ■ Extreme obesity
A text description of this image is available on a separate page.
Source: Ogden & Carroll, 2010; Flegal et al., 2012
The other page says
**Data for 1960–1980 are for adults ages 20 to 74; data for 1988–2010 are for adults age 20 and older.
Lucia,
Now weight… err…. wait a minute! The run-up in obesity parallels the run-up in average global temperature for the late 1970’s through the late 1990’s almost perfectly…. who knew there was such strong influence of average temperatures on US obesity? Yet another reason to control fossil fuel emissions. 😉
SteveF, You have it backwards. More obesity has led to global warming. 😉
Wayne I think you have hit on something. In order to restore the CO2 balance humans have to become a larger carbon sink. Obesity is an unaccounted for negative feedback 🙂
Shame we don’t have annual values, we could include that in a fit to temperatures. And now we’re back on topic, which was fitting.
I think it would be useful to consider the rising obesity in terms of an energy balance.. heat in the ocean is like extra fat, CO2 emission is like eating too much and sitting on the couch instead of exercising.
.
Lemme see, 6 billion people with an extra 10 Kg is about 2 X 10^18 joules (if I have done my sums right) of sequestered energy. Nope, four+ orders of magnitude too low to be Kevin Trenberth’s missing heat; too bad.
SteveF, think of the energy potential of liposuction to fuels.
dallas (Comment #121826),
A bit like Soylent Green? Or maybe more like whaling before the days of petroleum? Nah, too much ‘yuck’ factor.
Re: SteveF (Dec 7 11:12),
I actually worked for a local, now defunct, biodiesel plant. Converting animal fat to biodiesel is a lot harder than using virgin soybean oil. Getting the residual mono-, di- and triglycerides down to spec with virgin soybean oil is hard enough. And that’s just one of the problems.
With regard to a different thing happening in the US than the world, a rising food supply relative to demand will make food cheaper *everywhere*.
Good to see from Lucia’s graph that the number of overweight people isn’t going up, though.
Steve Ta, it’s just a “pause”