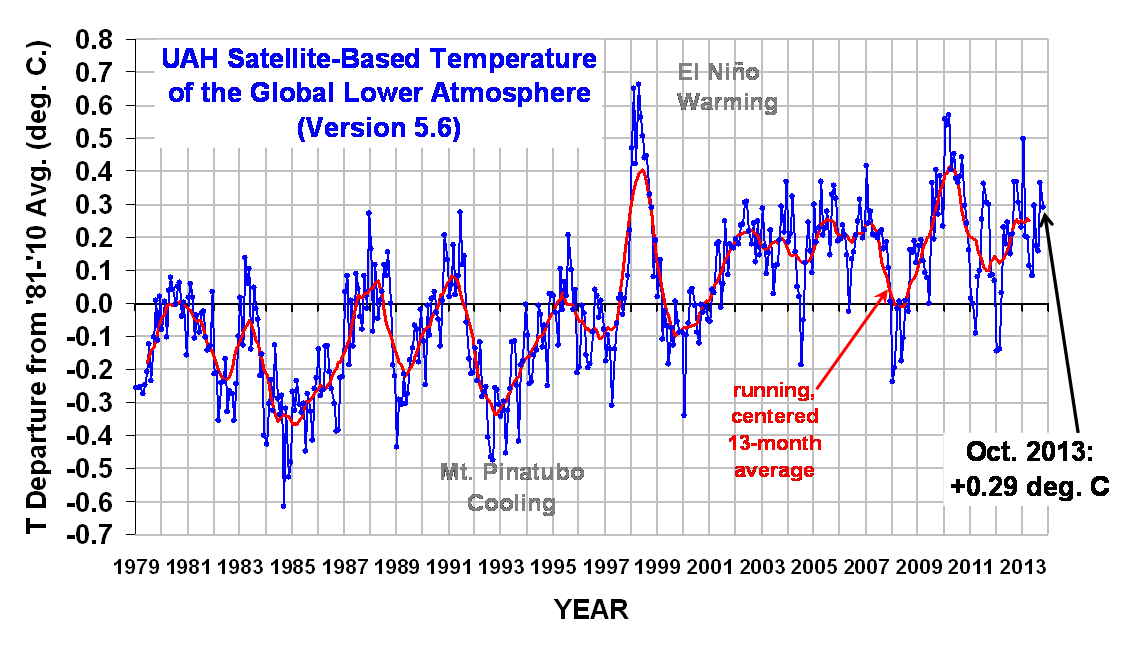
The October UAH temperature anomalies have been posted: Octobers temperature was 0.290C, this is down from Septembers value of +0.365C. Evidently, the delay was due to the government shutdown. Congratulations to lance, Jefff AMac for their win, place and show positions, taking all the quatloos. To others: feel free to grouse that the shutdown interfered with data quality or something and hope for better luck next time. 🙂
| Rank | Name | Prediction (C) | Bet | Won | |
| Gross | Net | ||||
| — | Observed | +0.290 (C) | |||
| 1 | lance | 0.298 | 5 | 86.198 | 81.198 |
| 2 | Jefff | 0.28 | 3 | 41.375 | 38.375 |
| 3 | AMac | 0.301 | 3 | 0.128 | -2.872 |
| 4 | JohnNorris | 0.302 | 5 | 0 | -5 |
| 5 | Bill | 0.303 | 5 | 0 | -5 |
| 6 | BobW | 0.273 | 3 | 0 | -3 |
| 7 | ivp0 | 0.263 | 5 | 0 | -5 |
| 8 | Simon | 0.256 | 5 | 0 | -5 |
| 9 | SteveT | 0.25 | 4 | 0 | -4 |
| 10 | mwgrant | 0.24 | 5 | 0 | -5 |
| 11 | Genghis | 0.239 | 5 | 0 | -5 |
| 12 | ArfurBryant | 0.342 | 5 | 0 | -5 |
| 13 | Pieter | 0.231 | 5 | 0 | -5 |
| 14 | Clyde | 0.23 | 2 | 0 | -2 |
| 15 | YFNWG | 0.356 | 5 | 0 | -5 |
| 16 | denny | 0.218 | 3 | 0 | -3 |
| 17 | Freezedried | 0.213 | 4 | 0 | -4 |
| 18 | billc | 0.21 | 5 | 0 | -5 |
| 19 | Ray | 0.39 | 5 | 0 | -5 |
| 20 | KreKristiansen | 0.169 | 4 | 0 | -4 |
| 21 | BobKoss | 0.167 | 5 | 0 | -5 |
| 22 | MikeP | 0.162 | 5 | 0 | -5 |
| 23 | Skeptikal | 0.143 | 4 | 0 | -4 |
| 24 | DocMartyn | 0.138 | 5 | 0 | -5 |
| 25 | RickA | 0.137 | 5 | 0 | -5 |
| 26 | march | 0.123 | 5 | 0 | -5 |
| 27 | mct | 0.123 | 5 | 0 | -5 |
| 28 | RICHARDHONICKY | 0.119 | 3.7 | 0 | -3.7 |
| 29 | RobertLeyland | 0.114 | 4 | 0 | -4 |
The net winnings for each member of the ensemble will be added to their accounts.
I got my grouse in already (state bird here in PA).
The average anomaly this year seems to be 0.24. If that keeps up for the next 2 months, 2013 will have been the 4th-warmest year in UAH behind 1998, 2010 and 2005.
I haven’t seen John N-G check back in on his forecast but in January he predicted 0.28 which would be the 3rd warmest. At this point I’d bet quite a few quatloos against that. But Christmas is the time for surprises!
As usual, the vast majority of bets (75%) are on the cool side. What does this say about the denizens of the Blackboard?
Steve Ta:
Or to put it another way, all the denizens who bet got the sign of the change right! Oh, except Ray who went for 0.39 – missed him on a skim down the table.
I’ve never run statistics on this. Have you?
I don’t know.
ArfurBryant bet 0.342C which was too high. What does that say about him?
If we use their projection for the month, the vast majority of models AR4 and AR5 runs have overpredicted monthly values for temperature. What does that say about models runs?
Lucia-
What would that say about the denizens? It seems to me that one also might ask what it says about the methods used (wag, swag, … , physical model, statistical model) I used to do a bit of contaminant monitoring and utility usage modeling, so I treat it as a monitoring problem with a touch of persistence forecasting. It’s something to calculate. [That gets reasonable predictions 80+ % of the time but there have been some curves! :O) ] The methods I’ve employed do seem to run consistently low. They have also recently planted the seed in my mind that things may be changing(?)
Just eyeballing it from the numbers typically posted there are a fair number statistical approaches employed by the denizen, but clearly some other methods too. But that is a guess on my part and we know those are hazardous.
BTW my Mac is doing better with the site these days.
Regards mwgrant
The last few September-Octobers have been warm. What does that say about ice feedback :)?
Woo hoo — I bet warm, and won big!
I haven’t decided whether to spend my gross earnings of 0.128 quatloos first, or to splurge with my net winnings (-2.872). Bitcoins all the way down!
So how does the quatloo balance scheme work? Negative balances max out at -5 I guess?
(edit: I guess it’d be ‘min out’, strictly speaking)
Mark Bofill,
If the house ever got around to it, the house would write a script tallying up all your wins and losses and present that information to you. 🙂
I guess I could also check whether the ‘As usual” in Steve_Ta’s claim of
“As usual, the vast majority of bets (75%) are on the cool side. What does this say about the denizens of the Blackboard?” is correct. And I could also check whether the average bet for the upcoming month was for a temperature rise or drop. (If I were to check one, I’d check the other. After all: it wouldn’t be too surprising if there were ‘runs’ in over or under betting. Last month has a spike, so I’m not surprised most people bet the temperature would fall. And so on.)
Ohhhh. It’s fresh each time? I guess in this case the 127.7 total bet gets distributed between the three closest bets.
What’s the weighting for the payouts?
(edit: Sorry, I guess my questions are sort of lazy. Looking at earlier betting results might give me enough info to figure this out, for example Alas, due to late betting and the two top winners each wagering 5 quatloos (the max) the pot was depleted before the third place winner could take anything home! so clearly quatloos bet figures in as one would think it should. Apparently the third guy gets whatever’s left, or in some cases gets whatever’s left…)
Lucia,
Yeah. I don’t know what that says about the denizens either. How do they decide what to bet? Do most people here run algorithms, make an educated guess, some mixture of the two?
Mark
The amount in the pot for each bet is based entirely on bets for that particulare case. So: for this months UAH, we divide up the amount people bet on this month’s UAH. Does that answer what you asked?
The algorithm is complex….. But actually, how “deep” the payout goes is affected strongly by whether the winners bet 5 quatloos or 1 and whether those who did not bet bet 5 quatloos or 1.
Mark,
On the this months bets being “cold” relative to the outcome, note that the lagging average is also “cold” relative to this month:
What does that mean? Beats me.
To figure out if this crowd bets “cold” relative to the outcomes, I would need to fish out all the bets. I’d be interested in knowing the basis for Steve_Ta’s generalization. Maybe he’s right. Or not. I just don’t know.
Yep, that answers my question.
I’m glad to hear the algorithm is complex, because looking over the old betting results I’ve been utterly unable to deduce it so far. Doesn’t really matter of course, just idle curiosity.
Thanks!
Mark–
I concocted the payout method. First all the quatloos bet are thrown in the pot. That’s “amount in pot”
The amount the #1 person gets is a (x_1)*Quatloos_1_bet*amount in pot.
x_1 is highest form the #1 person. But they get more if they bet 5 quatloos and less if they bet 1 qualtoo. What they win gets subtracted from the amount in the pot.
Then the #2 person gets something like
(x_2)*Quatloos_2_bet* amount in the pot.
x_2 is less than x1, and also the amount in the pot is less. But person 2 may have bet more than person 1.
This continues until the pot is empty. Of course, if at any time, the formula would result in more money than is in the pot, the person just gets what’s left in the pot.
I figured out the x_1, x_2 and so on by fiddling I wanted it to be that win place and show will always win something, but others may or may not. I’m not even sure I achieved that should the top three bet 5 quatloos and all others bet only 1.
Lucia,
Thanks. I suspected something iterative like that from the fact that a bigger pot could mean more winners.
I started wondering about this because I figured to write an algorithm to make sensible bets I needed to figure out the risk / reward relationship in quatloos, I.E., how much certainty or uncertainty mapping to how much more or less to bet to maximize probable winnings. I think this only matters over the long term game though.
Then I realized that the point was possibly made moot in that the algorithm isn’t just playing against ‘reality’, but against other people’s predictions as well. I haven’t quite convinced myself that this matters yet, still kicking it around…
I should probably go review some basic tutorial on game theory. 🙂 I knew a little bit about this once, but it’s been awhile.
I guess the question boils down to, how do the other players behavior affect the expected value of the ‘quatloo’s I expect to win on average’ variable.
Maybe not game theory, maybe basic probability now that I think about it.
Edit- Yeah. I see now. I guess the way to go is to look at the historical data and figure out the expected performance of the competition, and use that to figure out how likely it is someone’s going to be closer. For example, if my algorithm says I’ll be within +/- .05C with confidence X and the record says some number of other people will be within +/- .03C with confidence X, adjust accordingly. This is all just classic probability I think.
Mark Bofill –
A while ago, I did some reverse-engineering of the quatloo distribution method and described it here.
Using the nomenclature of Lucia’s explanation above in #120999,
x_1 = 3.915 divided by the number of bets, and x_(n+1) = 0.8 * x_(n) for n>=1.
In this case, the number of bets was 29, so the winner, who bet Q$5, took (3.915/29)*5 = 67.5% of the pot (Q$127.7). Second place (Q$3 bet) took 0.8*(3.915/29)*3 = 32.4% of the pot. Leaving pretty much nothing for show. Sorry AMac.
HaroldW-
Nice! Did you just sort of trial and error it to figure it out, or is there some nifty method of analysis for pulling something apart like that?
(‘Cause if so, I want it! 🙂 )
Course, before all of this scheming about figuring out probabilities of other people beating my horse’s performance in the race and how that affects betting, I should probably spend some time thinking about getting a horse, or how to make a decent temperature forecast in the first place.
:>
I’m just silly that way, what can I say.
Mark –
Well, it’s been a while, so it’s a little hazy. But there were hints from Lucia about proportionality to the winner’s bet size, so it wasn’t a “black box” to start with. As I recall, I used a month with a lot of betting — hence more payouts — and noticed the exponential relationship of the payout-to-bet ratio vs. results position. I think to deduce how x_1 was calculated from the betting, it was trial and error using a few months’ results. Then tested “out-of-sample” to confirm.
Lucia,
[“ArfurBryant bet 0.342C which was too high. What does that say about him?”]
That I have a sense of humour. Unlike some… 🙂
Aww. I was hoping you were about to give me the keys to the kingdom of reverse engineering. 🙂
Thanks Harold. It’s more impressive anyway when you just puzzle it out in my book.
I’ve got a project! I’ve just realized that for all the time I’ve spent reading about, commenting on, thinking about, etc. climate that I don’t have the first durned clue how I’d predict a value for the anomaly. Curve fitting? Physics based model (heh)? Dartboard? Probably I should go looking for things that correlate a month out……. mmm. like anomaly value right now, + or – something…. mmm..
looks like this year might be the warmest ENSO neutral year on record . . . . . but still lagging the models!
Re Steve Ta’s comment:
“As usual, the vast majority of bets (75%) are on the cool side. What does this say about the denizens of the Blackboard?”
All I can say is that there appears to be an acute shortage of IPCC type climate modelers among the betting public here. Perhaps they all went broke in the early betting?
Fourth place? I think Ray couldn’t let me win 2 months in a row and fudged the numbers.
Bring on November!
Of course being a skeptic I’m far more likely to believe in lunatic conspiracy theories, at least according to Lew’.
ok…all in!!!
I’ve grabbed screen shots from 10 recent UAH betting results tables, and calculated whether we really do aim too low. The tables were selected simply in the order that a search for UAH provided them, and I’ve not recorded the dates for each table ;(
Anyway, my initial statement that “the vast majority of bets (75%) are on the cool side” isn’t really validated, but here does seem to be a cool tendency.
Stupid guesses were excluded (more than 2C from the result).
Too high: 29 Too low: 8 Proportion too low: 21%
Too high: 23 Too low: 24 Proportion too low: 51%
Too high: 26 Too low: 10 Proportion too low: 27%
Too high: 2 Too low: 35 Proportion too low: 94%
Too high: 23 Too low: 9 Proportion too low: 28%
Too high: 11 Too low: 4 Proportion too low: 26%
Too high: 8 Too low: 46 Proportion too low: 85%
Too high: 7 Too low: 22 Proportion too low: 75%
Too high: 24 Too low: 15 Proportion too low: 38%
Too high: 0 Too low: 42 Proportion too low: 100%
Summary
Too high: 153 Too low: 215 Proportion too low: 58%
That probably also excludes Dr. Jay Cadbury’s old entries. On sea ice I think he once entered an area larger than the surface area of the earth. Possibly Jupiter.
As– at least hypothetically– people might be biased by predicted ENSO (or existing ENSO considitions) and so on, I guess I should go back and just pull up all the bets. I can easily do it, while you would have to crawl.
I think what we need is at least four columns:
1) What a person bet in C.
2) What the actual outcome was in C.
3) The difference between the two.
4) What the previous months outcome was (in C.)
Hypothetically, one could also compute the lagging annual average and so on to see if people are jut betting lagged temps and so on.
Mind you, I wouldn’t be surprised if a cool bias existed. I’m just a bit curious. Maybe i’ll go do that…. (I should be fixing my script to show the AR5. It had a module that pulled data from a thirdparty page that’s gone dead. Should be easy to fix… but yesterday, I just thought argghh… why did I pull from a 3rd party page?)
I snagged all the data from the database. I get the mean bet is slightly below the observed values– so betting does cool, but using a t-test, the result is not statistically significant (and in fact, not even close). I’ll post data so other people can hunt for ‘effects’.
I didn’t look at the mean of bets, only at the proportion that were lower than observed values. After all, we could be getting incredibly close but still all be betting under!
Correction… forgot to divide by sqrt(N-1) when computing t. The cool bias IS stat. sig. WAY significant. I’ve posted.
http://rankexploits.com/musings/2013/is-there-a-cool-bias-in-uah-betting/
RE:
Steve Ta (Comment #120978)
November 12th, 2013 at 10:22 am
As usual, the vast majority of bets (75%) are on the cool side. What does this say about the denizens of the Blackboard?
***************************************************************************
Well, a sample size of 1 tells us more about the weather than the Blackboard denizens betting bias. Averaging all reasonable bets over the last 5 years it appears that the Blackboard denizens have a far higher predictive accuracy than the majority of climate scientists contributing to AR4. That still does not say very much about the depth of our long term climate science knowledge.
ivp0–
The comparison isn’t fair because we are betting on weather. I suspect if the IPCC guys were betting on the average November 2013 temperature using my script– which will be posted soon (which means with 1/2 november already in) they would do better than the long term projections do to.
Agreed. We are betting on monthly weather and AR4 is attempting to predict long term climate. It might still be interesting to apply your script to all Blackboard betting and see if the cool bias is consistent long term or just recently.
Edit- Ah I see you did that for all UAH betting. I suspect I am also slightly biased on the cool side.