You know spring has arrived when blog visitors start to drop images like these in comments:
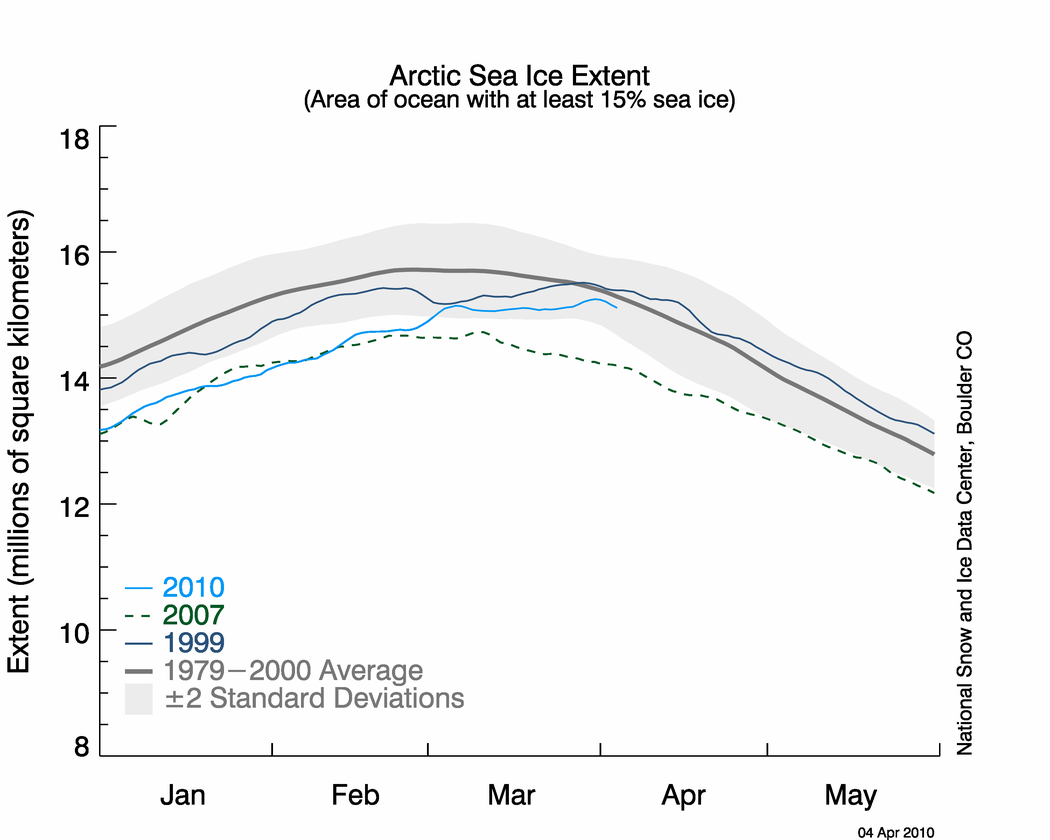
Other symptoms appear at climate blogs like Anthony’s; he blogged about the NH ice extent, mentioning that
This was the latest date for the maximum Arctic sea ice extent since the start of the satellite record in 1979.
This means it’s time to start thinking about betting on sea ice. This year, I’m going to let people place entries based on JAXA sea ice, which is posted here: JAXA. I picked JAXA because they update their web page quickly. 🙂
In preparation for betting, I slapped the JAXA data into an excel spread sheet, compute the monthly average ice extent for the months of April-September, plotted and fit trend lines. I also included the average for the first 6 days of April for available years. This is plotted below:

My graph is based on the same information used to create the JAXA daily graph:

I’m not going to discuss the appearance of either graph too much. I figure you all can notice that the least squares fits show negative trends for September, but happen to show slight positive trend for April (whatever that means.)
Feel free to use this thread to mention resources that will help people better understand the factors that affect the average ice extent we will detect in September. Don’t forget to mention the wind. I’ve read rumors the current large ice extent may be due to the ice being stretched out by the wind. 🙂
There should be monthly sea ice data back to the 60s from NSIDC if you want to longer-term month-specific trends. I’ll go dig it up.
Thanks Zeke. They seemed to have shuffled their stuff around. It’s really easy to create a large variety of images quickly, but I’m not sure where all their data is!
Here is March-September (top to bottom) from 1979-present. Data is at ftp://sidads.colorado.edu/DATASETS/NOAA/G02135/
http://i81.photobucket.com/albums/j237/hausfath/Picture220.png
Thanks for this thread, Lucia. This is one of the most interesting issues/signs of AGW.
Neven–
I’m hoping we get jeez to write more baby ice stories. . .
This plot at the DMI Centre for Ocean and Ice is said to be: “Daily mean temperatures for the Arctic area north of the 80th northern parallel, plotted with daily climate values calculated from the period 1958-2002.” It seems to indicate that temperatures in that region don’t reach above freezing until after about 150 days into the year.

The Sea Ice Extent plot at the top of this post seems to indicate that the max extent is generally attained before about day 90 ( more like 65 or so ) of the year.
At a zeroth-order glance, this seems to be counter-intuitive, as they say.
What are the controlling physical phenomena and processes that determine the max extent of the sea ice? Is the max extent limited by increased radiative energy deposition into the ice as the Sun Light reappears there? If the sea ice is limited by increases in the air temperature, how does this work if the air temperature is below freezing?
Thanks for all assistance.
I don’t know what dictates the timing of the sea ice extent max or its size. Obviously, longer colder winters will tend to result in more ice than shorter warmer ones. Other than that, I’d be guessing. Maybe the fact that the Arctic is almost surrounded by land represents an important limiting effect?
I do know you can have short term oscillations in ice extent if the wind causes it to pile up or spread out. This effect is somewhat orthogonal to actually freezing or thawing creating more or less ice volume.
Re: Dan Hughes (Apr 7 14:42),
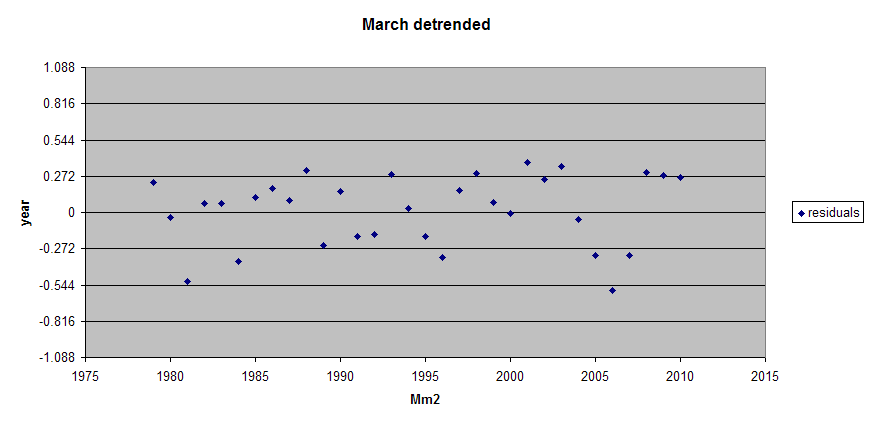
Maximum sea ice extent is way below 80N. See this for the current date. At the Arctic Circle, ~67 N, the sun is only below the horizon for 24 hours on one day as opposed to six months at the pole. While peak insolation is at the summer solstice in June and minimum is in December, there’s the usual lag in maximum effect of nearly three months, putting the maximum extent in March and the minimum extent in September. From the same data source as Zeke, here’s March in individual control chart format with the linear trend removed and the y axis grid in multiples of the 1979-2008 calculated standard deviation. The process still looks in control (no significant deviation from the trend) to me. I just realized that the calculated s.d. is a little too small as I forgot to reduce the degrees of freedom by the the slope and intercept of the trend line.
Re: DeWitt Payne (Apr 7 15:04),
I see I cleverly managed to mislabel my axes. Obviously, the x axis is the year and the y axis is the detrended anomaly in Mm2.
Unit roots abound.
If you say his name three times I can make Jeez materialize.
A tooned Bishop and a Lucia Not really to do with the arctic ice but vaguely Easter-ish
Jeez..I found the 2008 post. Very sweet (and somewhat inspiring)
Josh–
Now I need to think of haiku’s. They are both so cute!
Jeez used to work for Jacques Cousteau. He’s good.
Lucia [40150]
Wind patterns have been identified as an important factor. Several studies have shown that a shift in Arctic wind patterns was the single most important variable in explaining the very low 2007 numbers and that this is the case historically as well [Polyakov, et. al].
Another factor is the the ratio of new to multi year ice, as multi- year ice will be thincker and therefore have more of its volume exposed to the water vs. air, and that fluctuations in SSTs are relevant in that context. A joint German-Canadian aerial survey with a towed sensor array of the Arctic Basin conducted last year [report published by the Univ of Hamburg] found that multi year Arctic sea ice was some 200% thicker than projected.
The NSIDC chart is completely outdated and useless as it only provides a 1979-2000 average. Remarkable that they publish a chart that is short on an entire decade worth of data on 04/04/2010!
Given the the 2008 and 2009 minima were 10% respectively 25% higher than the 2007 extreme summer minimum, it would interesting to see if treating the 2007 minimum and the 1999 maximum as outliers [discarding them] changes the 1979-2009 averages. Might give us a more accurate understanding of what is going on in 2010.
yes,
jeez is very humble about his time working on that show. After he wrote his first part of it on CA somebody remarked that it sounded just like a coustea show. At that point he explained that he did write for the show.
Jeez jeez jeez
hmm lets see if I can make him appear…
jeez jeez jeez
Lucia, you have my permission to give my e-mail to Josh. I could use an illustrator.
I am behind on serious work, but I will promise to do something either with baby ice again or perhaps with our new current hero Teenage Mutant Ninja Ice in the next few weeks.
I am modest about my work with the Cousteau Society because it was a long time ago, for only six months, and on a project that never really saw a lot of air time. Mostly I learned to avoid th sounds in scripts as the French were unable to say things, such as three-toed-sloth.
For others who may want to see the original thread it is here.
Yes saying my name three times will sometimes work. Steve knocking on my bedroom door and telling me about it was at least as effective.
Hehe.
and you thought I had super powers.
where the hell is bender
Feel free to use this thread to mention resources that will help people better understand the factors that affect the average ice extent we will detect in September.
Reading several posts over the last few months, I think this is a valuable resource:
http://tinyurl.com/9zzbo
🙂
Unfortunately for the AGW this is reality
http://arctic-roos.org/observations/satellite-data/sea-ice/ice-area-and-extent-in-arctic
and DMI ice extent which if it does not change, may be ABOVE anomaly this year and which is real time as distinct to US sites.
I only trust Scandinavian sites when it comes to ice data because the NH ice plate data can be constantly “readjusted” to fit AGW agenda. Fortunately SH ice cannot be “re-adjusted” so much as it is one mass and that one seems to be roughly ABOVE anomaly for some time 3 years now?
re previous NSCDC adjustments…
http://www.americanthinker.com/2010/04/was_the_arctic_ice_cap_adjuste.html
This really nails it
http://arctic-roos.org/observations/satellite-data/sea-ice/total-icearea-from-1978-2007
Here is some light:
a book from 1943 (page 444 onwards): the seasonal and long-term fluctuations of ice-abundance
http://www.archive.org/stream/arcticice00zubo#page/444/mode/2up
Stephan,
Somehow I imagine that those graphs nail it in ways you may not have imagined.
Stephan,
You do realize that NSIDC and the Arctic ROOS folks provide effectively the same data, right? I mean, as fun as it is to throw around unjustified accusations of data manipulation…
Also, that American Thinker article botched it rather badly. Read the update at the end to see why their area and extent trends differed so much (hint: area has a large step change half way through the series).
jeez,
I read the thread. Just classic!
Have you considered a Mutual of Omaha type narration with Jim and Marlon?
“While on the surface baby ice appears as docile and friendly as its domestic cousin, it is at its heart a wild creature. You are well advised to keep your distance from baby ice; many have been fooled by its calm, cool exterior.
Jim approached the baby ice cautiously while I stayed in the jeep…”
The AGW movement’s obsession on Arctic ice is entertinaing but not really more useful than obsessing on massages of data that reflect 0.0xo degrees of temperature fluctuations.
Re: Stephan (Apr 7 20:11),
The Arctic-ROOS plots are garbage. They prove nothing except that you are suffering from confirmation bias. All other sources of Arctic ice area and extent disagree with the relative positions of 2007-2010 in the Arctic-ROOS plots. It seems like they never got the word that there was a problem with the satellite data they were using, which started to fail in 2007. So the 2007 line is about right. 2008-2010 are only qualitatively similar to NSIDC, Uni-Bremen, JAXA and Cryosphere Today.
DeWitt Payne,
Know offhand where one can actually download the data from Arctic-ROOS? NSIDC makes it easy to find, but all I can find from Arctic-ROOS are figures.
not on topic, but a momentus event has just occurred in the UK:
RealClimate are going to have fits over this, not for the content as such…
Just WHO is writing it…
“In 2005, Jones made it clear to one of his petitioners that he wasn’t going to do that:
– Even if WMO [the World Meteorological Organisation] agrees, I will still not pass on the data. We have 25 or so years invested in the work. Why should I make the data available to you, when your aim is to try and find something wrong with it.-
This cuts to the heart of the matter. Science must be falsifiable: otherwise it’s not science. Those who seek to find something wrong with your data are the first people who should have access to it, not the last. Challenging, refining and improving other people’s work is the means by which science proceeds.â€
Anybody guessed who it is yet?
Same journalist wrote today:
“Jones reveals:
I’m getting hassled by a couple of people to release the CRU station temperature data. Don’t any of you three tell anybody that the UK has a Freedom of Information Act!
Since I began writing about this issue, I’ve been assailed by climate scientists and environmentalists, all insisting that Jones did nothing wrong. If these emails meet their standards of professional rectitude I dread to think what else they would find acceptable.â€
Do you know who it is yet!!!!
I REALLY wonder what Real Climate will make of this..
same journalist, Part of the Guardian environment network:
“But there was a simple means of getting the hasslers off his back: release the sodding data.
In 2005, Jones made it clear to one of his petitioners that he wasn’t going to do that:
Even if WMO [the World Meteorological Organisation] agrees, I will still not pass on the data. We have 25 or so years invested in the work. Why should I make the data available to you, when your aim is to try and find something wrong with it.â€
It’s GEORGE MONBIOT: (Guardian)
The chief eco journalist in the UK, who made Dr David Bellamy a deniar, has seen the light, and is getting out of Dodge. He hassled Ian Plimer and was vitriolic in his treatment of him.
Generated this shameful article:
http://www.guardian.co.uk/environment/gallery/2009/mar/09/climate-change-deniers-monbiot-cards
Monbiot’s royal flush: Cut out and keep climate change denier cards
Dr David Bellamy, No 1.
Now George says:
“Whatever the motivation of the questioners might have been, the original FoI requests appear to have been genuine attempts to obtain information. As the replies sent to one enquirer, Willis Essenbach, show, they were fobbed off in a way guaranteed to make anyone seethe with rage. The letters sent to him by CRU epitomise bureaucratic obfuscation of the kind that anyone who believes in democracy should challenge.
The Canadian mining investor Steve McIntyre, who runs the website Climate Audit, was also fobbed off. In another email, Phil Jones reveals:
Think I’ve managed to persuade UEA [the University of East Anglia] to ignore all further FOIA requests if the people have anything to do with Climate Audit.
That doesn’t seem right either. Just because you don’t like someone doesn’t mean you can refuse to answer their FoI request.â€
I must dash over to RealClimate to see how they are taking it.
They will be having kittens..
George Monbiot is getting out of Dodge.
http://www.guardian.co.uk/environment/georgemonbiot/2010/apr/08/hacked-emails-freedom-of-information?showallcomments=true#comment-51
All at Bishop Hill:
http://bishophill.squarespace.com/blog/2010/4/8/george-signs-off.html
@Zeke
I would think they use the same data “as the rest”. Eventual differences would be caused by:
* Different algorithms (look up the primary literature given here: http://arctic-roos.org/observations/comparison-of-algorithms)
* Different choice of “normal period” (as several -probably also you, allready have pointed out).
Also allready noted by others: The European Space Agency ESA finally got their Cryosat-2 into orbit today.
http://www.esa.int/esaCP/SEMH5ZZNK7G_index_0.html
In addition to better resolution, it will also supply data on ice draught, thereby giving a better understanding of total ice volume in the Arctic.
Cassanders
In Cod we trust
Re: Zeke (Apr 8 12:31),
I don’t know, but then again, I haven’t really looked. I’ve just overlaid plots in Paint. DMI perhaps? Cryosphere Today only made their data archive on NH, SH and global area available after their recent conversion to 1979-2008 as their baseline period.
Re: Cassanders (Apr 8 15:05),
About that. While there is a lot of difference between the absolute numbers, I’ve been able to do linear transforms between the data sets for everyone else with very high correlation coefficients (or stretching overlay plots in Paint, which amounts to the same thing). That would mean that the relative order of the years at every point should be nearly the same. Arctic-ROOS is way out of line here. They didn’t use to be. So now I don’t pay them much attention except to point out the problem to anyone who cites them as a reference.