
I often neglect NOAA when discussing monthly temperatures. However, if you visit NOAA you will discover that NOAA also reported November’s anomaly up relative to October. The respective values are 0.6943F and 0.5460F. The jump is a bit surprising in context of ENSO having entered a La Nina– but ENSO isn’t the only factor affecting weather. Notice that this is not a record November for NOAA.
I’ll be comparing annual averages for NOAA, HadCRUT and GISS when Hadley reports. But for now: two data sets for the surface show Nov. warmer than Oct.
Pielke, Sr. has written about the need for improved temperature data sets, such as here:
http://pielkeclimatesci.wordpress.com/2010/11/23/repost-of-further-discussion-of-global-warming/
It is not surprising that HadCRUT takes its time. Their average for Januar to Oktober 2010 is 0.499, the average for 1998 (whole year) was 0.548. Thus they need 2 month with 0.8 to have the warmest year ever.
It does not help that the satellites show a rapidly cooling earth in December. Thus they probably look for more than 1.0 in November.
The latest month according to HadCRUT3:
0.475, 0.389, 0.392 (Aug, Sep, Oct)
It might not even help to simply add 0.03 to every month of 2010.
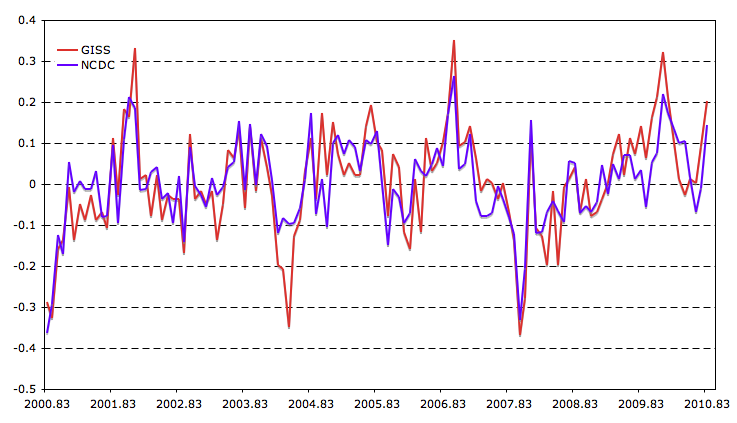
Well, looks like November GISTemp wasn’t particularly anomalous relative to NCDC at least. I suspect HadCRUt will move similarly once it comes out.
http://i81.photobucket.com/albums/j237/hausfath/Screenshot2010-12-15at31132PM.png
As a foreigner I do not understand why the US administration needs 2 agencies to do the same job twice. Would it not be better to have just one, but one that does the job properly? Or then the 2 should be completely independent.
Alexej Buergin wrote in Comment#63852, December 15th, 2010 at 4:23 pm
It is not surprising that HadCRUT takes its time. Their average for Januar to Oktober 2010 is 0.499, the average for 1998 (whole year) was 0.548. Thus they need 2 month with 0.8 to have the warmest year ever.
It does not help that the satellites show a rapidly cooling earth in December. Thus they probably look for more than 1.0 in November…
————————-
AMSU Channel 5 shows mid-tropospheric temperatures leveling off in Dec (so far), after declining in Nov. That’s consistent with the 2002-2009 average for Nov and Dec.
http://www.drroyspencer.com/2009/01/daily-monitoring-of-global-average-temperatures/
Max_OK (Comment#63860)
Agreed; and after an anomaly of 0.4°C in November that would be a change of -0.4°C in one month.
Alexej Buergin:
“and after an anomaly of 0.4°C in November that would be a change of -0.4°C in one month.”
I wouldn’t count on the UAH anomaly coming out as 0 for the month just because the AMSU ch.5 is hovering around the Average line. It is a different baseline..the November mean of daily anomalies relative to that Average line was only 0.14, but as you saw the UAH anomaly was much higher. The difference is usually around 0.18 C, so if it maintains this current pace, I would venture a guess more around 0.2 C for the December anomaly. Still would be a decent-sized drop from Nov.
Troy_CA, if I were guessing based on Ch.5, I would be inclined to agree with you, but go a little higher to a guess of 0.3 for the Dec anomaly. My reasoning is the anomaly was 0.29 in Dec 2007, and I can see from the Ch.5 chart that so far the temps are slightly higher in Dec 2010 than in Dec 2007.
Woops! My mistake. The Dec 2007 anomaly was 0.02, not 0.29. Troy_CA’s guess of 0.2 for Dec 2010 seems reasonable.
Can some one point me towards an explanation of how anomaly graphs were intended tobe used and anomalies…
As to me it appears to be used to describe something ‘abnormal’…
Yet if your baseline is in a cool period of a cycle – warm anomalies..
and if the basdeline straddles the crest of a warm cycle… going forward equals negative anomalies…
ie nothing abnormal, just a result of the method, showing a trend with less noise.
The public and the presentation of these graphs outside of climate science gives the impression(ie proof) of something abnormal, ie must be human induced temps. I imagine many at a glance don’t even notice the anomaly graph, and think it is actual temps being displayed.
Barry Woods–
Anomalies aren’t necessarily intended to show something “abnormal”. Oddly enough, nearly all temperature metrics are “anomalies”– that is relative to some baseline. Centigrade is relative to the triple point of water. I heard rumors that Farenheit was relative to the coldest temperature someone was able to create in his lab with 100F chosen by sticking the thermometer in the scientists mouth. (Someone was running a low grade fever….)
So, temperatures are already relative to something.
For global temperature, they state those temperature are anomalies up front. It’s necessary anyway because it is (oddly enough) easier to figure out the anomaly than to determine the actual mean. (This is not as unusual situation in science as you might think. It’s also easier to measure gauge pressures than absolute etc.)
Barry: anomalies alone do not tell you anything about absolute temperatures (unless you add them to the baseline), but they preserve all information about the changes, including rate and direction of said change. So reading anomalies will not tell you anything about warmth, but they will tell you everything about warming over a period.
.
Take all the closing values of the NYSE over the last 10 years. Subtract a common number from each value. Now you don’t know what was the exact value on any given day, however, you can still tell whether the NYSE went up or down over any given period, right?
.
Now, if you already know the NYSE closing values, there is no reason why you would want to do that. However, suppose that you don’t have direct access to the NYSE itself, but only to partial records of different indices that are pegged to the NYSE, but with a certain, unknown offset (i.e. X = NYSE + n, where n is an unknown number).
.
If you just average all the values, then you will not get a faithful idea of the direction of the NYSE over time. This is because the partial records may have widely different, unknown offsets. If one record has a very large positive offset, then over all periods where this record is included the average value will go up, regardless of the actual NYSE trend, simply because you are including a high value in the average. You don’t want that. So instead of averaging all indices, you average their anomalies (difference between value at time t and value at a fixed, pre-defined time), because when you subtract the value at time t1 from the value at time t2, the offsets cancel out and the problem disappears: you get the change alone, without any offset.
UAH temperatures seem to be an average of the lower troposphere. They are probably only precise to about 1°, but that stays very constant over time. Thus the deviation from the mean (anomaly) is a much more precise number than the mean itself, maybe with a fault of 0.01° (Spencer explains it much better on his blog).
Are we going to be able to bet on Dec UAH? I see a few people have placed guesses into the comments. 🙂
After the astonishing numbers from the other GISS about UHI, maybe Hadley is considering to take that into account (which they do absolutely not up to now). A large part of their warming may be just UHI (see WUWT, CA).
The triple point of water and absolute zero are the defining points of Celsius and Kelvin temperatures, but the triple point of water is 0.01 C, not 0.00 C. For a while when I was working I actually had a water triple point cell and a standard platinum resistance thermometer with a really big Wheatstone bridge to calibrate thermometers. It’s massive overkill when measuring to only 0.1 degree, but it was traceable to NIST (which may have still been NBS at the time). Doing stem corrections on partial immersion liquid-in-glass thermometers is a pain in the ass. It’s almost as bad as buoyancy corrections for high precision mass determination.
MikeP–
I put the betting form up. This month, you get to bet very late! Almost all the channel 5 data will be in– but that doesn’t seem to give us all that much info anyway!
Can someone tell me what the NCDC baseline offset is relative to UAH and RSS? Wood for Trees gives an offset of (-0.24) for GISS and (-0.15) for HADCRUT.
When will everyone just use a common offset?
Owen,
What you are asking for is a common baseline rather than a common offset. The problem is that the relative newness of RSS and UAH precludes a baseline containing any dates prior to 1979. Regardless, rebaselining is rather trivial to do; just subtract the mean temperature from the new baseline from a series to rebaseline it.
Zeke,
Thanks for the response. Yes, I had meant to say common baseline but offset just sneaked in there. The NOAA offset, I assume is close to the -0.24 for GISS.
Owen,
Again, “offset” is somewhat meaningless without a reference baseline specified. I presume in this case you are trying to create a common baseline of 1979-1998 for all series. The way to do this is to offset each series by the mean of the series during the 1979-1998 period.
My concern is that anoamly graphs are often mis-used to ‘sell’ a man made global warming story..
ie, look at the anomlaly temperature (ie abnormal) away from the ‘normal’ temperatures.
A retrocast one for the period in the 70’s when we were supposed to be having ice age would be interesting, ie negative anomalies to reinforce that message to the public…
In The UK, The DECC used to show an actual temperature plot of CET, they changed it to an anomaly plot, following the Phil Jones interview which stated late 2oth century rates of warming similar to earlier periods rates of warming – which was clear to see in the actual temp plot, but gets lost in the new anomaly plot that the DECC show.
As an aside. is it confirmed that HadCRut, CET, etc wil be moving to a new baseline (as convention requires) ie 1971-2000. It is entirely possible as this baseline encompasses a warmer period, that in a year or 2 ‘neagtive’ anomalies will occur…
I wonder what will be the ‘message’ when/if this happens..
Does anybody know, if the new baseline makes any significant difference in the anomalies?
Bob, do you have a source for ice data and for which arctic ocean SAT is also available that predates the satellite era? Sorry if I’ve missed it in your links. Everything I’ve checked through so far stops around 1980.
Data that stop in 1980 do not help much for reconstructions that want to go back to 1880.
Forgot to put a link in to the DECC graph… (UK Dept of Energy and Climate Change)
http://www.decc.gov.uk/assets/decc/statistics/climate_change/1_20100312122831_e_@@_gafg01.xls
Opens as an excel spreadsheet…
They used to show the same info as actual temperature plots for this data. Changing it to an anomalyplot, I see as ‘hiding’ real temps, and the previous observable in the graphs, historic periods of rates of warming and cooling.
Carrick,
So that Is maybe the reason you have been evading my question about the 1790-1860 Alaska glacier meltdown.
Do you really believe that the very guys who over a period of four centuries – from Barentsz to Bering, the Dutch, Danes, Russians, Brits and Americans, surface ships and the latter half of this century submarines, who repeatly and systematically explored, sounded and mapped every nook and cranny of the Northern and Arctic coasts they could get into, at the peril of their lives – Franklin is an appropriate example- can not be viewed as reliable sources of ice data before the pre-satellite era. It is a matter of record that both the Dutch and the British enforced strict record keeping and standardization of all matters relating to the sea. Think Dutch cartography and say the Beaufort scale for wind and sea state. A matter minor matter of establishing and maintaining trade and sovereign dominance.
Just because their data can not be “homogenized“. So much for “science“.
If anything, what befell Barentsz and Franklin is proof positive of the effects of the LIA.
tetris:
What is the reason do you think?
I haven’t been evading it in any case, I’ve not gone into it because as far as I can see, it’s simply not relevant the discussion.
As to the Dutch data, we don’t have satellites prior to the 1960’s, so it was impossible to accurately map the ice coverage. So much for science indeed.
@Tetris
There’s no point in pointing out historical records that refute global warming theory. There are periods in earth’s history when atmospheric co2 fell by thousands of parts per million and the temperature sky-rocketed. If you’re in the mood for some humor, try asking someone over at realclimate about this. They actually let me get a comment related to this through but I have been heavily censored on another question. I keep asking Gavin Schmidt to respond to Heidi Cullen’s claim that a flood is a 1 in a thousand year event. It is such a bad lie I guess they just won’t respond. Typical.
Carrick,
One of the most massive unexplained glacier melt phenomena on earth on verifiable record before the Industrial Revolution, and you are telling readers here that it is not relevant to the discussion. My -I have to admit very intelligent- dog would probably disagree. I`ll make a point of getting her views before going to bed.
Ladies and gentlemen, here we have it: no Dutch satellite data prior to the 1960s, therfore no verifiable ice off the Dutch coast or a frozen over English Channel… By extension, the children freezing in the streets in England in the 1800s, the gin mills, let alone Scrooge and all of Dickens other stories are humbug, hogwash and unreliable sources, because Mr Carrick says there was no satellite data to verify it. By the same measure, I gather most of Napoleon`s soldiers in the winter of 1812 died of heat exhaution in the Russian steppes, while being cared for by the Cossacks. Again, without splicable satellite data, no way of telling for sure.
As I gently intimated earlier on, you are free to keep your head wherever it feels good, even where the sun don`t shine. No satellite data there for sure; even GPS has a hard time getting through.
Why don`t you actually think things through at bit more and in depth before you fire back at me, because as it is I`m having you for breakfast, luch and dinner, boiled, poached or fried, and that is getting pretty tedious.
tetris:
I’m telling you I don’t find it interesting or relevant. If you do, great.
I’m also saying that we don’t have useful data on global ice coverage prior to satellites. I think that’s completely obvious.
If you think otherwise, maybe you could produce an image for us say for July 1, 1812 like this.
LOL. Lame.
Was Greenland actually Green?
http://blogs.crikey.com.au/rooted/2010/12/03/ask-a-climate-scientist-was-greenland-actually-green/
I wonder if anyoone else has noticed the differences in Lucia’s post headlines like I have… take a look:
“UAH November: Temperature Declined”
“NOAA November was warm too!”
“GISS: Nov. Anomaly =0.74C!”
A haphazard usage of Exclamation Points? Or Alarm!sm? Coincidence? 😉
Andrew
Andrew–
Owing to La Nina, I expected a decline. I did not expect a rise. So… exclamation points indicate my surprise. I think that’s a fairly conventional use of !.
Lucia,
Yeah, I know the feeling. Many people expected 2010, being an El Nino year, to reach a higher temperature than 1998 – what with all the extra CO2 in the atmosphere and all – and, guess what? It didn’t happen! Is that a suitable use of the exclamation mark? 🙂
Arfur
<blockquote.
Arfur Bryant (Comment#63971) December 19th, 2010 at 4:20 am
Lucia,
Yeah, I know the feeling. Many people expected 2010, being an El Nino year, to reach a higher temperature than 1998 – what with all the extra CO2 in the atmosphere and all – and, guess what? It didn’t happen! Is that a suitable use of the exclamation mark? 🙂
Arfur
I didn’t. 1998 was an exceptional year, as a simply eyeball check shows. To get that warm again in the long term trend would still be statistically unexpected. The trend is still up, despite WUWT calling another ice age imminent.
bugs (Comment#63972)
The trend is up?
Why do you not take all the data for 1998 to 2010 from CRU or UAH, transfer it into excel, and let the program calculate the trend? You will be surprised.
lucia (Comment#63955)
Sea surface temperatures are going down, the temperature of the troposphere is going down, but the thin boundary layer in between, 2 m above ground, is getting warmer? I would set an exclamation point, too, because I do not believe that, either.
Bugs,
[1998 was an exceptional year, as a simply eyeball check shows. To get that warm again in the long term trend would still be statistically unexpected.]
So much for a ‘rapid and accelerating rise’… How can you hope to justify the warmist hype if you don’t think 1998 is likely to be beaten?
Alexej Buergin (Comment#63975) December 19th, 2010 at 9:19 am
lucia (Comment#63955)
Sea surface temperatures are going down, the temperature of the troposphere is going down, but the thin boundary layer in between, 2 m above ground, is getting warmer? I would set an exclamation point, too, because I do not believe that, either.
Well you apparently believe in a fictional scenario, particularly regarding the troposphere! According to Roy Spencer his UAH shows that “2010 is now in a dead heat with 1998 for warmest year”. That with the tropospheric amplification observed during the super El Niño of 1998 which was clearly exceptional!
Alexej Buergin (Comment#63974),
No need to bother with Excel. The trend is indeed up (slightly):
http://www.woodfortrees.org/plot/uah/from:1998/plot/uah/from:1998/trend/plot/hadcrut3vgl/from:1998/offset:-.165/plot/hadcrut3vgl/from:1998/offset:-.165/trend
Anyway, who moved the goalposts on ‘how to define the warmest year’?
If the temperature anomaly in 2011 exceeds that of 1998, but the average is less than 2010, will 2010 still be the warmest year or do you honestly think anyone will not try to claim that 2011 is the warmest?
Hypothetical, I know…
Phil. (Comment#63977)
You are mixing up things. This posting discusses the change from September/October 2010 to November 2010, not from 1998 to 2010.
From September to November temperatures went down, of course, as they always do, but anomalies went down at UAH (by 0.2°C, troposphere) and up at GISS (by 0.2°C, surface), while SST went down, too.
SteveF (Comment#63978)
As my grandson always says: “I can do that all by myself”.
I got practically zero when I did UAH monthly data from peak to peak (February 1998 to March 2010).
The super world series olympics championship El Niño of 1998 was a bit stronger than the one from 2010; but according to Bob Tisdale, the difference corresponds to much less than the 0.3°C or more that are missing today (if anyone still believes IPCC).
Maybe we’ll get to monthly sea ice extents based on the old maps soon. For e.g.:
acsys.npolar.no/meetings/final/abstracts/presentations/…/pres_s1_divine.pdf
Alexej Buergin (Comment#63981)
“Why do you not take all the data for 1998 to 2010 from CRU or UAH, transfer it into excel, and let the program calculate the trend? You will be surprised.”
I just did what you said to show you that you were mistaken. The least square regression trend is positive for both UAH and Hadley from January 1998 to present.
Now you suggest a different “trend” for “peak to peak” is not positive. What significance do you think “peak to peak” has as a measure of the trend?
Alexei: your insistence on “peak to peak” comparison is only meaningful if you assume that whatever short-term factors cause the “peak” are highly stable from one peak to the next.
.
Otherwise, you’re just measuring the random variability in peak-causing factors.
.
Just sayin’.
Arfur Bryant (Comment#63976) December 19th, 2010 at 10:34 am
It will be beaten, but 1998 had an exceptional El Nino. Much better to look at the long term trend, than go cherry picking peaks that have a lot of short term noise in them.
Alexej Buergin (Comment#63982)
“The super world series olympics championship El Niño of 1998 was a bit stronger than the one from 2010; but according to Bob Tisdale….”
A bit stronger? A bit?? According to Tisdale, maybe but not to the multivariate enso index (MEI): http://www.esrl.noaa.gov/psd/people/klaus.wolter/MEI/
The 2010 el nino is much smaller than the 1998 and at least 3 other el ninos since 1980, according to the MEI.
Alexej, I admire your dogged persistence in pushing your homegrown “peak-to-peak” method of trend analysis. And just so you can get maximal mileage out of 1998. Not to worry, by 2020 summer arctic ice will be gone and 1998 will be only a blip on the rising curve. (see the US Navy’s take on all this: http://www.dailymail.co.uk/news/article-1339475/Global-warming-Sandal-wearers-wont-save-greed-US-Navy-will.html#ixzz18ZccQwjm )
SteveF (Comment#63984)
“The least square regression trend is positive for both UAH and Hadley from January 1998 to present.”
Steve, I suspect that Alexej might point out (or not) that while the linear trendlines do have positive slopes, they may not be significantly different from a slope of zero at the 95% confidence level. They may be significant, however, at some lower level of confidence (say, 80%). They can also become clearly significant at 95% by going back to 1994, for example. The longer the term of analysis, the more significant the temperature rise becomes. Some skeptics make a living off of short-term analyses.
Owen,
.
Of course, with noisy data and a short period (13 years), the trend is not statistically significant at the 95% confidence level (confidence limits on least square trends is something I wish Wood For Trees would add to their very nice on-line calculation page). That uncertainty does not mean that the calculated trend is not positive; our best estimate of the surface trend since 1998 is in fact slightly positive, even if we know noise in the data makes it possible that the true trend is zero… or negative… or even much more strongly positive.
.
Yes, lots of people (and not just skeptics) make nonsensical statements based on short trends… like Hansen et al (2005) estimating vast ocean heat accumulation based on a ~10-12 year period with rapid surface warming…. said vast heat accumulation dropped to a very low value by the time the paper was in press. So much for short term trends.
Owen (Comment#63990)
Thanks. And the fact that 2010 will be cooler than 1998 is not significant, either.
But maybe the difference to the IPCC prognosis (0.2°C or more warming per decade) is significant.
Owen (Comment#63989)
Summer ice should be gone by 2012, they said in 2007. We will see.
By 2020 people will be complaining about global cooling.
“Yes, lots of people (and not just skeptics) make nonsensical statements based on short trends…”
The phrase “death spiral” comes to mind.
bugs (Comment#63986)
Oh, you’re just priceless. First you say that to beat the 1998 peak will be statistically unexpected. Then you say faithfully that, and I quote, “It will be beaten.”
I can’t be the only person who finds it ironic that pro-AGW alarmists now claim that the 1998 peak was ‘just noise’ due to a super-duper El Nino and we should ignore peaks and concentrate on the long term trend. Where were all these pearls of wisdom back in 1998 when the pro-AGW community (MBH98 etc) were telling us that the temperature would rise in a ‘rapid and accelerative’ fashion? I didn’t see any of the ‘sky is falling’ team using the language of moderation – putting a caveat on the hype that “maybe the temperature this year is exceptionally high due to the exceptional El Nino we’ve had, and we will see the temperatures cool or at least plateau over the next decade…”. Did you?
Now you insist on
a) moving the goalposts to define the warmest year, and
b) telling us that we should only use a long term trend.
Well, here’s the only long term trend that counts, bugs:
1850-2010 = 0.8 deg C in 160 years = 0.05 C per decade trend.
And – guess what? – the trend today is lower than it was in 1878! How’s that for ‘use of an exclamation mark’?
Picking any other start-year to give a shorter trend is cherry-picking. Using any short term trend that doesn’t end in the latest year available is cherry-picking. Me telling you that the 2010 temperature is lower than the 1998 (previously highest temperature) is not cherry-picking. It’s pointing out the truth.
I will try to make it simple. A jump that high in 1998 was unusual. Over time, as the climate warms, the 1998 peak will be passed, but with long term warming that stays.
Arfur, as I’ve said elsewhere 1-year spikes are weather, 30 year trends are climate. The 30 year trend is still positive, so yeah, all else being equally, even a large “weather” excursion is eventually going to get replaced in the record books.
If you don’t understand why measuring trends over long periods are important in a system with weather and short-period climate fluctuations, then you are better off with less snark and a bit more humility on a subject that you obviously don’t understand very well.
This isn’t an issue specific to climate… it’s an issue that pops up anyplace you want to measure secular drift: Trying to look at short-period fluctuations in the precession of the perihelion of Mercury for example would be foolish. In the old days, they typically used long-duration averages (e.g. 100 years) to demonstrate the effect predicted from Einstein’s theory.
Since the advent of space flight, we have more detailed knowledge of the positions of the planets over time and can essentially evolve the planets over time and fit to the anomalous precession of the perihelion (in fact “doing this right” requires applying post-Newtonian corrections or the computed orbits are wrong), but all of this this requires a deterministic system over the period between measurements, with the uncertainty in the result driven in that case by the mass of unknown asteroids.
Lucia (and others) has tried to to reduce the observation period required to measure the long-term trend in climate by including the effects of large volcanic eruptions and ENSOs, she has several posts on this blog on this subject, I invite you to search for and read these posts before making the assumption that people who disagree with you on the duration that is needed to accurately measure the temperature trend due to CO2 forcing are acting in poor faith.
Lucia,
I find it a liiiiiitle doubtful that you are surprised! when graphs that have been designed to show Global Warming for the last x years show…
…warming. Considering how little you actually know about how the climate behaves, it’s whatever your favorite graph says at this point, anyway. One goes up, the other goes down, and Oh My! It’s Still Getting Warmer! 😉
Andrew
bugs (Comment#63996)
[I will try to make it simple. A jump that high in 1998 was unusual. Over time, as the climate warms, the 1998 peak will be passed, but with long term warming that stays.]
bugs,
I will make it even simpler for you. Why wasn’t the ‘unusual jump’ described that way in 1998? The rise from the start of ‘mankind’s emissions’ until 1998 was described as rapid and accelerating and policy makers were advised that it would continue to do so. No-one mentioned a ‘jump’. No-one mentioned ‘noise’ and no-one mentioned that the temperature would flatten off for the next 12 years. They were all quite happy to jump on the pseudo-scientific bandwagon for reasons best known to themselves.
You may be right when you say the 1998 peak will be passed (although I would use the word ‘may’ not ‘will’) but, even if it does, it may be by a hundredth of a degree C. This is not an acceleration. Of course there has been warming since 1850. No-one I know denies that. What is very much open to debate is ‘why’ the warming has happened and whether or not it will prove to be a problem.
You are making an assumption as to the cause of the warming, and then you are speculating as to the future based on that assumption. At least try to be objective.
Carrick (Comment#63997)
[Arfur, as I’ve said elsewhere 1-year spikes are weather, 30 year trends are climate. The 30 year trend is still positive, so yeah, all else being equally, even a large “weather†excursion is eventually going to get replaced in the record books.
If you don’t understand why measuring trends over long periods are important in a system with weather and short-period climate fluctuations, then you are better off with less snark and a bit more humility on a subject that you obviously don’t understand very well.]
Carrick,
Oh for goodness sake, get off your high horse. What a bunch of preposterous and deflective nonsense.
If you actually read my posts to bugs, you would realise that I am the one who is championing a longer trend! I repeat, no-one talked about ‘noise’ and ‘jumps’ back in 1998. Of course a one-year spike is weather. That’s obvious. What’s also obvious is that the temperature has not trended significantly up since then – even Phil Jones admits that. You want to use 30 year trends? Fine, but don’t try to make out they are any more valid than the overall trend of 160 years. That’s the one I use. It’s a longer trend than yours, in case you hadn’t noticed. It shows an upward trend – I have no problem with that – but the trend is a mere 0.05 C per decade. It’s a lower trend now than it was 12 years ago, and it’s lower than it was 132 years ago. In between the 30-year ‘interim’ trends have occasionally been steeper and they have occasionally been flatter. Sometimes, they have been negative. So what?
You can accuse me of ‘snark’ as much as you want. Just don’t pretend that I’m not being objective about interpreting the long term trend! If Lucia disagrees, I’m sure she is big enough to tell me herself.
Don’t lose sight of the wood for the trees, Carrick. This is a climate blog ‘where climate talk gets hot’. If you want to take a pro-cAGW stance, that’s your prerogative. Some proof to back up your blind faith in the theory would be nice…
Arfur,
Do you believe that increasing GHG’s will cause some warming, or not?
.
You are correct that there is a huge amount of politically motivated BS among ‘alarmists’, and like Al Gore, many will point to any bit of pseudo-scientific rubbish that will advance their policy goals. Addition of alternative pseudo-scientific rubbish (like ‘peak to peak trends’ suggested above) is not helpful. Suggesting that the trend from 160 years ago to now is a reasonable way to estimate the influence of rising GHG’s, when we know that most of the rise has taken place in the last 75 years, is equally unhelpful.
.
If you honestly believe that the radiative forcing from a large increase in GHG’s will lead to no increase in average temperatures, then you are engaging the crazy green/left argument of ‘the world is ending’ with an equally implausible one. The only real scientific uncertainty is the magnitude of warming from GHG’s, not that these do cause some warming. There is good reason to try to determine the Earth’s true ‘climate sensitivity’, because there is good reason to believe that GHG’s could make a significant contribution to future warming; people need to know what that contribution may be.
.
The political issues of what (if anything) do do about GHG driven warming is mostly unrelated to the question of climate sensitivity. You would be wise to keep the political and technical issues separate.
SteveF (Comment#64001) December 20th, 2010 at 9:36 am
That’s only if you believe the planet acts exactly like a greenhouse. I know plenty of earth scientists who don’t believe that and think there’s HUGE holes in the theory. From what I’ve read recently about the UHI situation I don’t even believe the planet has “warmed” at all! You are all still arguing over tenths of a degree!!!!!
Arfur:
Then you go on to pretty much agree with me. I’m glad you can admit that one can’t use specific events such as the 1998 spike or the cooling over the last decade as “evidence” at least.
Lolz!
So which part is preposterous then?
You’re wrapped yourself into an epistemological pretzel here, Arfur. Nicely done.
As I stated, this isn’t about climate science per se, it’s about properly interpreting data, any kind of data. Sorry you weren’t able to follow the example with the secular drift of Mercury’s perihelion, that was apropos.
On to the rest, I personally don’t think that the data are reliable before 1950, do to an incomplete coverage, and a changing geographical centroid for the data, which tend to introduce a warming bias that may not be there.
See this. Since there is a latitudinal bias in the rate of warming (high arctic has the faster warming rate), data from the early 20th century should show a greater rater of warming than was actually present.
It may make it easier for you to just dismiss what I have said as “acts of blind faith”, but you ignoring data when it is presented to you, isn’t going to establish an bona fides on your part as an objective observer.
We do know (and have known for a century) from basic physics that everything else being equal, that increasing CO2 increases the radiative forcing associated with it. While there are other forcings (both anthropogenic and natural), I don’t see how you can ignore the physics involved here.
Funny how your group assigns any disagreement with your own basic tenets of faith as either acts of poor faith or acts of blind faith. It couldn’t be that they looked at the facts and the science and came to a different opinion.
No possibility of that, is there?
“from basic physics that everything else being equal”
Except this is a DYNAMIC planet and NOTHING is ever equal.
The physics of a ball rolling down a hill is solid except when there’s a rock or river, or hole or tree in the way.
You can pick whatever time limit you want to make your little charts but you still don’t know the REAL year 0 was or what happened to make year 1, 2, 3, 4 or 5 the way it was. C02 is a political and convenient SCARE tactic. Correlation is NOT causation. All over the world right now people are experiencing very cold weather and it’s not even officially winter yet. Winter is timed and caused by the planet moving into a certain position. And gee winter came early this year no matter how much C02 we’ve pumped into the atmosphere. How is that possible?? LOL
Liza:
I think this is an example of the “uncertainty monster”.
As to rest, we’re back to assigning bad faith to people we disagree with.
Carrick (Comment#64005)
December 20th, 2010 at 10:32 am
Liza:
Except this is a DYNAMIC planet and NOTHING is ever equal.
I think this is an example of the “uncertainty monsterâ€.
As to rest, we’re back to assigning bad faith to people we disagree with.”
1. Liza is correct and Carrick makes a Carrick-ature of the fact he knows “all things being equal” only happens in his imagination, because he has no argument against Liza’s point, other than to conjure images of monsters.
2. We are free, for the time being, to exercise our own judgement in assigning “bad faith” to people who behave in bad faith. To do otherwise is foolish. Evidently, no one behaves badly in Carrick’s world, except for skeptics, who need to be told by him what to do.
Andrew
Liza,
“From what I’ve read recently about the UHI situation I don’t even believe the planet has “warmed†at all! ”
Really. You mean like the satellite measurements of the lower troposphere temperature which ought to be immune to UHI effects? http://www.woodfortrees.org/plot/uah/plot/uah/trend/plot/rss/plot/rss/trend
Or the sea surface temperature data… where there are no UHI effects at all?
http://en.wikipedia.org/wiki/File:NOAA_Ocean_Temperature_Anomaly.png
Thanks AndrewKy! Merry Merry Christmas to you.
Carrick, I have to ask. do you think the Milankovitch Cycles is a monster?
Because if you forget what you believe about C02 and look at those cycles we are at a PEAK right now where is supposed to be the warmest on this planet.
Why are you not running around yelling about that warm? So funny, because of data resolution; not a soul on this planet knows how long that warm will last do they? It could all change tomorrow and the planet could start moving down into the trough of an ice age just as sure as anything.
I have NO problem with finding alternative energy sources. I wish you “smarty pants” people would work on that instead of pointing to the DYNAMIC climate of this planet, handing out your guilt trips and trying to scare my children about their future.
SteveF (Comment#64007) December 20th, 2010 at 10:51 am
All that technology has not been around long enough to claim anything unusual is going on and you know it. You are still arguing about tenths of a degree. And I am not going to stop pointing that out.
Hi liza!
Thank you, ma’am. And a Very Merry Christmas and Blessed New Year to you and the fam, too!
We are going to have a White Christmas this year it looks like.
Andrew
Andrew
I see Andrew can’t avoid name-calling, mockery and personal attacks as usual. It’s what replaces “reason” in his case.
All things being equal is the same thing as saying “the dice are loaded” towards one side. That means yes there will be natural oscillations that push us one way and others that push us the other…maybe you can even eventually come up with a natural feedback ( that counters the additive forcing from increased CO2. Maybe.
It’s literally an uphill battle to come up with natural mechanisms that offset the warming induced by CO2. That’s what “all things being equal” means.
Except your only modus operandi is to attack people who you disagree with as having bad faith. And without ever showing what is wrong with their reasoning.
You are behaving badly here, you hardly need my help pointing that out.
SteveF (Comment#64001)
SteveF,
The answer to your first question is ‘Yes, I do’. I hope that is clear enough for both you, Ccarrick and bugs.
I also agree with you – completely – that “The only real scientific uncertainty is the magnitude of warming from GHG’s, not that these do cause some warming.” This is fundamental to my skepticism. The theoretical contribution of ghgs to the ‘greenhouse effect’ is just that – theoretical. Increasing ghgs should, theoretically, lead to a warmer globe but their contribution could be anything from negligible to catastrophic.
I suspect this is the area of disagreement between us. I would prefer the discussion to be purely scientific but, unfortunately, political mileage has always been made from the initial, unproven, unmeasured and possibly specious use of ‘science’.
I hope this explains my position to you.
Regards,
AB
liza:
Certainly is. You’ve evoked something that works on 10s to 100s of thousands of years not 10s of years, and which fails to explain the phenomenon.
So yeah, great example.
And I wish you would get a grip on reality. I’m not running around with guilt trips (or trying to invoke them in other people) or trying to scare anybody’s children.
Yet another assumption of bad faith. Priceless.
You, Andrew, Arfur, tetris and others all suffer from the same inability to recognize that somebody may be disagreeing with a comment you are making on a scientific basis, but that this disagreement need not be indicative of their political views.
“the additive forcing from increased CO2”
This is a personal belief of yours.
Feel free to explain how you know the above quote is true. If you can’t, I can only assume you are acting in “bad faith” when you behave as if you know it is a fact, rather than a belief.
Andrew
Andrew_KY:
No, it’s science.
Would links help in your case? You seem pretty sold that we’re all a bunch of hippies acting on bad faith and anything I give you is likely to be greeted with a closed mind. Why should I make an effort in that case?
Maybe that’s me making the assumption of bad faith on your part, but I’ve seen no evidence to the contrary to this point.
(If you are truly interested in becoming educated, instead of just spouting off, here is the place to start IMO).
Carrick (Comment#64003)
Carrick,
[So which part is preposterous then?]
The part where you ignore the thrust of my line of argument with bugs and go off on a pathetic attempt to deflect away from that line.
You have my tangential respect for selecting the points you wish to argue, and ignoring the rest. Just to refresh your memory, the use of ‘weather’ issues such as 1998 was not mentioned at the time. Why wasn’t there a big note on the Hockey stick graph warning all the readers that ‘this is just a blip’?
More preposterousness? How about this:
[Carrick: “I personally don’t think that the data are reliable before 1950…”]
Ok, so now you want to start the warming from after 1950 because you don’t like the fact that there were some periods of warming before that. (Curiously, one fairly large rise which finished just before 1950! Hmmm…)
And, finally:
[Carrick: “Funny how your group assigns any disagreement with your own basic tenets of faith as either acts of poor faith or acts of blind faith.”]
Yeah, funny, isn’t it?
Oh, by the way, would you happen to have the source for you graphs?
Carrick, in spite of all your protestations to a higher ‘scientific’ stance, the evidence from the planet (that’s Earth, by the way…) does not support the theory of cAGW. Even just AGW hasn’t been proved. The ‘potential catastrophe’ of a 0.8 deg C in 160 years just won’t wash. Liza is quite correct to continually point this out.
Arfur,
“I suspect this is the area of disagreement between us. I would prefer the discussion to be purely scientific but, unfortunately, political mileage has always been made from the initial, unproven, unmeasured and possibly specious use of ‘science’.”
I am a scientist (as is Carrick). My politics have nothing to do with my technical evaluation, but just to be clear, I am probably best described a ‘libertarian’. Mostly I hate stupidity, lies, waste of resources, and solutions that are worse than the problems they are supposed to address, and politics is full of all four. I object to efforts (from any quarter) to interfere/obfuscate/delay/block accurately quantifying Earth’s sensitivity to GHG forcing. And there is plenty of that from both the left and the right on the political spectrum, as you can see from reading comments here and other climate blogs. Worse, within climate science itself there is an appalling tendency to avoid addressing the important issues… like very large uncertainties and the pure idiocy of relying on models which ALL used fudged forcing histories to fit the historical temperature data… along with the absurd insistence that an average of multiple obviously incorrect models is somehow more likely to be correct.
Just please don’t suggest that I have political motives in trying to understand climate sensitivity. I don’t.
Arfur:
How is my addressing the issues I thought were interesting “a pathetic attempt to deflect”?
What do you think I was deflecting from? I addressed what I thought was interesting to comment on and I ignored what I saw as prattle, it’s a habit of mine.
I said the 1) data are baised and 2) I gave an evidence-based reason why. I never said it wasn’t warming prior to 1950, just that there are issues with the temperature reconstructions prior to that.
How do you conclude from that, that I “’don’t like the fact that there were some periods of warming before that.”
I binned you in with Andrew_KY because you seem to take observation of error on your part as some kind of proof of religious fervor on my own part.
Well that’s your take on it. There are measurements that support it (I’m thinking radiative physics), and the arguments that counter this are mostly hand-waving or have been shown to be in error.
You can make as many proclamations handed down from God himself as you want, but if you’re to convince people, you’re going to need to fill in a few more details besides just launching personal attacks at people you disagree with conclusions on.
Liza could invoke a wizard of oz explanation for current climate and if you agreed with the conclusion, you would agree with her. You guys are the ones with the blind faith in pre-arrived at conclusions, it shows in everything you say and in the type of tactics you choose to engage in.
Carrick,
You can call it ‘science’, but in any case (I’ve discovered after years of observing climate discussion) it requires several levels of belief on your part:
1. Belief that climate data that is collected by someone else is all the relevant data and no relevant data has been excluded.
2. Belief that the climate data itself (the numbers) represent what you think they represent. (2 apples? 2 oranges?)
3. Belief that post facto climate “adjustments” make the data more reliable rather than less reliable.
I’m sure there’s more, but you understand, I hope.
Andrew
Carrick, “Liza could invoke a wizard of oz explanation for current climate and if you agreed with the conclusion, you would agree with her. You guys are the ones with the blind faith in pre-arrived at conclusions, it shows in everything you say and in the type of tactics you choose to engage in.”
answer my question about the Milankovitch cycles.
(THAT could explain “warmer” temps ie: your “climate” of the planet, Arctic warming is it? …. in TENTHS of a degree. Especially since the planet recovered from the Little Ice Age! Sheesh.
To follow up on SteveF, to be clear, I am no liberal (South Park independent would probably best suit my views). Like Steve, I try to separate my political beliefs out from my scientific views.
I don’t have much more faith in the historic reconstructions of the forcings than SteveF does (Lucia and Carrot Eater disagree with me), but I still believe they have mostly been tuned to give the “right answer”… in particular the TSI forcing used by the GCMs in the early 20th century is larger than can be supported by solar physics, and sulfates (again my opinion) have been largely chosen so they balance the added CO2 until the late 1970s.
Probably where SteveF and I depart slightly is that I don’t view the GCMs as a waste of time, and that they can be used to help shape policy. Where I certainly disagree with bugs on is what the GCMs imply. He seems to think they point towards an impending catastrophe, I think the most probable scenario (even at the 95% level) is they will not.
I have stated here and other places that my chief concern with the economic development of the third world countries is the havoc it will play on the environment over a much shorter time scale than the extra CO2 that will get produced. This suggests a policy direction that developed countries need to take that is at right angles to that suggested by most climate scientists.
Carrick,
I think this is not worth the effort.
Liza:
You missed it. I did.
Arfur:
None of these have anything to do with how I drew the conclusions I drew. Seriously… none of them.
Carrick:
“Certainly is. You’ve evoked something that works on 10s to 100s of thousands of years not 10s of years”
Oh yeah when did it stop working/effecting the temps or the ice exactly? And tell me how you know exactly how it works when NO SOUL on the planet does from peak to trough. Sheesh sir. Your belief is showing.
SteveF:
Unfortunately you’re right… (Sound of thread spinning down.)
liza:
follow the link, get edumicated.
As I said, Milankovitch is not explanatory. And has little or nothing to do with the response of the Earth’s climate an increase in CO2 in any case.
Have fun, I’m out of here.
Carrick wikipedia? LMAO
SteveF (Comment#64017)
Steve,
You may be surprised to find that I agree with every word you said in that post.
I assure you that I do not consider you have political motives. I would not have wanted to give that impression.
My point regarding politics is that the science is being used for political ends. I suspect we both agree on that.
Regards.
Carrick,
“Probably where SteveF and I depart slightly is that I don’t view the GCMs as a waste of time, and that they can be used to help shape policy.”
I do not think they are a waste of time, they are just a very long way from being capable of making reliable predictions. Should work on models continue? Sure, but I think a much higher priority needs to be given to gathering credible data that will allow verification (or, as I suspect more likely, rejection) of those models: ocean heat accumulation, and accurate measurements of man-made aerosols.
It is the lack of solid data which holds back progress, and I fear political priorities may be in part responsible for lack of scientific progress in collecting/using good data. How can not one of the 20+ IPCC models not have been simply rejected? How can modelers not acknowledge that the models all use very different historical (fudged) forcings, and from that we KNOW that most (and maybe all) of them must be very wrong? Really Carrick, this whole field is just very weak.
So I think consideration of model projections (at this time) in formulating public policy is pure folly.
Whoa. Whoa. Carrick, hold a up second there. You mean to tell me that you don’t believe in the disaster scenario! Great news! Now, I need you to do some explaining about your concerns for economics in 3rd world countries, you were not clear.
I suspect that most people here know by now that alternative energies are an outright scam. An electric car solves no problems. You still have to charge it and that in turn burns a fossil fuel. Also, we know that the “green” products are always more expensive than the normal products, even if the quality is lower on the green product. Unfortunately, I don’t know where Lucia stands on green products.
Examples: green house cleaning products. Next time you go to the store, compare the normal product to it’s green counterpart. Cell phone chargers. You can get a solar powered cell phone charger for a few hundred dollars or you can get a normal one for 20 or 30 bucks.
Chevy Volt: 32,000 dollars, and that is with the tax credit included. Who in their right mind would buy the Volt if they had that much money to spend on a car. You could get a Cadillac or a Mustang for that much money and you the quality is much higher.
So Carrick please explain what you meant by your concern for third world countries. I hope your not one of the clowns suggesting we should tell them not to build coal powerplants or drive gasoline powered cars.
Carrick (Comment#64018)
Carrick,
Unlike, Steve’s previous post, I find myself in disagreement with you on almost every count.
You and I obviously have different opinions on what constitutes ‘interesting’ and what constitutes ‘prattle’. I see you have again ignored the thrust of my argument – that the 1998 ‘peak’ was not described as being possibly temporary at the time. So be it. It still remains a valid argument.
As to the pre-1950 data, let me get this straight. You are not comfortable with the reconstructed data prior to that date? So you, as a scientist, are happy with the data since that date? So you wish to base your support for the cAGW theory based solely on post-1950 data? Have I got that right? Please give me the source of your ‘evidence based reason why’ the data was biased before and tell me where you stand on the possibility of there being some bias in current data collection methodology.
What ‘observation error’ did I make that makes you want to ‘bin’ me with Andrew_KY?
Please tell me where I have made a personal attack on anyone. Seriously.
Now back to the science:
[Carrick: “Well that’s your take on it. There are measurements that support it (I’m thinking radiative physics), and the arguments that counter this are mostly hand-waving or have been shown to be in error.”]
Ok, please tell me what measurements have been taken to support the radiative forcing theory quantitatively.
Carrick, I can assure you that I do not have blind faith regarding anything. You may not like the fact that I disagree with you but you need more than just ‘I’m a scientist – trust me’ for me to believe you.
Carrick (Comment#64021)
I agree with a lot more of that!:)
I find this all very interesting. While I do agree that increased GHGs must cause warming at some level, we have yet to quantify this warming in any meaningful way that can be tested or observed beyond the scope of natural climate variation. We simply don’t know.
If indeed Carrick is a scientist, I find it interesting that he continues to ignore or brush aside volumes of historical evidence that demonstrate clearly that NH ice was melting at a faster rate both mid 1800s and the period 1940-1950 than it is today (1980-2010). How very unscientific.
There is a very detailed record of NH glacier advance and retreat spanning the last 400 years if one chooses to look. The best is probably the study of the Alps, as the Swiss are meticulous keepers of record. Similar long term glacier studies can be found in Norway, Sweden, Iceland, and Finland. Very detailed arctic ice mapping was also done during the 1800s by teams of arctic explorers and Naval cartographers. Satellite studies are certainly a convenient tool for ice analysis over the last 30 years, but completely useless for measuring long term NH glacier advance and retreat, mass balance, and the climate variations they so clearly indicate.
http://pubs.usgs.gov/pp/p1386e/alps.pdf
Carrick (Comment#64024)
Carrick, that post was not mine… It was Andrew’s
“‘bin’ me with Andrew_KY?”
Hey! My Bin might turn out to be a good place to be. I buy beers sometimes! 😉
Andrew
liza:
If you think there are problems with what it says, point them out.
@ivp0
Sir, that was an excellent link. Could you please expound on that link you provided? I do not have the mad analytical skills necessary to objectively evaluate such an awesome report. Strangely, I noticed that the authors do not seem to take on any opinion. Yikes! Gasp!
Arfur, I think I told you this already but again, people who believe in global warming hold either 1 of 2 beliefs. 1 is the most common, and this is the belief that history started when they were born. This is infectious with my friends, as they say there was no medieval warm period, hurricanes are bigger now and the world has never been warmer. Belief 2 is that nothing pre 1950 is relevant because “there were not as many people around” and that is a paraphrase from a response I got at reaclimate. Also they said “agriculture depends on a stable temperature”. I think belief 2 makes more sense but it is still invaild to me because all that would happen is we would grow different foods. If our weather became tropical, we could grow bananas. Personally, I think that would be cool. Think about having a coconut tree in your backyard! Either way, these outright denials of historical record are very telling. If the Gorists are so deathly afraid of acknowledging the MWP, they obviously have a lot of doubt in their own convictions.
STARTLING NEWS. Realclimate has a new post on how colder winters indicate global warming. Lucia, can you please call them out on this BS and do it without the usual technicalities? Otherwise, if we have a warm summer, I am going to apply their same logic and claim the warm weather is an indication of global cooling. Then when you tell me no, I am going to come back to this post and say “well, but Lucia, you didn’t object to realclimate saying colder winters indicated global warming?” Sorry, I just wish somebody could call one of these places and tell them they would be fined or something for saying such stupid things.
SteveF:
We mostly agree on this point. I have explained that I don’t think the models (without a social economic model included) can actually predict or forecast anything. At best, what they are capable of doing is giving us tendencies. And those are probably unreliable due to the nonlinear coupling of short-period climate fluctuations to the long-period forcings.
Even what they do say (from my interpretation of them anyway) is not that doom is around the corner if we don’t “act now”. Rather, when one sums up the various threats on our environment and on the world society, they show up maybe 15th-most on the list. In other words, I pretty much agree with the Copenhagen Consensus on this.
ivp0 (Comment#64034),
“If indeed Carrick is a scientist, I find it interesting that he continues to ignore or brush aside volumes of historical evidence that demonstrate clearly that NH ice was melting at a faster rate both mid 1800s and the period 1940-1950 than it is today (1980-2010). How very unscientific.”
I am quite sure he is a scientist (I suspect physics or physical chemistry) based on the content of his comments here and at The Air Vent.
With regard to melting of glaciers: The issue is a bit more complicated than only temperatures. Net glacial melting is related to temperature trends as well as the amount of winter snowfall; and it may not be easy to figure out exactly what is responsible for documented pre-20th century melting. In addition, glaciers tend to be at high elevations, and they melt from below (since the average air temperature increases at about 0.5C-0.6C per 100 meters decrease in elevation). 150 years ago, the bases of many retreating glaciers were at much lower altitudes than today…. and no doubt at those lower altitudes due to the cold of the little ice age. Warming temperatures after the little ice age (~+0.7C?) would be expected to melt glaciers formed during that colder period, so it does not seem unexpected for substantial glacial loss to have been noted in the 1800’s. Warming of ~0.8C in the last hundred years would also be expected to cause glacial melting… now at higher elevations.
ipv0:
I’m interested in the scenario when CO2 doubles. I don’t discount natural forcings, but studying unknown forcings with uncertain data doesn’t provide much insight into that issue.
STARTLING NEWS #2
HO HO HO MORE BRLLIANT QUOTATIONS!
Dominic Lawson, The Sunday Times, 10 January 2010: A period of humility and even silence would be particularly welcome from the Met Office, our leading institutional advocate of the perils of man-made global warming, which had promised a “barbecue summer†in 2009 and one of the “warmest winters on recordâ€. In fact, the Met still asserts we are in the midst of an unusually warm winter — as one of its staffers sniffily protested in an internet posting to a newspaper last week: “This will be the warmest winter in living memory, the data has already been recorded. For your information, we take the highest 15 readings between November and March and then produce an average. As November was a very seasonally warm month, then all the data will come from those readings.â€
“The data have already been recorded”. Lucia, you realize this could be the warmest and coldest winter on record? I mean, I could average the 15 coldest days and find it to be the coldest winter. And since the data has already been recorded, we can conclude the cherry picked the hell out of the data and used mostly November temperatures. SOMEBODY PLEASE SHOW SOME OUTRAGE! THESE CLIMATE SCIENTISTS ARE WORSE THAN POLITICIANS. I wonder how they test the heat of a fire? They probably put their hands in an open flame and see how much flesh burns off.
@Carrick
“studying unknown forcings with uncertain data doesn’t provide much insight into that issue.”
Are you serious? That would be the definition of global warming. More like fake forcings with fake data though. Carrick honestly, look at how the Met office computes the temperature. The average of the 15 highest temperatures?
Gentleman, the doctor is in and he is not pleased today.
Shoosh:
No I’m not one of those at all. (South park politics should have clued you in on that.)
We need to address the reality of a rapidly growing third world economy and the stresses it is going to put on the global social-economic system. We are not going to be able to stop them from advancing (nor do I advocate that in any way), but we may be able to ameliorate with some foresight some of the consequences of that growth. I’m not the ideal person to advocate any sort of policy here, there are others (Roger Pielke Jr for example) who are more qualified than me on this, even if he is semi-heretical and regularly gets attacked by the zombies from Joe Romm’s site.
Shoosh:
So … if you don’t like the more recent data that are much more controlled, WTH would you even look at highly uncertain data from 1850???
I’ve been getting zinged by tetris/ivp0 and by Arfur for “ignoring” data I don’t like, and you’re zinging me for paying attention to newer, much more controlled data (e.g., UAH satellite reconstructions). Logical pretzels anybody?
@Dr. Shooshmon… that 15 days thing is an urban myth. It came from a blog comment, not the Met. Who, though they make the most reliable long-range weather forecasts in the known Universe [as long as you know they’ll be 180 wrong, guaranteed] aren’t quite that stupid.
Quote SteveF:
“With regard to melting of glaciers: The issue is a bit more complicated than only temperatures. Net glacial melting is related to temperature trends as well as the amount of winter snowfall;”
I completely agree. Ice mass and extent is complicated. It is simply one piece of the long term climate puzzle. It is a very big piece though that is far more concise and with far fewer complications than dendro or sediment studies. Combine historical glacier records with GRIP2 ice core analysis and you get a concise picture of long term NH climate that looks very different than Mann08. It supports a general step warming trend that began circa 1700 and continues through 2000.
Arfur:
I think there are unaddressed errors in the reconstructions prior to 1950 (they give too much warming due to the geographical bias error), even if you can stomach the extra data quality issues from that part of the data set.
I’ve included the links above. In science, one needn’t necessarily rely on references (appeal to authority) but to the facts that are in front of us plus our own reason.
My conclusions are based on my own calculations, but they are readily repeatable by anybody. You simply look at the area weighting scheme used by CRUTEMP, and look at mean latitude of the non-zero grid cells. Due to the paucity of stations prior to 1950 (esp in the southern hemisphere), there is a net northern bias in the data, which decreases over time (that’s the first figure I linked too above).
Secondly, select the period 1960-2009 and compute the mean trend as a function of latitude (that’s “tdot” in the second figure). An oversampling of northern latitudes will lead to an artificially inflated temperature trend.
I never said it was an observation error: It was on the willingness to assume a political bias (e.g., “blind faith”) on my part to explain why I was disagreeing with you on an issue as well as the willingness to engage in ad hominem attacks with people who disagree with you.’
(I also never said it was unique to the “climate skeptics”, it’s a ubiquitous part of human nature that one tries to suppress in a rationally framed disagreement.)
“the willingness to engage in ad hominem attacks”
Well, at least the tread didn’t fall to the level of calling people ‘douche bags’ a la Mosher!
Carrick,
“stresses it is going to put on the global social-economic system”
Absolutely. The divergence of incomes in developed countries (more evident in the USA, but elsewhere as well) is a early symptom of this kind of problem. High unemployment in the USA among people with lower skill levels is only likely to get worse with continued migration of production to developing countries. A huge social problem that politicians (left and right) seem unwilling to address with anything more than political slogans.
Quote Carrick:
“I’m interested in the scenario when CO2 doubles. I don’t discount natural forcings, but studying unknown forcings with uncertain data doesn’t provide much insight into that issue.”
I too am interested in the scenario when CO2 doubles. We really cannot quantify this with any certainty right now. Perhaps some day in the future. We can measure the pure effect of CO2 in a controlled lab experiment but that does not translate well to an open mixed gas atmosphere. To suggest that “most of the warming since 1950 is primarily due to anthropogenic CO2” without a clear understanding of well documented historical warming events may simply be a misinterpretation of our data. I must consider this possibility when determining the role of CO2 in our recent warming trend.
@Zer0th
Excellent news my friend. Thus, I will be expecting to see an immediate correction and an explanation of how the temperatures are calculated. I will be in touch with you tomorrow, patiently waiting for the correction. Also, I am not familiar with the MET office track record. However, I suspect most of their “accurate” predictions predated the global warming scare. Sorry, but they are currently using faulty data to add in unsubstantiated forcings (don’t know if its clouds or water vapor) and it is resulting in bad forecasts. NASA was once a fine institution but it is now a joke. It is a shame that once fine institutions have been co-opted by hacks.
@Shoosh: I don’t bat for the Met but you could try this page…
http://www.metoffice.gov.uk/climate/uk/about/methods.html
.
Try reading my post again regards: “the most reliable long-range weather forecasts in the known Universe” — hopefully it won’t go shoooosh over your head this time.
.
They [The Met Office] gave up on official seasonal forecasts earlier this year due to serial embarrassment… compounded by the fact that privateer skeptics *were* predicting the long-range weather pretty reliably. e.g. Piers Corbyn & Joe Bastardi.
After 3 disastrously wrong season predictions, despite a recently obtained 30 Mio Sterling (!) Megaflop Kray Supadupa computer paid by tax money and 130 Mio Sterling running cost (!), MET is facing a huge credibility problem.
.
So why do they still get it so wrong? Maybe these facts do shine some light on this phenomenon:
.
The Chairman of the Met Office board, Robert Napier, is or has been:
.
* Chairman of the Green Fiscal Trust*
* Chairman of the trustees of the World Centre of Monitoring of Conservation
* a director of the Carbon Disclosure Project
* a director of the Carbon Group
* Chief executive of the World Wildlife Fund U.
.
Conspiracy? Maybe, but still…
Okay, so half of the time 1960-1990 they were not influenced by global warming politics. 1979-2000…didn’t they lose the archived temperature data?
Anyway, I don’t care if the MET office themselves claim to be the most reliable long term predictors because I have predicted the average temperatures better myself. Understand Zer0th that I was one of the original few who had the courage to agree with Dr. Limbaugh on this issue. It’s really quite a joke, Dr. Limbaugh has been arguing with Al Gore since he started warning people about the ozone hole. Now we know Rush was right about the ozone hole myth so I am going to stay with the guy who has the better record.
On a side note, I think its important to understand the concern regards co2 doubling from 280ppm to 560ppm. Is this unprecedented? No. Has there been more co2 in the atmosphere? Yes. Has the temperature risen when co2 has gone down? Yes.
I have solved global warming and it is a hoax.
Bugs, you mentioned that there weren’t humans “pumping tons of co2 into the atmosphere” quite right, dinosaurs and other things were. In fact, they were pumping much more co2, so why are you concerned with the insignificant amount we produce? HO HO HO!
Lucia, I was wondering if we could have a discussion on Thomas Gold.
http://www.semp.us/publications/biot_reader.php?BiotID=182
I believe the man was a genius. His theory begs an important question.
When asked what first prompted him to think that oil and natural gas are generated from hydrocarbons present at Earth’s formation, Gold replied, “The astronomers have been able to find that hydrocarbons, as oil, gas and coal are called, occur on many other planetary bodies. They are a common substance in the universe. You find [large quantities of hydrocarbons] in the kind of gas clouds that made systems like our solar system…Is it reasonable to think that our little Earth, one of the planets, contains oil and gas for reasons that are all its own and that these other bodies have it because it was built into them when they were born?†(7)
When the interviewer replied, “That question makes a lot of sense. After all, they didn’t have dinosaurs and ferns on Jupiter to produce oil and gas,†Gold said, “That’s right. Yet, for some reason my theory was not heard. The theory that it was all made from fossils ha[s] become so firmly established that when the astronomers had perfectly definitive evidence on most of the other planets, it was just ignored, especially by the petroleum geologists who had, by then, called these things, ‘fossil fuels.’ So once they had a name, then every body believed it.â€(8-9)
So then, how do these other planets have oil on them when there were no dinosaurs to fossilize on these planets? And yes, if anyone is wondering, I firmly believe oil is renewable.
Re: ivp0 (Dec 20 12:35),
It’s fairly easy to find out who Carrick is and his credentials and publications, unlike others who post anonymously. I’m not going to do your work for you though.
Re: Dr. Shooshmon, phd. (Dec 20 15:29),
Oh, please, not abiotic oil. All but traces of the primordial carbon in the form of methane that was left after whatever event blew most of the light elements out of the inner solar system was converted to various forms of carbonic acid when the atmosphere became oxidizing. All forms of reduced carbon since then were created by biological processes. Petroleum has precisely nothing to do with either dinosaurs or ferns, btw.
DeWitt Payne (Comment#64062)
There is some credible work from a group of Russians using diamond anvil cells at high temperature which indicates abiotic hydrocarbons’ are at least plausible. The procedure is fairly simple: mix calcium carbonate, a bit of water, and less than fully oxidized iron (magnetic iron oxide or iron), subject the mixture to pressures and temperatures similar to 30 miles below the surface, and you reduce a fraction of the carbon in the carbonate to a mixture of hydrocarbons, including methane to octane molecular weights. The subduction of carbonate rocks at plate boundaries and reduced iron at depth could provide the right mix of conditions.
Which is not to say that this is the source of most petroleum. The biological markers in most petroleum sources are obvious, so if it exists at all in nature, abiotic petroleum (or natural gas) is probably rare.
Carrick (Comment#64037) December 20th, 2010 at 12:44 pm
“If you think there are problems with what it says, point them out.”
The problem with what it says is that it has nothing whatsoever to do with what I am asking you. Wikipedia and it’s sources can debate all day but either you or they believe the geologic record (the ice core records at that link for that matter!) or not. The last time the earth was at a peak in the cycle, 125,000 years ago give or take a few hundred years– sea level was 20 to 30 ft higher then it is now. 18-12,000 years ago,the very recent past the planet got warm enough to come out of an ice age and apparently still is because there is still ice and sea level has not risen to 20 FEET yet. sheesh.
…even wikipedia’s first sentence says:” Milankovitch Theory describes the collective effects of changes in the Earth’s movements upon its climate” At the very end of that page under “Present and future conditions” it says “the mechanism by which orbital forcing influences climate is not well understood.”
And it gives two conflicting papers/ models to reference.
In other words, no body knows. Just like I said above.
Andrew_KY (Comment#64036)
Andrew, that’s very kind of you – I’ll have a flat coke please, with the CO2 removed! 🙂
Dr. Shooshmon, phd. (Comment#64060) December 20th, 2010 at 3:29 pm
It is a common pattern of thought that there is a school of ‘skeptics’ who find even the most basic climate science to be unacceptable, but will readily believe the most absurd theories without question.
Carrick (Comment#64051)
Ok, Carrick, I’ll try to address your concerns.
There may well be some geographical bias in the HadCRu data between 1850 and 1950, but it is probably the best available and that’s what we have to work on unless you are arguing that the only ‘accurate’ data comes from satellites. If that is what you are saying (and it appears to be), then you should effectively disregard all data collection before 1950. This would appear to be both extreme and limited. From 1950 the trend is initially flat, then accelerates upward but now has flattened again. The current trend is actually reducing. It seems strange to me that you are so willing to discount the last twelve years of data collection (by, I remind you, your favoured satellite method) saying it is ‘too short’ and you are equally willing to mistrust any data before 1950. This means you are limiting your window of ‘good data’ to a relatively small period between 1950 and 1998. I would like to point out that the anomaly trend since 1979 by HadCrut actually matches quite well with UAH/RSS so maybe you could see your way to trusting the data before 1950. All data is adjusted – from every source. We have to rely on the integrity of those who make the adjustments. Bias could just as easily be introduced by, for example, GISS removing many of the station that were not showing much warming and widening the influence of stations near the edge of the arctic. Hypothetically, of course.
Your limiting of the ‘acceptable window’ also means, of course, that any data which has previously been thought to be accurate must now be more closely looked at. For example, the MBH98 graph chose to – curiously – compare one type of data from 1850 with a different type of data from before 1850. They concluded that the global temperature was, in 1998, in a period of ‘rapid and accelerating’ rise leading to potentially catastrophic climate change. Your window of 1950-1998 may agree with that, which may give you an idea that the cAGW theory may be correct. As a scientist, do you believe that a 48-year period is enough to warrant the hype that has surrounded this issue? Especially in the knowledge that, notwithstanding the fact you consider the last 12 years to be too short a period, the temperature has stubbornly refused to follow the 48-year trend?
As for your links, providing a link to a random graph isn’t really evidence without some idea of the source. I understand the graphs. I understand and agree with you regarding bias. I would still like to know the source of those graphs.
I would also like to confirm to you and SteveF that I have not, nor am ever likely to, indulge in ad-hominem attacks. You appear to imply that I either have or intend to. Nothing is further from the truth. I totally respect your right to hold a different – even opposing – view to mine. I understand you are both scientists and, as such, you should stick to using science to convince me you are right. As a non-scientist (but someone who is fairly well versed in general science), I tend to rely on logic and common sense.
I feel that you are speculating on the future based on an assumption that the cAGW theory is correct. To me, science should be able to either validate or falsify such a theory. The available and official data does not appear to validate it so far…
Regards and season’s greetings.
AB
ivp0 (Comment#64055)
ivp0, you make some interesting and valid points. I wonder if you’d consider this question on CO2 for me – I’ve had little luck getting a sensible answer elsewhere:
According to various sources (realclimate, K&T 97, wikipedia quoting such), CO2 is apparently responsible for 9-26% of the greenhouse effect. 20% seems to be favoured.
If that is true, then back in 1850 the contribution made by CO2 at 280 ppmv equated to 6.4 deg C (20% of the appx GE of 32 C). Currently, 20% of 33 deg C (an approximate GE) is 6.6 Deg C. Yet CO2 has been increased by appx 40% since 1850, and is now 390 ppmv. In real terms, the 40% increase has caused a rise of 0.8 deg C if you assume that ALL the warming is due to CO2. As far as I am aware, even the IPCC doesn’t say that…
How can a 40% increase of something which contributed 6.4 C to the greenhouse effect, only lead to it contributing 6.6 C?
So far, most of the answers revolve around ‘oh, it’s due to the log effect and feedbacks’ but the data does not support either argument without invoking other assumptions.
I appreciate your time.
AB
Hoi Polloi (Comment#64058)
Hoi Polloi,
Well said. I have had to live with Met Office forecasts every working day for over thirty years. Although I acknowledge that they have a very difficult task, showing a little more humility and less hubris would probably pay off for them in the long run.
At higher levels, they appear (IMO) to be guilty of the most ridiculous ‘groupthink’ mentality based on an unmitigated belief in the veracity of the cAGW theory.
My all time favourite evidence of this?
http://www.independent.co.uk/environment/snowfalls-are-now-just-a-thing-of-the-past-724017.html
Dr David Viner, in 2000, quoting “Children just aren’t going to know what snow is…” And “According to Dr David Viner, a senior research scientist at the climatic research unit (CRU) of the University of East Anglia,within a few years winter snowfall will become “a very rare and exciting event”.
Well, that one is still biting him in the a**! Apparently the Met Office no longer wishes to make long term forecasts!
Bugs how is it absurd? An empty oil well suddenly fills up with more oil several years after drilling stops. Could be that more oil was produced inside the earth.
Dewitt, could you expound on why dinosaurs and ferns have nothing to do with petroleum? This is a very fascinating issue to me and I would like your opinion on the matter. I think you generalized too much in the earlier post.
Also, does anyone know how realclimate works? I keep trying to post comments and they never appear. You would think a website that prides itself in expert opinions would allow an experienced doctoral opinion from the likes of myself.
“Children just aren’t going to know what snow is…â€
LOL sort of like the “drought” we are experiencing in California right now…not!
“Children just aren’t going to know what snow is…â€
Liza,
Adults aren’t going to know what snow is, either. It’ll be covering their lawns and they’ll be sitting inside looking at graphs on blogs that tell them how much Warmer!â„¢ it is. Yes, *In The Future* people will be that stupid.
Andrew
Andrew_KY (Comment#64074) December 21st, 2010 at 9:10 am
Hee hee. I like the trademark. 😉 I personally hope the scientists at the CRU are freezing their ________s (fill in the blank at your desire) off!
Arfur Bryant (Comment#64068)
Arfur,
I am not an expert in atmospheric science so I am probably not much help here. There have been some recent discussions at Climate Etc. lately regarding this question with good references free from a paywall that are worth a read.
As I understand it, we don’t really know with any certainty. Quantifying CO2s role in recent warming requires several broad assumptions which may or may not be valid. We can say with certainty that GHGs cause warming and increasing GHGs must increase warming. Clearly defining the role of manmade atmospheric CO2 in a way that can be tested, measured, and observed is beyond our understanding at this point.
Arfur Bryant (Comment#64069) December 21st, 2010 at 6:41 am
My all time favourite evidence of this?
http://www.independent.co.uk/e…..24017.html
Dr David Viner, in 2000, quoting “Children just aren’t going to know what snow is…†And “According to Dr David Viner, a senior research scientist at the climatic research unit (CRU) of the University of East Anglia,within a few years winter snowfall will become “a very rare and exciting eventâ€.
Like almost everyone else who regularly trots this out you omit the rest of the quotation which has certainly been realized this year.
“Heavy snow will return occasionally, says Dr Viner, but when it does we will be unprepared. “We’re really going to get caught out. Snow will probably cause chaos in 20 years time,” he said.”
He was a little conservative in his estimate but was completely right, the years of little snowfall lured people into a state of complacency and they have been caught out.
Dr. Shooshmon, phd. (Comment#64071) December 21st, 2010 at 8:42 am
Also, does anyone know how realclimate works? I keep trying to post comments and they never appear. You would think a website that prides itself in expert opinions would allow an experienced doctoral opinion from the likes of myself.
Given the lack of any relevant expertise that you’ve exhibited on here I’m not surprised.
So Phil, Dr. Viner, “climate scientist” says in the year 2000, in a few years kids won’t know what snow is… it will become “a very rare and exciting eventâ€. except occasionally when it’s not like last year, the year before…etc etc and now.
Yep AGW causes the earth to warm except when it doesn’t. Sound theory you’ve all got there. LOL
UK covered in snow:
Jan 2010:
http://news.bbc.co.uk/2/hi/in_depth/8447023.stm
Dec 2010:
http://www.universetoday.com/81620/satellite-images-show-dueling-snowstorms-in-the-us-and-uk/
Feb 2009″:
http://www.astroengine.com/2009/02/satellite-view-of-uk-snow-storms/
etc etc etc
“We’re really going to get caught out. Snow will probably cause chaos in 20 years time,†he said.â€
Yes, the people who get caught out will be the people who believe what HE SAYS.
“a very rare and exciting event”
What did I say before about stupid?
Andrew
Re: Dr. Shooshmon, phd. (Dec 21 08:34),
The formation section in the Wikipedia article on Petroleum accurately summarizes current thinking. For a more detailed version you could try one of Deffeyes’ books. Chapter 2 in Beyond Oil goes into more detail. Prehistoric zooplankton and algae deposits in an anoxic bottom layer which is then covered with silt. Think of a river delta, for example. If the deposit is moved deep enough but not too deep below the surface, petroleum is formed. Oil shale is half way to petroleum. Too deep and it all cracks to methane. Even deeper and you get graphite. A vanadium porphyrin complex found in petroleum looks a whole lot like chlorophyll a. There are lots of other biological markers as well. No ferns, no dinosaurs. Ferns make coal. Dinosaurs just rotted away.
Carbonate reduction, while barely possible, is unlikely to generate large recoverable deposits in a relatively permeable layer. Traces of methane with 13C/12C ratio suggesting an inorganic origin have been found in hard rock mines. Traces.
STARTLING NEWS # 3
So I think I’ve found the weather event Heidi Cullen claims to be a 1 in a thousand year occurence. I think she was referring to the Russian heatwave. How in the hell is a 1 in a thousand year event? Phil, this is the question I have been asking on realclimate. Given the silence and censoring of my comments, I would say the lack of expertise rests with realclimate for not being able to answer a simple question. How about you? Is the Russian heatwave a 1 in a thousand year event?
Re: DeWitt Payne (Dec 21 10:54),
“Refilling” of a reservoir is explained by the permeability of layers where oil is present. It’s like overpumping a water well. Most oil isn’t found in large pools. It’s in permeable layers. The rate of removal is limited by the rate of permeation. Pump too fast and it runs out. Stop pumping and you may get slow recovery. Some of the early fields had very low recovery rates because they were over pumped. Those fields are good candidates for secondary and tertiary recovery techniques like water flooding and CO2 pressurization. CO2 under high pressure is a good non polar solvent, which is what you need for oil. The CO2 dissolves in and lowers the viscosity of petroleum improving recovery. High pressure near the injection well also helps move the petroleum towards the recovery well.
O HO HO HO I haves a plan! Here is a comment from some crackpot named Tamino over at Realclimate.
166.This summer’s heat wave in Russia is a *vastly* more unusual event (statistically speaking) than the cold December in Europe. No contest — early December in Europe is highly unusual, the Russian heat wave was total freakazoid. Also, some of the claims going around how extreme the current European cold wave is (apparently originating with Thomas Globig, a TV weatherman) are just plain wrong.
But July heat in Russia doesn’t follow the normal distribution, so it’s not valid to treat it as such. I estimate it as only a 1-in-260-years event given present average temperature for that region (see this). But present average temperature is considerably higher than it used to be. If not for the last century’s warming, the heat wave would indeed have been a 1-in-1000-years (or even more rare) event.
In fact that’s rather the point: global warming makes such rare events not so rare after all. And as temperatures continue to rise, such events will happen even more frequently.
Sadly, I think the only way to get the idiots at Realclimate to respond is to copy and paste the crackpot statements they make and bring them here so they can be ridiculed. I think you can’t give a probability for an event like this with no basis. Tamino my fat friend, do you have a historical record of global wildfires? Yeah, thats what I thought. Second, you would think from reading all of the propaganda at that website that forest fires are inherently bad. BONKKK! WRONG! The only way Redwood trees can reproduce is through forest fires. They need fires to open the spores Redwoods produce so the seed can get out.
“Present average temperature is higher considerably higher than it used to be” -I would bet this is probably false, I think he just made that up out of thin air.
He then goes on to discuss rare events, I’m sorry but any discussion of weather severely damages global warming credibility. After all, the earth has had much more severe weather storms in past history.
Another fine clown
agree, but I have not read that cold winters are supporting evidence of AGW; what I have read are detailed analyses of specific cold winters (such as what is happening now, and some aspects of the last NH winter) where the complete mechanism is supportive of AGW
You do realize these “cold†winters aren’t all that cold, historically?
Unlike the unprecedented heat wave in Russia this year?
Snow in Europe isn’t exactly thought to be uncommon, dudes
hahahahaha, ok ok ok. Let me get this straight. “Well, these snows aren’t that cold historically”.
Kind of like co2 levels, temperature aren’t that high historically? Wow, egg all over the face.
Well at least now we know that any weather event is to be taken as a serious indicator of global warming but a cold and snowy winter is to be compared to historical winters. What a brilliant double standard. Lucia, I think its time you took out the big red pen and went to work on these distortions.
And the hits keep coming.
81.#75 (dhogaza): Absolutely true that snow in Europe isn’t unusual, but the thing is that these very cold winters are following a string of approx. 20 winters that were mostly extremely mild. These mild winters made lots of folks suspect that something was indeed wrong. However, now that populated areas are freezing, everything seems to be fine again (to the uninformed). The professional disinformers probably can’t believe their luck, and are using the cold weather for all that it is worth. The MSM laps it up: cold weather in the winter is front page news, while the warmest global average temperature on record is barely mentioned.
And guess what doghead, your 20 mild winters was probably preceeded by 20 bad ones, you freaking idiot. Lucia, in your opinion will this year have the highest GAT? I’m sure you know I think it is bogus but I would like your opinion. Of course it would make sense when you have cheats like the MET office averaging the highest 15 days between October and March (they picked pretty much all November days). I am dumbfounded that nobody finds this to be a very dubious and biased technique.
Doghead I know this doesn’t mean anything to you but I always like to point out that the “record” your referring to is totally insignificant, considering how long the earth has been in existence.
You mean for real? And over what time period?
It’s appears it will be close to the highest global average temperature over the thermometer record. Whether it’s the highest is not certain. Some metrics are just edging out their records, others aren’t. So, it will be impossible to say whether it’s the highest for certain.
But the fact is, owing to uncertainty, we can’t ever quite know which year is the hottest. What is happening is the candidates for hottest years are consistently in the group of most recent El Nino years.
Dr. Shooshmon, phd. (Comment#64091) December 21st, 2010 at 12:46 pm
Of course it would make sense when you have cheats like the MET office averaging the highest 15 days between October and March (they picked pretty much all November days). I am dumbfounded that nobody finds this to be a very dubious and biased technique.
I’m amazed that you’re so naive to believe that nonsense, then again it does fit with some of your other utterances on here.
ivp0 (Comment#64076)
ivp0,
Fair enough. Thanks for considering it. 🙂
AB
ivp0 (Comment#64076)
ivp0,
Fair enough. Thanks for considering it. 🙂
AB
Phil. (Comment#64077)
Phil,
[Like almost everyone else who regularly trots this out you omit the rest of the quotation which has certainly been realized this year.
“Heavy snow will return occasionally, says Dr Viner, but when it does we will be unprepared. “We’re really going to get caught out. Snow will probably cause chaos in 20 years time,†he said.â€
He was a little conservative in his estimate but was completely right, the years of little snowfall lured people into a state of complacency and they have been caught out.]
Oh, now that’s really funny!
Snow has fallen in the UK EVERY year since he made his prediction. Some years such as 2002 and 2006 were ‘light’, but all the rest were either moderate or heavy, particularly 2009 and 2010.
It doesn’t matter how you want to defend it, it was a hopelessly inept and ultimately (and demonstrably) inaccurate statement to make, especially by someone who represents an institution whose aim is to provide accurate forecasts! And the only possible explanation can be that he wanted to ‘make a statement’. He was jumping on the cAGW bandwagon. It’s obvious. He was most certainly NOT “completely right”.
Oh, by the way, the UK is ALWAYS caught out by snow. It’s a national trait.
Hey Phil, then you call up the MET office and find out how they do it! I’ve been waiting 2 days to see the MET office issue a correction to that statement and there hasn’t been one.