In comments at climate audit Jeez explained the screening bias in cartoon form:
One aspect of the problem for people with zero math skills.
Here are six scattered chronologies in abstraction of randomness, which, if all averaged together, produce a flat line. Only two of these chronologies correlate with modern temperatures-the red circles. When those two are averaged, voila, a hockeystick magically appears.


I tweeted this, and there seem to be some interest in a cartoon version explanation of the two-sided method. In the two sided method, we pick proxies with ending with upticks and those ending with downticks.

We throw away the other ones, flip the proxies ending with downticks (to use ‘upside down’) and then average. Voila:

OK for zero math skills. But Lucia’s dealt with the same principle much better. And attached it explicitly to randomness.
But it’s the same deal. If you have patterns with no signal and average, you’ll flatline. If you select on conformity with another curve over a period, you’ll get that plus flatline.
But if there is a signal, there isn’t an equal probability that the left end will go up or down. The difference that emerges is what they’re looking for.
I saw at CA people proposing that reconstructions should be done that way. Economical! Now that would indeed deal a mortal blow to the MWP!!
Nick– Zero math skills means you don’t even know what ‘red noise’ means.
What’s “that way”?
If proxies in generally really contain a signal, you shouldn’t need screening. The signal should come out without screening.
I am having a look at the ‘selected’ proxies, from 1820 to 1890, after removing the mean and then dividing by the SD.
If Nick is correct. Then there should be some sort of correlation between the mean of the 27 detrended proxies and each of the series.
So far I can see nothing.
I lied, the 20 proxies with data in the range, not 27
Lucia,
“What’s “that wayâ€?”
Selection from randomly generated proxies.
“No. But if proxies in generally really contain a signal, you shouldn’t need screening.”
You need to screen to find what is a proxy. Billions of trees do not have a temperature signal. Some do. You have to screen somehow to find which ones they are.
Nick–
Who specifically is suggesting that someone should create a reconstruction from randomly generated series? Can you provide a link so I can read what they actually wrote.
If you are screening billions of trees to find the small fraction of trees that are temperature sensitive, you are almost certainly falling prey to the screening fallacy.
“No. But if proxies in generally really contain a signal, you shouldn’t need screening. The signal should come out without screening.”
That’s a very simplistic view on this matter – one that Mc subscribes to as well – the all or nothing approach in proxies and proxy selection. Either Tree rings respond to climate or they don’t – if they do then you have to keep them all – if they don’t then you don’t.
The problem with that philosophy is it leaves out the most important factor for the determination of what makes a good proxy a good proxy. Microclimate conditions.
All trees are not created equally – some are more temperature dependent whereas others are more precipitation dependent, soil factors play a part, growing season length, aerosols in the atmosphere, winds, you get the point…
If we were able to predict exactly which trees are very temperature dependent based on metadata then it would be fine but the truth is that it isn’t very easy to do that. You can’t just throw them all together into one cauldron and treat them like they’re all created equally and because most aren’t the most temperature dependent in a group that it means that there is no information to be had.
If you have no evidence (correlation/other diagnostic measures) that a proxy is temperature sensitive then leave it out. Yes maybe 1000 years ago it was but without proof you just can’t keep it. It’s statistically unjustifiable. As Nick Stokes says you shouldn’t include the calibration period as part of the reconstruction but that is the only part of this all that is statistically unwarranted.
An example of this is like in the following case:
You’re doing research to try to understand past temperature in a mountainous glacier range. Some glaciers are next to the coast and very dependent on precipitation, others are in deep shadows and are topographically constrained, and then there are some which are inland ice caps sitting on mountain plateaus – a setting which is known to be extremely sensitive to changes in temperature in particular.
If the ALL glacier information are proxies (or none are) approach is used then you average together and you get an absolute mess. If you use none you waste otherwise useful information. The smart approach is to understand the physical processes for why a unique proxy series is temperature sensitive and then only use ones which are. In this case we “cherry-pick” the inland ice caps. Same story as tree rings and other proxies. You pick the ones which are physically expected to be dependent, you test that they are and then you use them. Not all proxies are created equally my friend. Ultimatum style proxy selection (all or none) is just not correct.
Robert (Comment #97745)
While I agree generally with ‘not all trees are created equal’ this is why you need to provide your full data set and the reasons you rejected certain trees and kept others and show that the process wasn’t directed (either on purpose or by accident) to produce a preconvieved notion.
AndrewKennett,
That I will agree with. I think that’s ultimately the biggest issue in a lot of paleo work – spotty documentation. Maybe we can trust certain people on their decisions but it’d be nice to be able to have definite reasons. Take for example the series that D’Arrigo et al (2006) used in their paper. There is one series that they wrote a whole paper on before and that I can somewhat verify based on corroborating glacier and pollen data. I trust this series so it makes sense to think they made good in-situ decisions on which trees to include. But I shouldn’t have to go through all those lengths to have to verify this. It should be all contained in the metadata.
Lucia
“Can you provide a link “
It’s here. It was a light-hearted suggestion that random proxies would be cheaper, and my observation was in the same spirit.
Martyn’s might Difference engine.
Now this is fun. I took all proxies and made the mean 1820-1890 zero and the SD = 1. Then I took the mean and plotted mean vs proxy and threw away the poor fits. Then with the ones left, I took the mean and plotted mean vs proxy and threw away the poor fits.
I did this until I had only six proxies left. I know these have been selected to fit the temperature record between 1920-1990. Then selected by me for the correlation to themselves in the 1820-1890 time period. My guessitimate was that if thing respond to temperature, they should be alike during all timer periods. I used the same temporal window as the authors, minus 100 years.
My top picks are:-
Mt Read, Buckley’s Chance, Pink Pine South Island composite, Takapari, NI_LIBI_Composite_2 and Vostok_d18O.
I have no idea what 5 of the proxies are measuring (don’t care either), but these six correlate with each other rather well throughout their length all the way back to 1460.
What is interesting is that the 1970-1990 period, as in hide the decline, is present in the composite of these six proxies.
http://i179.photobucket.com/albums/w318/DocMartyn/gergis2012australasiaversion1.jpg
“Robert
The problem with that philosophy is it leaves out the most important factor for the determination of what makes a good proxy a good proxy. Microclimate conditions.
All trees are not created equally – some are more temperature dependent whereas others are more precipitation dependent, soil factors play a part, growing season length, aerosols in the atmosphere, winds, you get the point…
If we were able to predict exactly which trees are very temperature dependent based on metadata then it would be fine but the truth is that it isn’t very easy to do that.”
A tree is a biological entity, it share one thing in common with all living things; each of its ancestors had at least one breeding offspring. A tree, like all the biotic has the character it has because of evolutionary selection pressure. Evolutionary selection pressures come in many forms, but there is one universal truth; there is more evolutionary selection pressure within a species than outside the species. This makes perfect sense; all members of a species have evolved to colonize a particular niche, space in the niche is limited, and therefore the number of individuals filling the niche is limited.
Let us take two trees; one is a thermometer and its growth is linear with temperature Tree(Therm) and a second which is temperature optimized so as to have its maximum growth rate at the AVERAGE temperature in the niche and whose growth is Gaussian with respect to temperature; Tree(TO).
Now take the two trees and allow them to grow in a field where the temperature is normally distributed around the mean.
Which of the two trees will grow the fastest, Tree(Therm) who grows fastest when the temperature is greater than the average or Tree(TO) who grows the fastest at the mean temperature?
There is of course an obvious answer. The answer is so self evidently correct that biologists trying to understand evolution generally reverse the question.
Robert, you are a classically trained idiot. Why don’t you read about what biological system are, before launching into ‘Microclimatic’ conditions arguments.
Nick–
Ok. So you meant they suggested it as a joke. The way you wrote it I thought you meant someone was serious.
This is so similar to the way Rhine got positive results with ESP. He kept selecting those subjects that scored positively and removing those that didn’t. Obviously, those that scored positively must have ESP. Couldn’t be just chance. Strangely enough, some of his positive subjects would “lose” their ability after a time. So he even had the equivalent of the “Divergence Problem”!
Rejecting trees that are not “treemometers” is the equivalent. If you can’t reject on some other criteria besides them not having responded in the calibration period you’re just following in Rhine’s naive footsteps.
“Robert, you are a classically trained idiot. Why don’t you read about what biological system are, before launching into ‘Microclimatic’ conditions arguments.”
You’ve honestly proven nothing with your little tirade – in fact I think your answer is more convoluted rant than anything with real relevance to what I said. I am perfectly right with my microclimate commentary nowmatter how hard you try to blur my statements. There are trees that are sensitive to temperature and others which are dominated by other factors. If you pick out trees which are sensitive to temperature (must be done more than just based on correlation, must be physically constrained) then they are useful as a proxy. Just like every other proxy. Combining glacial histories of a glacier which is coastal and controlled by precipitation with those of inland ice caps that are strongly associated with temperature is wrong for reconstructing past temperature. If you have a good reason to exclude trees (for example showing no sensitivity to temperature during a known temperature period) then there is nothing wrong with that. Why use useless proxies. As long as you have strong in situ physical knowledge of why a proxy is sensitive to temperature there is nothing wrong with that approach. Only use good proxies, ones that you know are physically constrained – how can you possibly disagree with that.
Robert
Absolute nonesense.
If you really know how microclimate affects things and can actually successfully predict this before you take the cores, you can use your prediction that a set will be temperature dependent to screen.
If people can identify before taking cores from a region which regions have microclimates that result temperature sensitive trees, they should be able to design an experiment where they do the following:
1) Say in advance where they are going to draw brand new cores from brand new regions to be used to create a new reconstruction. Write the regions down on paper– and announce they plan to use cores from those regions.
2) Go get a specific number of cores from each of those regions. (If they planned 5, get 5 and so on.)
3) Analyze the all cores they planned to use to the ring information.
4) Apply their method using all cores without eliminating any using mathemagical ‘screening’.
The only excuse for not using certain cores should be something like the got a flat tire and couldn’t take those– or something similar.
This method does not involve the screening fallacy because in this case, the scientists would really have used their understanding of microclimate to pick trees that were temperature sensitive and would make the selection before selecting regions from which to take cores and before obtaining the cores.
It’s much more difficult to do– but time, expense and trouble is sometimes required to do certain studies right. ( After all, we do build big accelerators or observatories and so on.)
The screening fallicy arises when they have access to a pre-existing library of cores, sift through those, find a small fraction that are supposedly temperature dependent and then use the cores decreed “temperature dependent” because those were the ones that passed the screen is the type of screening that results in the screening fallacy.
If trees are really sensitive to temperature because of microclimate, and you can know it in advance, you do not need to screen cores you collected to “pick” from the batch.
Re: Robert (Jun 14 18:17),
But you don’t need to predict exactly which trees are temperature dependent if you have objective criteria that increase the percentage of trees that appear to be temperature dependent well above the noise floor of a randomly selected set of trees. Then further screening based on sensitivity might make sense. But surely that has already been done? Re-sampling of trees that tested to be sensitive after a decade or two wouldn’t hurt either. That’s fundamental QA/QC.
Lucia:
They (some of them anyway) think they can pick trees in advance that exhibit temperature limited growth (e.g. trees in tree lines on mountains and at high latitudes). Ljungqvist for examples prescreens his tree-ring proxies, I’m too tired to dig up the details right now.
So yes it’s not necessarily screen them, but you could select a group of trees that share a microclimate that you hypothesize is temperature limited, then e.g. use cross-correlation as a verification statistic.
(They don’t do this AFAIK.)
“The screening fallicy arises when they have access to a pre-existing library of cores, sift through those, find a small fraction that are supposedly temperature dependent and then use the cores decreed “temperature dependent†because those were the ones that passed the screen is the type of screening that results in the screening fallacy.”
I agree – I do not advocate that approach. However the approach taken by some in the tree ring community (Rob Wilson for one) is very rigorous and they do look at areas they predict are temperature sensitive and they do have some success with that. I don’t agree with taking 1000 tree rings – screening for correlation then accepting those which meet the criteria into a reconstruction – I believe that to be wrong in fact (there is some debate on this). However I do think that careful selection of locations based upon microclimate conditions and then using enough cores to be able to get an idea of the regional signal is a useful methodology. Using RCS for the tree ring composite has shown to be very good with low-frequency signal preservation as well.
Those who take this approach include D’Arrigo et al who in fact were involved in much of the sampling done for development of the regional chronologies combined into her STD and RCS NH reconstructions. Of course there are issues in that they did not give access to the other sites that they didn’t include in their analysis – and that some of the series one might have some issues with – but the fundamental approach of picking temperature sensitive sites and using in situ knowledge in essence works. It also produces results that I believe are more reflective of actual temperature changes than what I call purely statistical recons (selecting purely based on correlation etc).
If you screen proxies for conformity to a certain shape, then simple probability says that unless the screening shape is completely implausible, by screening enough potential proxies you are virtually certain to find some that pass the screening.
In order for screening to have any value, the screening criteria need to be separate from the result you are trying to demonstrate. For example, you might screen by species, by age, by longitude, by any physical or geographical criteria, and still reasonably claim the results prove something. However screening by how well the proxy matches the result you are trying to demonstrate pretty well invalidates any results.
Michael J:
No. Completely implausible works too
Here are two ways of thinking about a problem like constructing a paleoclimate history:
* “What’s the best way to go about solving this problem?”
* “How would I be able to tell if I came up with an incorrect solution to this problem?”
The two seem similar.
Actually, the first exhibits a can-do and optimistic spirit, while the second almost concedes failure at the outset. I’ll choose #1!
But appearances can be deceptive. Implicit in #1 is the assumption that the problem can be solved, as it is being defined, with the tools at hand. #1 leaves us unable to distinguish a correct solution from an incorrect one.
The power of positive thinking is what led to haruspicy‘s success in diagnosing illness, and it lay behind the remarkable ability of phrenology to explain human personality on the basis of the external features of the skull.
[ NB: in real life, haruspexes and phrenologists were unwilling and unable to consider the critical null hypotheses in their respective areas of expertise.]
One important use of statistics is as a tool to evaluate the prospects that a given solution to a problem is likely a correct solution to a problem. Unfortunately, statistical calculations can be performed, even in the absence of the conditions needed for validation of the tests being applied.
One subtle but important concept that has been discussed in recent posts at Climate Audit is “prospective analysis,” where the conditions to be studied are specified prior to the undertaking of the work itself. This contrasts with post hoc analysis, where data is evaluated after it’s been collected, examined, and categorized.
The problem doesn’t arise with post hoc analysis per se, but with the difficulty that many scientists in certain fields have in recognizing that they are engaging in this sort of activity. Accordingly, such people find nothing wrong in applying tests suited only to prospective analyses, to their own projects.
For contrast, I recently read an FDA staff report on the pivotal trial concluded last year for an innovative heart valve, which was released on 6/11/12. The staff conducted careful post hoc analysis of the data set that this large and complex clinical trial yielded. But it would have been completely unacceptable to have used prospective-analysis tools to dissect these results, rather than limiting such methods to the trial’s predefined endpoints — this was taken for granted by all parties involved. (I’ll dig out the link to the 50-page PDF, if anyone’s interested.)
Many paleoclimatologists seem to be exceptionally weak in their understanding of this concept. (A similar weakness is illustrated by some of the seemingly-plausible but erroneous arguments that have been offered upthread.) The field is sclerotic, and surely would benefit from the fresh insights that would come from interdisciplinary collaborations with people who grapple with statistical problems on a daily basis in their own work.
Re: Carrick #97769
> Completely implausible works too.
Yeah, now that you mention it, I can think of
fourtwo like that, as well…Robert says: “some are more temperature dependent whereas others are more precipitation dependent, soil factors play a part, growing season length, aerosols in the atmosphere, winds, you get the point… ”
Well now that we know this, why don’t we screen all the proxies along these individual criteria, run the prescribed methods, and voila – we can demonstrate the complete weather patterns back 1000 years. Why stop at temperature? Was it more windy in the 1430’s than today?
The selection method reminds me of the definition of hardcore pornography rendered by U.S. Supreme Court jurist Potter Stewart: “I know it when I see it”.
Carrick:
There isn’t much information given about how Ljungqvist selected which data to use, at least, not in the 2010 paper. The paper says tree ring data from certain areas wasn’t used because of concerns about droughts affecting the data, but that’s about all it says.
Robert, what grounds do you have for believing that these peculiar “microclimate conditions” (which supposedly makes certain stands of trees uniquely sensitive to temperature while other apparently identical stands of trees near by are not) have any stability over time? Even if it were true that some trees were uniquely temperature sensitive, why should different trees growing in the roughly the same place hundreds of years ago have the same property, when other trees growing in very similar places now apparently don’t?
Awwww Shucks Lucia (Blush).
Oh Nick, quoting you:
This is what is colloquially known as The Hockey Stick. The methods you defend produce Hockey Sticks out of “patterns with no signal and average”. Whether or not there is a Hockey Stick in the data may only be determined with methods which do not generate Hockey Sticks from random data. How hard is it to understand this?
And is Fredrik Charpentier Ljungqvist related to Ida Ljungqvist? That would be awesome.
Lucia,
“The screening fallicy arises when they have access to a pre-existing library of cores, sift through those, find a small fraction that are supposedly temperature dependent and then use the cores decreed “temperature dependent†because those were the ones that passed the screen is the type of screening that results in the screening fallacy.”
I wish you, or someone, would say what the “screening fallacy” (SF) actually is. And exactly what harm it might do here.
There are all sorts of screening issues that arise when you are trying to use samples to determine population statistics. That seem to be what a lot of critics have in mind. In that case the SF is just bad sampling.
But that isn’t what happens here. It’s not sampling to get population statistics. The cores (“core” is a proxy for “proxy”) that pass the screen are those you can actually calibrate (in the simpler methods where that is done directly). The correlation with temperature of that core is a property of the tree. It exists regardless of what other trees do. And if you can’t calibrate, you can’t use.
And it’s usually quite a large fraction that pass. In Gergis’ case (not cores) it was 27 out of 62. Now it’s true that if you search a very large space you may need to review the significance test level. Though that depends on how bad it is to get a few insensitive trees selected by chance. But in Gergis’ case a lot of the t-values were hlarge enough to pass any conceivable test.
“If proxies in generally really contain a signal, you shouldn’t need screening. The signal should come out without screening.”
Take again those billions of trees. In fact most of them are temperature sensitive. But they are sensitive to all sorts of other things that are varying, which appear as noise, so overa century or so you can’t detedt the signal. But for a few, temperature is dominant.
So how do you find them? Start by going to the right (inconvenient) part of the world. That’s a selection step. Then look for the right sort of trees in the right place. All these are selection steps. Screening. And there’s no way the signal would come out without it.
lucia (Comment #97764) – Even this approach if followed precisely wouldn’t work.
If you select proxies using Roberts criteria of microclimate and this really does provide a good proxy set, and it really does match the recent temperature record, then all you’ve shown is that these tree respond to this known microclimate.
But then try and extrapolate backwards in time, and you can only get reliable results if you already know the historical microclimate! If the historical climate that you are trying to determine was different, then by definition this proxy set will not work!.
It may be that historically on the same site the trees were constrained by water or some other nutrient – you can only get a historical temperature reading from this proxy set by ignoring Liebigs Law.
There’s a moral in Carrick’s plot. As I understand, he’s subselecting Mann’s proxies for a notional instrumental quite different to a HS blade. Two sine periods. And a relatively small number pass the test (9.5%), because it’s unlike real temp. In fact, it’s not many more than would pass 95% by chance. But of course they do track the red curve. They have to.
But as I’ve said, with proxies you don’t look at the blade, look at the shaft. You can’t expect the scale to be right. but the shape is pretty good back to 800 or so. Before that it rises too much, but there are likely very few proxies in that 9.5% that go back that far.
So, selected to a totally different criterion, and with a different blade. But the shaft shape, which is indifferent to the selection, endures.
Nick
I think people have Nick. You just aren’t listening.
This is the screening fallacy. The cores that pass the screen may be tempearture sensitive, or they may have passed because their “noise” happens to match the screen. You can’t tell which– and as a result in the end, you don’t know what your results mean.
The fact that you don’t recognize it’s a fallacy doesn’t magically turn it into “not a fallacy”.
Nick Stokes —
As is typical in these matters, it’s difficult to tell when you are making straightforward arguments, and when you are channeling Monty Python’s “Argument Clinic” (amusing video clips on YouTube).
In this thread, there have been descriptions of two possible strategies for compiling collections of tree-ring proxies for paleoclimate reconstruction.
(A) Lucia and others present a strategy by which investigator A finds a likely stand in a suitable location (e.g. treeline bristlecones in the Sierras, larches in Siberia). She then cores trees and analyzes them (tree-ring width, heartwood density, other favorite measurement), possibly constructing composite series from overlapping cores. These candidate cores/series are then correlated to a selected historical temperature record (local, or gridcell, or teleconnected, with or without a multi-part screening/validation step). Those cores that pass the screening step are then considered to be the relevant data set. This data set is used to reconstruct paleotemperature.
(B) Robert has discussed a strategy by which investigator B identifies likely stands in a suitable location. She then evaluates the microclimates of those stands, and of the trees in those stands, in order to select those trees which are likely to contribute cores with temperature/paleotemperature information. She then cores the selected trees and analyzes them (tree-ring width, heartwood density, other favorite measurement), possibly constructing composite series from overlapping cores. These cores/series are then considered to be the relevant data set. This data set is used to reconstruct paleotemperature. In order to evaluate the characteristics of the reconstruction, the recent part of proxy-derived paleotemperature trace is correlated to a selected historical temperature record (local, or gridcell, or teleconnected).
1) – As far as I know, all tree-ring-based approaches to the construction of paleotemperature series are variations of Procedure A. To date, none have used Procedure B. Do you agree? Can you point to implementations of Procedure B in this field?
2) – The “Screening Fallacy” refers to Procedure A, not to Procedure B. It may be that Procedure A is the only method that is practical in terms of time, effort, or affordability. Those considerations don’t alter the key characteristics of Procedure A, in terms whether it is an instance of post hoc analysis. For clinical trials, “It’s the best anyone could do!” isn’t a justification for wrongly applying statistical tests. Neither should it be for paleotemperature reconstructions.
Alas, I already have a premonition that defenders of the paleoclimate-recon status quo won’t be willing and able to discuss these issues in a logical, evidence-based fashion. 🙁
“I think people have Nick. You just aren’t listening.”
Where? Can you point to a statement here or at CA of what it is and what are its consequences? Not a cartoon.
steveta_uk
Sure. But that’s a different problem. Not every possible problem is “the screening fallacy”.
Nick–
To avoid the screening problem, she should have used all 62 trees. If even trees that are preselected based on microclimate alone aren’t sensitive enough to pull out a temperature without screening for temperature, then you can’t use trees. That might be disappointing, but well… some people may be disappointed pigs can’t fly. Well, they can’t.
Amac,
I think the CPS and EIV methods are different again. But let’s go with A. Where’s the fallacy?
Lucia,
“The fact that you don’t recognize it’s a fallacy doesn’t magically turn it into “not a fallacyâ€.”
It isn’t just me. As I’ve been pointing out at CA, it isn’t just climate scientists either. The NRC North report had a distinguished statistician on its panel, Prof Bloomfield of NC State. It had an even better known prof, Brillinger of Stanford, as reviewer. There is a chapter 9 on stat methods. They say:
“The standard proxy reconstructions based on linear regression are generally reasonable statistical methods for estimating past temperatures but may be associated with substantial uncertainty”
Now I don’t think they are the sort of people who couldn’t recognise a selection fallacy.
Incidentally, I googled SF. All the top responses were from the CA post or its descendants. I couldn’t see any evidence of general usage.
“It isn’t just me. As I’ve been pointing out at CA, it isn’t just climate scientists either. The NRC North report had a distinguished statistician on its panel, Prof Bloomfield of NC State. It had an even better known prof, Brillinger of Stanford, as reviewer.”
Nick, you’ve gone from the Screening Fallacy to the Appeal to Authority Fallacy. 😉
Andrew
“Nick, you’ve gone from the Screening Fallacy to the Appeal to Authority Fallacy.
Andrew”
It’s a fallacy if they aren’t authorities. Eg, using god or the bible as an authority would constitute the appeal to authority fallacy.
The screening fallacy is a fallacy in itself. All the University exams are selecting are the people lucky enough to write the correct words on a paper, they don’t actually have any talent.
“It’s a fallacy if they aren’t authorities.”
In other words, it’s a fallacy all the time, unless you can produce some evidence they know what they are talking about. like right now. 😉
Andrew
Nick Stokes —
> Where’s the fallacy [in procedure A of #97787]?
The fallacy lies in the notion that statistical tests that are valid for prospective analyses but not for post hoc analyses can be used for post hoc analysis.
It’s jarring that this is understood and accepted by all parties in other fields of science — my earlier example was high-stakes clinical trials — but rejected by practitioners of paleoclimate reconstructions.
Somebody isn’t looking at this the right way. Who? Climatologists, or everybody else?
Nick (97783),
I hesitate to wade into proxies… so just one comment.
.
I appreciate what you are saying about how pre-selected red noise should lead to a flat stick, at least if there are enough proxies used. And I note that Mann 98 generated, well, an almost perfectly flat stick. What I see as the problem is that a highly suspect result like that (no MWP!) almost instantly became the icon of global warming. The evidence for a MWP, followed by a much colder LIA, from other sources, including written historical accounts like harvest dates and frost dates, was long established via many (hundreds?) of publications, and even noted in the first IPCC report. What I think was missing (and still seems missing in much of climate science) is the normal scientific reaction to a result like Mann 98: “Holy sh*t, that can’t possibly be right!”. Instead it went front and center in the IPCC report, and “See, proof that recent warming is large, dangerous, and unprecedented! We have to stop burning fossil fuels now!” was blared in headlines from London to Sydney, and everywhere in between.
.
In fairness to the proxy gurus, there seems to have been real technical progress since Mann 98, and the existence of the MWP and LIA have been largely confirmed, in at least several of the more recent poxy studies. But the damage to the credibility of climate science can’t be so easily repaired. The endless headlines of “It’s worse than we thought!”, based on very doubtful studies, continue to this day, and any research showing less than oncoming doom for mankind seems to be either ignored or discounted. Climate science needs to divorce itself from policy advocacy to repair its tarnished credibility. I know that you don’t like to discuss politics or policies, but that ignores the real problem: many climate scientists insist on using results of “the science”, even when there is good reason to doubt those results, to advance their desired public policy. That is really bad for the credibility of climate science.
Amac,
“Somebody isn’t looking at this the right way. Who? Climatologists, or everybody else?”
Do Bloomfield and Brillinger not count among “everyone else”?
But I don’t see what a significance test for correlation has to do with any kind of hoc.
AMac (Comment #97794),
Were I a paleo reconstruction scientist, I would say “Ouch! That hurt.” 😉
.
There seems to be a lack of awareness of the corrosive effect of confirmation bias in the entire field. Most odd.
AndrewKY
“unless you can produce some evidence they know what they are talking about. like right now. “
David Brillinger?
Peter Bloomfield?
“David Brillinger?
Peter Bloomfield?”
Nick, you haven’t presented any evidence of these people being correct about anything, least of all anything that even addresses potential fallacies. All I see is evidence that humans like to give awards and recognitions to each other.
But you knew that already. 😉
Andrew
bugs (Comment #97792)-“It’s a fallacy if they aren’t authorities.”
Wrong. It’s fallacious reasoning period. Yes, part of what makes these sorts of arguments wrong is when there is appeal to an inappropriate authority. The real problem is it’s an inductive argument, not deductive one. Which simply means that the truth of the conclusion is not guaranteed by the truth of the premises. So the fallacy is in the assertion that the conclusion, “the experts are correct” is logically necessary. One can make “weak appeals to authority” which are not necessarily fallacious if the assertion is not that the truth of the conclusion is proven by the status of authority, merely that there is a presumption that what the authority says is true.
But then, it is preferable that other reasons be given if one wants to claim that something must be true. The presumption that an authority figure is right is always overridden by fact based, deductive arguments.
Thank you SteveF for interjecting a technically-sound, Montford-readability-worthy summary of all of this in two paragraphs. I concur! The current best guess that, well there was a MWP and it may have been almost as hot or slightly hotter than today, but AFAWK it didn’t get hot quite this quickly, doesn’t make applying predictive-type screening to post-hoc analysis justifiable. I fear that the lack of awareness of confirmation bias may be endemic to earth/environmental sciences which in the past have not had to rise above a speculative, historical narrative methodology. Sure that will p* someone off!
“The presumption that an authority figure is right is always overridden by fact based, deductive arguments.”
But there are none. No-one can say what the “Screening Fallacy” is.
Can they?
If not, I think you’d better go with authority.
Nick Stokes,
Did you ever convince Tiljander she made the mistake on the upside down sediment data and that Mann is just a good scientist carrying out his daily work?
How many sharks can you jump?
Nick Stokes (Comment #97805)
You misunderstand. There is no logical requirement that, in the absence of deductive arguments, one must agree to the inductive arguments that appeal to authority. On the contrary, it merely means that the argument from authority is merely on equal footing, at best, with inductive reasoning that leads one to conclude the authority is probably wrong. Neither can be said to over ride the other. So it’s not “better go with authority” it’s a question of what inductive arguments one finds more persuasive. Subjectivity…
That being said, I am not necessarily endorsing your claim that there are no deductive, fact based arguments in this particular case. My comments are about the general nature of fallacious reasoning of this kind.
Nick, it is really simple. If the 27 selected proxies are responding to a common signal, the we can prove it, statistically.
It is stated that the signals all match a temperature signal from 1920-1990. Thus we can take the detrended data from this period and examine the distribution around the mean. This will tell us how good they are as themometers; how tightly coupled they are to a known temperature series.
Then, knowing that they are thermometers, we know that during any time period that detrended proxies will have the same distribution around the mean. We should have the same distribution around the mean for 1820-1890, 1720-1790 and for 1620-1690 as we have in 1920-1990. This is the test. Does the normalized distribution of all proxies around the mean change as one goes back in time.
I can tell you that in all 70 year periods tested so far the distribution is not the same line-shape as in the calibration period.
This discussion is running into the Twilight Zone.
.
Michael J
.
Exactly. Which is exactly what Mann&Co do. And so did Gergis, I’m told (though I’d like to confirm this).
.
The “result they are trying to demonstrate” is not whether their reconstruction matches the training data (the portion of the record they use to calibrate and/or screen proxies). What they are trying to demonstrate is that they can build a reconstruction that fits the test data better than chance, where the test data is not used in the training (calibration/screening/whatever).
.
The punchline of the paper is not the shape of the reconstruction – it’s the p-value of the match between the reconstruction and the unseen data. There is no screening fallacy or post-hoc analysis there. The test criterion is both set a priori and entirely separate from the training set – as it should be.
.
Amac:
.
Did you consider that the “jarring” might actually result from your having missed something in the papers?
.
I’m curious how you manage to reconcile your distrust of (your own understanding of) Mann’s papers, and your apparent admiration for McShane & Wyner, who didn’t raise this point that you seem to find so “jarring”. Not only that, but IIUC (big if), they use the “screeniest” of all screening method (Lasso!), and then they mangle the training set/test set separation by using test sets that are strongly influenced by the training set (N-fold cross-validation is nice, but not on successive segments of a highly auto-correlated timeseries).
.
Maybe I missed something in McS&W too.
“Nick Stokes
No-one can say what the “Screening Fallacy†is.”
A screening fallacy occurs when one treats data which has been deliberately selected as if it has been random selected.
The methodology by which one selects data has enormous statistical implications as to how one can analyze the data.
One cannot use statistical tests based on the probability distribution of random variables if one uses non-random selection criteria.
For instance, let us estimate the population of drivers who have blood alcohol that is over the legal limit.
We examine the police arrest records and find that 37% of drivers tested by police officers proved to be above the legal limit.
We can therefore conclude that more than one third of drivers are driving whilst drunk.
This Nick is what you are doing. You know, a prior, the line shape of the temperature from 1920-1990. You look for this this shape in thousands of samples, chose only those that have this shape, then by one way or another, average them.
It does not occur to you that you are doing population statistics on a non-random sample because you think you are looking at a group of signals. You have yourself said that climate scientists are not examining population statistics, but are doing signal reconstruction.
You are hammering screws into a piece of wood, because you know what a hammer is, but have never heard of a screw driver. You ignore the advice of carpenters because they have never worked with your bit of wood.
Nick:
How many times do we go here? So your objection is they aren’t using a term of art, but rather a term coined to describe how the fallacy is being applied in this area.
The underling logical fallacy is cum hoc ergo propter hoc or “correlation does not imply causation”.
The rest follows from this.
It would be nice if you could admit this statement is generally true, especially when you are applying correlation to a variable (tree-ring growth) that is known to respond in practice to an array of other stimuli in addition to temperature. (See Fig. 5, note which quantities are statistically significant.)
It seems like we go through this like on a weekly basis and you always retrench to the same wrong argument. It’s like somebody pushes your reset button and your program starts running from the beginning again.
Here’s a summary of how the “screening fallacy” applies to the “well-established statistical practices” (snort) of paleoclimatology:
1. Screening proxies: You correlate a proxy against temperature, if you find a high correlation you conclude it’s a temperature proxy. This is a fallacy because:
a) Temperature could covary with another quantity over the measurement period, resulting in spurious correlation. Since there’s no guarantee that that the correlation between temperature and the other quantity will be maintained outside of the instrument record, you may have just “gotten lucky” and found something that looks like a temperature proxy for part of the instrument record.
b) The tree-ring proxies have a lot of red-noise in them, and you could be correlating against noise.
2. Verification statistics. In this phase, after prescreening during the instrument record (the “training interval”) you apply correlation a second time to verify that your proxies are co-varying (sometimes there is a second screening that happens here… some proxies don’t track well with the other series over part of the period, so you chop out the bits where they don’t). Here there are two mistakes that get made:
a) Incorrect conclusion that your proxies passed the verification test. I don’t know what the latin phrase for “doesn’t know how to do statistics properly” is. There are many examples of this in the literature, where the series failed to pass verification tests, and the authors did “creative statistics” to get them to pass.
b) You do the statistics correctly and your proxies pass the verification test.
Here’s the rub: It’s still cum hoc ergo propter hoc, because while you can say the series have the same underlying signal (or they wouldn’t co-vary), you haven’t established that the underlying signal is temperature. (It could be a combination of temperature and other climate variables that the series covary with.)
Sorry, Lucia, but you’ve fallen into a fallacy of your own. The upward tick at the end is REAL DATA. It’s the instrumental record. The unknown is what happens before the real data begins, before the instrumental record begins. We should EXPECT the result to turn up at the recent end, because the real data does. And we should expect (in the absence of data) to have no information of the pre-data period, i.e., it should be flat.
Your procedure shows a hockey stick because there is a hockey stick in the data. That’s not a fallacy, that’s good science.
Nick’s comments here are just amazing. He has lost all the credibility points he earned with his computation of the the Gergis un-de-trended correlations. How many more times does he need it explaining to him?
If he wants yet another explanation, read Rob Wilson’s explanation in climategate email 4241.txt.
toto:
You’re telling me! And you’re the one in the twilight zone.
Like Nick you suffer from the delusion that the only way forward is to use correlation to prescreen series against temperature to establish whether they are temperature proxies or not.
[It is a delusion because it’s not necessary to just prescreen against the instrumental temperature record to deduce whether you have a temperature series.]
I have a toy example coming up. I think Nick ain’t gonna like it.
Carrick #97811:
If what you say is true, then all proxy data, in all branches of science, is fallacious. Is that really what you’re saying? Because how would it even be possible to determine if a proxy is valid, if correlation with the independent variable is disallowed?
I think there is a way around the fallacy. If you have some proxy series that you know apriori are temperature proxies using a physics-based model, then you can use boot-strapping on the other series to build a temperature series.
Given that, I think you still run the risk (and in fact incur its consequences) of including series that aren’t simple temperature proxies, like tree rings. As an example, tree-ring response to volcanos probably isn’t just temperature related.
I think my objections here are with the “mann-o-matic” algorithm, where you grab all proxies you can get your fingers on, run them through the two step process I described above and conclude that what you’ve created is a reconstruction of temperature series.
I believe you have to get your hands dirty on this stuff and understand what the proxies really mean This paper is a good example of that IMO.
If you use this tree (and his fellow) for dendro, I think the topic of this thread would be solved.
http://img.over-blog.com/333×500/0/24/62/38/photos-2008/reduit_Rouen-arbre-220608-004.jpg
An additional problem with tree ring proxies is that the noise isn’t simply red. Many of the series appear to show significant long term persistence.
KAP, maybe my other comment answered your question already, but there are several ways to move forward. I think you over-generalized my comments.
Develop a physics based model that explains why your proxy should predominantly respond to temperature. Develop a model that corrects for other variables.
Example: Mercury barometer. It responds primarily to pressure, and the calibration only depends on the density of the mercury: delta p = rho g h. However rho = rho(T) so you have to make a correction for temperature.
[And g varies with location and time of day, so in principle you have to correct for this too.]
In this case, the height of the mercury is a proxy for pressure, but it is secondarily affected by temperature.
What you can’t do is select a random quantity Q and decide it is a “true” proxy for quantity X using simply the existence of a correlation between them. That’s what people calls the “screening fallacy”. But what it involves is the presence of an uncontrolled confounding effect. This is problematic when the confounding effect is of the same order, or larger, magnitude than the effect being measured.
The field of epidemiology is filled with examples of bad research papers where people have fallen prey to this fallacy. (Again they don’t have to… they have to recognize and control for potential confounding effects in the study, for the study to be valid. Not all researchers are created equal. Unless you’re a member of the Hockey Team and therefore infallible of course)
I think I see where you’re going here: series like δ18O allowed, because the physics is understood. But what’s this “bootstrap” process, and how does it differ from correlation? How do you insure that “bootstrapping” doesn’t fall into exactly the same fallacy you’re complaining about?
phi, only if there is a coffee shop by the tree.
The field of epidemiology is also filled with examples of other scientists pointing out the exact confounding effect and its nature, when such effects are known and unaccounted for in research. Can we expect the same from dendro critics, at some point? Because if such confounding effects actually exist (rather than merely speculated to exist), they should be just as easy to find as temperature correlations.
I agree with many of the people here on some things but not on a few others – in particular the notion that lucia presented about having to keep them all (in terms of tree proxies etc). This is just wrong – i’m sorry. Tree rings respond to a variety of factors – when they make regional chronologies using the RCS and STD techniques they produce a composite which is not necessarily dependent on temperature. For example some tree ring chronologies assembled are much more strongly representative of things like ENSO and the NAO or AMO rather than being temperature proxies. That’s why it’s important to understand the main drivers and local climate conditions for the tree ring chronologies that are produced. There has to in essence be some “cherry picking” because you’re looking for the series’ which are temperature sensitive. The chronologies (particularly when using RCS) are constructed to reflect correlation between many cores as that is part of the process. Hence why RCS needs more cores than other methods.
Nevertheless if you have 26 tree ring chronologies and you have a viable way to screen for temperature then I do not see what is wrong with only using the ones that are related to local temperature. I think that forcing the all or none method is wrong. Different chronologies reflect different things. When tree ring people go out they construct chronologies based on regional signals – it is not only about reconstructing temperature.
The problem of course is being able to pick which ones are temperature sensitive. You should be able to predict it based on your knowledge of the local conditions and the regional climate drivers but statistically you would like to not only use correlations as being a means of determining this. Other measures should be first used to screen out non-temperature series – then you screen based on correlation. It is essentially about finding a way to keep out the random spurious correlations.
KAP, again maybe I’ve partly answered the question, but δ18O is a good candidate for bootstrapping. Note that it predominantly responds to temperature, but there are other effects that you correct for, just as with the mercury barometer.
The idea of bootstrapping as I’ve used the term here is to use a series that you have established on physical grounds is a temperature proxy (but the number of these proxies is limited, and they typically have poorer resolution). I know this isn’t a favored reconstruction for some people here, but Moberg (2005) sought to augment these longer “pristine” temperature proxies using tree-ring data to fill in high-frequency and missing geographical information.
If you’re calibrating the tree-ring series against a “true” temperature proxy, you’ve avoided the correlation=causation circular loop.
This gets a bit technical, but basically if you discover a relationship between a particular tree-ring series and a proxy that you “know” measures temperature, it doesn’t really matter whether the tree-ring is actually responding to temperature or not, as long as the tree-ring data is being used “in-sample” (that is over the period where the temperature records of the two proxies overlap.)
See my comments here. What you are effectively doing is using the fact that they correlate to interpolate the other series using the tree-ring data. That’s a mathematically and statistically defendable process.
Re: Nick Stokes (#97796)
> Do Bloomfield and Brillinger not count among “everyone else�
That’s a “do your own homework” quip, nonresponsive to the issues under consideration.
> But I don’t see what a significance test for correlation has to do with any kind of hoc.
I agree.
Your view is widely shared in the paleo corner of the climatology specialty. Bug or feature?
KAP (Comment #97817)
“If what you say is true, then all proxy data, in all branches of science, is fallacious.”
What? No, that is not true at all. It is true that most everything in science that is measured is a only a proxy for the reality being measured (the expansion of mercury in a thermometer a proxy for the kinetic energy of the atoms/molecules in the substance being measured). But the difference is that in normal science there is a physical model (and usually one that is long studied and well understood!) which justifies the use of the proxy. In paleo-climatology, there is seldom a well defined and characterized underlying physical model (eg. trees respond to lots of things, not just temperature). It is the disconnect between the statistical treatment and a defensible physical model that is the problem. The need for pre-screening to “find” the “right” proxies (or even the right individual trees!), absent a clear protocol that was defined before the data was collected fairly wells screams that much in the field is build on quicksand. Try running the standard paleo-approach for proxy selection past the FDA in a clinical trial; they would laugh you out of the room.
KAP:
Yes in fact they often use tree-rings as precipitation proxies. Some of Mann 08/09 tree-ring proxies were originally selected as precipitation proxies≥
I’ve argued in the past tree-rings respond to climate change, not necessarily just temperature, so you could use step B above to generate a tree-ring climate index, that is a measure of “viability” of climate for trees. For connection of climate to human history, this might be a more important measure than pure temperature anyway (think of a way of assaying the impact of climate on agriculture.)
Robert:
You can use “known” temperature proxies in this way as long as you recognize that screening them is not a “statistically neutral” task.
At the minimum, applying this screening has an effect on the uncertainty of your reconstruction…because of the issues with spurious correlation…and you have to correctly account for this, or your verification statistics will be all wrong and your uncertainty boundaries understated. And the problem here is, it isn’t established whether you can really fully address the effects of this secondary screening on your reconstruction. (The fundamental problem: Decimation of a sequence by selection criteria is a nonlinear operation.)
You might be better off, in other words, with the noise floor inflation associated with not doing the secondary screening (but that doesn’t mean you shouldn’t involve correlation with temperature in the methodology, it’s just how it gets used that is the issue).
“What you are effectively doing is using the fact that they correlate to interpolate the other series using the tree-ring data. That’s a mathematically and statistically defendable process.”
I know of some trying to use pollen and tree rings together in that manner. Always wondered about how to do so. Is the code very complicated?
Nick, Toto, KAP, and to some extent Robert, you are wrong, and critics are correct. Avoiding the fallacy was worked out by biologists, and in particular botanists, decades ago. I used to help with the data gathering or reveiw assumptions for doctorial candidates at a major university.
One uses pre-SAMPLING screening criteria to porpose a hypothesis. One proposes a priori objective measurable meta data that can be documented and ascertained. One takes these to a statistician so that falsible condition(s) can be met. In particular, what IS and IS-NOT. After agreement, the statistician helps develop a sampling protocol that when done correctly will yeild a confidence interval and that the conclusion of the hypothesis can be supported. One then goes out and does the actual sampling. Even with all this, there are assumptions, usually instrinsic that require one to be most modest in one’s claims as to the mening and application, its power of explanation.
This is the problem, persons are doing pre-sampling screening as though it were sampling and drawing conclusions that cannot be supported. Worse, there are nuances of statisitcs that should have been solved prior to sampling, much less publication. This is the real flap between M&M and MBH98 in particular. M&M did NOT need to and did not propose a reconstruction; they showed a problem with the methodology. MBH98 other than being good speculative science for further research was used to draw conclusions deemed by some as concrete, that are unsupportable by the methodology. MBH98 methodology precludes this level of confidence, as do many other reconstructions.
And to Nick in particular, your blade and shaft claim about it is the shaft and not the blade that is important; and one tests the results in the training period to conclude about accuracy of the reconstruction are beyond bad. The problem is that they do compare the blade and the shaft, far too often, and conclude beyond that which can be legitemately shown; and if a proxy does poorly in the training period, it has been documented that such are thrown away, have temperature inserted in bad regions, do not let the “divergence” widen the CI’s of the modern period, or even get turned upside down to known physical relationships. All of these are contrary to making a claim that is supportable.
SteveF:
Or the methodology in your undergraduate physics thesis. You might be lucky enough to be kept in the program (not kicked out) after trying that one.
Re: toto (#97809) —
Sorry, long response eaten by browser. I will now chant “make a local copy!” while clicking my heels three times.
Let’s stipulate that I missed lots of things; that’s not the point. The issue is that climatologists defy good statistical practices. It would be one thing if paleo authors explained and defended this choice, but they don’t, opting to ignore it instead.
Again, things are different in other branches of science. I Googled “GWAS Bonferroni” and plucked a paper from high in the rankings. Here are the first two sentences of the Background.
Paleo studies fail to account for “the multitude of comparisons” represented by pre-screening candidate proxies prior to analysis. Thus, they predictably result in false positive (Type 1) errors.
.
Upthread, DocMartyn makes an interesting contribution, getting at this point from the other direction. If candidate pre-selection during the screening period is a viable approach, then — at a minimum — the selected proxies should show similar concordance prior to the historical period. This concordance should be greater than that shown by the failed candidates. In comments #99753 and 97808, DocMartyn reports that this condition is not fulfilled for Gergis 2012.
More generally, the discord demonstrated by the “spaghetti graph” can be taken as an indication that something is wrong with the paleo-recon enterprise as it is currently practiced, IMO.
AMac,
As most 2 year olds quickly figure out, reaching into a bowl of spaghetti makes a mess.
As a biologist, I third everything Doc Martyn and John F. Pittman have said.
I don’t see how it’s possible that so many are forgetting the simple statistical practice of sub-sampling and pre-sampling. I am also astounded by those trying to defend this Screening Fallacy, as they are forgetting that in statistical analysis you have to create a hypothesis and rules of data handling -before- examining the data. You cannot screen out afterwards (with limited exceptions, if you use say a Q test to justify), but that’s what pre-sampling is for, to make sure your target population is amiable to your methods. If it isn’t, you either find a new population or completely scrap your methods and start from the drawing board. But again, everything must be laid out BEFORE you even look at the data, to avoid bias and the Screening Fallacy; and you must use all the data you collect once you start unless you can -statistically- justify exclusion (again, using a Q test), which these “Screening” methods do not do (can’t just throw out data! Reality is what it is, if you throw out what you don’t like, you’re no longer observing reality). Maybe, just maybe, trees should never be used as proxies of temperature especially over long periods (decades and beyond), because their populations do not accurately measure temperature over any robust period of time? And trying to screen out trees for only those that wiggle like you want them to is not real, it’s the most classical form of bias I can even imagine.
(The Screening Fallacy is easy to define: it’s simply that you select whatever proxies agree with what you want them to agree with, and then show they are agreeing with what you selected them to agree with as somehow being independent evidence supporting what you wanted them to agree with. Classical logical failure.
At no point are you actually selecting trees that measure temperature independently. At no point are you saying something meaningful or real. Trees show the temperature in the 20th C going up! Well yes, because -you selected only the trees that do so over that period of time-; but you contain no knowledge as to -why- over that limited time they raise, nor is the assumption that the rest of the tree’s record is following temperature supported or proven by that method (where is the support that tree responses do not change with time and age, or the random weather conditions the world is constantly subject to over the period of investigation?). It’s all one gigantic delusion I’d expect only an undergraduate would be capable of making)
Nick–
We all agree that many many people have fallen prey to the screening fallacay. That you can find many people explaining precisely why screening just works
1) Does not mean screening ‘works’ (in any good way) or that
2) You don’t know what we are calling the screening fallacy.
You keep explaining the operation that is screening and explaining why it gives correct or at least not misleading answers. But the fact is, the operation introduces more problems than it solves and people who use screening routinely misunderstand which features are introduced by screening and actually highlight what are nothing more than mathematical artifacts in their results and conclusions.
Of course you can find lots of quote from people who use and defend screening explaning what’s right about it. But they are wrong. And the reason people at blogs keep explaining they are wrong is they are wrong.
Now, if you think screening “works” under some hypothetical circumstance and in some correct, not misleading way or unambiguous way, go out and create an example. Then we might know what sort of thing you think is ok and under what circumstances.
But I just posted yet another case where screening gives bad answers. And I can come up with scads.
John F. Pittman (Comment #97833)
Botanists in this case have a hypothesis to prove (or not). Paleoclimatologists don’t: there is no a priori hypothesis about past climate. The pre-sampling screen is simply that the proxy correlates to local temperature. There is no screen for what the data might or might not show in the pre-instrumental era.
And yet, when the sampling was dumped and the entire screened population was used, the conclusion didn’t change. Which should tell us that the M&M criticism, while valid, was a thin beef.
Who has ever drawn a “concrete” conclusion from MBH98? Isn’t this just a red herring?
The highlighted part is the part that can introduce the screening fallacy. If other measures work, then you should not screen afterwards. If other measures don’t work, screening is very dangerous and can lead to misleading results.
If someone wants to claim their screening using correlation works, they need to do several challenge problems to demonstrate to others that they “features” they think they are revealing are not just mathematical artifacts.
Carrick (Comment #97830)
IIUC, it’s tree-ring thickness that’s the precipitation proxy, which is why they use density as the temperature proxy, to avoid confounding effects. Perhaps a real dendro person can chime in here?
Lucia,
Is the “blade” in your posted example above a feature, or is it a mathematical artifact?
KAP repeats a silly argument people still seem to take seriously:
KAP’s argument is if you just average the data, without screening it, you still get the same results. So what? If you average a bunch of valueless data with a single series that has a strong signal, you get that signal.
The problem highlighted by Steve McIntyre, time and time again, across many reconstructions, is conclusions are drawn by giving a small amount of data an undue amount of weight. That argument has never been countered. In fact, it’s never been addressed.
Re: KAP (#97481) —
Let’s talk gene studies for a minute (see #97837 supra). Back around 2005, folks were using GWASs to explore genetic causes of diseases like Type 1 diabetes, and discovering genetic features (they’re called “SNPs”) with incredible predictive and, presumably, causal associations. P-values along the order of 1E-12 were being regularly reported. Yet, somehow, each successive study would turn up different SNPs as the key predictors of the disease in question! Since this didn’t make any sense, handwaving abounded.
The breakthrough for the analysis of GWAS’s was the realization that each of the hundreds of thousands of SNPs present on a gene chip represents its own hypothesis. Taking this vast number of hypotheses into account, those 1E-12 numbers turned into 0.2s. Mystery solved (*sigh*).
If I collect 20 candidate data series and pre-qualify them for analysis through screening against a historical temperature record, ISTM that I’m coming out of the gate with at least 20 hypotheses:
* Data series #1 is a valid proxy of temperature through the study period;
* Data series #2 is a valid proxy of temperature through the study period;
* Data series #3 is a …
The moral isn’t “never do that!“. Rather, it’s “incorporate the proper corrections into your analyses.”
Judging from the Gergis 2012 post and comments at the climate science blog run by real climate scientists, nobody’s listening.
Brandon Shollenberger (Comment #97846)
What constitutes an undue amount of weight? And what is the proper way to weight a dataset?
If calibration data are good, screening is a valid method to select the best proxies. If, cons, calibration data are bad, screening will select bad proxies, in fact, proxies which respond to a number of different parameters, so, proxies which have an evolution that could be described as random . We obtain a flat paleo section like Mann the first. And indeed, good proxies, those identifying volcanic eruptions, consistently show a discrepancy in the twentieth century and are discarded.
KAP:
Before I offer any answer to these two questions, would you please respond to the point I made in my comment? You made a claim, and I offered a clear rebuttal.
It’d be silly to move onto a new point without even trying to resolve the point which was being discussed.
Brandon, please let us address KAP’s gross misunderstanding.
KAP says “Botanists in this case have a hypothesis to prove (or not). Paleoclimatologists don’t: there is no a priori hypothesis about past climate. The pre-sampling screen is simply that the proxy correlates to local temperature. There is no screen for what the data might or might not show in the pre-instrumental era.”
KAP this shows just how much you do not understand of the science and the follow-up by Brandon about what constitutes undue weight. The hypothesis that Paleoclimatologists have MADE is that tree rings, MXD, etc are GOOD temperature proxies and are stationary enough to approximate past temperatures and draw conclusions about the quantitative, not just qualitative, differences of the present temperatures compared to past temperatures.
The screening methodology is a fallacy when you do and claim what some did. If others did different and claimed different, the criticism does not apply, but other criticisms may. Your statements have scientific and logical errors, such as paleos have no working hypothesis, and the implication there is not a way to detect logical errors, nor a way to support someone has made a claim that cannot be supported.
Brandon gave you the construct, told you who did it, told you who about the error, so you can examine whether you agreed and if not why, and you dodged it, rather than answering.
AFAICT, you are re-doing the dead parrot skit.
KAP :
IMO, the conclusion didn’t change in that case because it was a hockey-stick-o-matic.
Compare that proxy to modern ones.
You’re just seeing noise in the handle of the hockey stick. Adding or subtracting one series won’t change that.
“You can use “known†temperature proxies in this way as long as you recognize that screening them is not a “statistically neutral†task.”
yes.
Stephen said ““You can use “known†temperature proxies in this way as long as you recognize that screening them is not a “statistically neutral†task.â€
yes.”
I would agree to this also, as long as one admits that it is the person using this screening HAS to justify the methodology and conclusions. But what one cannot do is without justification to add an assumption that the phenomena is stationary at the individual or group level. Which is what is done, and has not been demonstrated, nor do I think that it can be well done. “Well” means able to support the claim that modern temperatures are unprecedented. Justification is NOT assuming it is. Justification is NOT assuming divergence is a recent anthropogenic phenomena. Justification is NOT replacing data with temperatures without determining how such changes the CI’s AND justifiying stationary through some other acceptable measure.
If they do not justify as some have done it is not science in the normal sense, but speculation. And I agree some speculation turns out to be correct. Some do not. The problem is which is right ot wrong is unknown, and may be unknowable.
Your point was:
My response is, so what? If averaging recovers the signal, as you admit, why is the procedure incorrect? Why is any procedure that recovers the signal incorrect?
The reason we use weighting is to recover more signal and less noise. Why is that incorrect?
Carrick (Comment #97858)
Very nice job, drawing a graph that deliberately suppresses MBH’s error bars. I will assume that’s just ignorance instead of deliberate dishonesty.
If you had included MBH’s error bars, you would have seen that they overlap those of Moberg.
PaulM,
Interesting email from Rob Wilson there. Not that I approve of reading people’s emails, but this one he probably wouldn’t mind. He’s basically done what Lucia did in her cherry picking post. And yes, I think he’s fallen into the “screening fallacy” fallacy. Thinking that because the selected random proxies follow the blade, that the shaft will be affected. But it isn’t; as I’ve said, in the noise case the shaft is exactly what you should expect – flatline.
The problem with peeking at emails is that you don’t know if Rob later thought better of it. Or had it explained to him in an email that didn’t turn up at UEA.
KAP:
Why would you use a process which “recovers a signal” when you already have the signal? If a single series is giving you your entire result, that single series is the signal. Averaging other series into it accomplishes nothing other than to obscure the origin of the signal. It lets you talk without admitting your entire result is dependent upon a single series.
You keep talking about recovering a signal. The problem is nothing about the approach recovers a temperature signal. It just recovers the signal from one series.
If I remember right,Steve McIntire created a hockey stick out of red noise using MBH98 methodology. This suggests a multitude of possible tests of the screening methodology. Compare the data against and inverse of the temperature record. Compare a data from a specific time frame against temperatures from a different time frame. Scramble the data for a time period and compare against temperatures for that time period. If you get comparable numbers of trees that correlate to the temperatures using these tests, then the screening method is fallacious.
The whole concept of “screening fallacy” could be resolved if there were ISO type standards for conducting research.
KAP makes an amusing statement:
Nobody knows how the error margins in MBH were calculated. They don’t match any normal approach, and Mann never disclosed it. In fact, while people like to claim Mann released his code, the truth is his code is missing parts, including the part where the error margins are calculated. Despite this, KAP demands they be included.
Incidentally, I doubt the error margins in MBH are wide enough to justify KAP’s claim.
Just because a few trees appear to be good thermometers over 50-100 year period does not make them good thermometers over several thousand years (or however old the trees live to be).
When it turns out that they are horrible thermometers for the most recent 50 years when we have the best temperature data, that should be a big red flag.
Then when you have a series of e-mails saying you need to get rid of the medieval warm period and hide the decline since 1960, you have another big, red flag.
Poor, highly politicized “research” being used to make scary stories for public consumption.
Carrick,
“The underling logical fallacy is cum hoc ergo propter hoc or “correlation does not imply causationâ€.”
No, another thing I keep saying here is that there’s no causation deduced in the model. It’s just the persistence of correlation, for whatever reason.
“Temperature could covary with another quantity over the measurement period, resulting in spurious correlation. “
Again, we don’t care. All that matters is that the correlation persists.
“The tree-ring proxies have a lot of red-noise in them, and you could be correlating against noise.”
That’s what the significance test rules out. And yes, there should be an AR(1) correction or even something fiercer. But that isn’t a selection issue.
“Verification statistics.”
In fact, as I understand, the verification is applied late and used to validate the whole recon, not the individual proxies. Soagain, not a selection issue (though even if they did use it on proxies, I can’t see a fallacy)
“you haven’t established that the underlying signal is temperature.”
Again you haven’t established that the cause is temperature, only the effect. But it doesn’t matter.
In fact, if you really want to look into causes, it’s messy anyway. Air temp? Soil temp? Frost?
Lucia,
“But the fact is, the operation introduces more problems than it solves and people who use screening routinely misunderstand which features are introduced by screening and actually highlight what are nothing more than mathematical artifacts in their results and conclusions. “
This is why I keep pressing for someone to say what the “screening fallacy” is. Define it.
Because there is some truth in this, but it’s a long way short of fallacy, as is your new example. The fact is, the operation doesn’t “introduce more problems that it solves”, it is required, at least Gergis-style. You can’t calibrate the proxies that don’t pass the screen. No introduced problem could exceed that.
But yes, people do sometimes highlight proxy results that don’t mean anything – it’s all too common. I complained about it in Gergis’ table 2, and at RC. But it’s usually harmless,because the proxy results are backed up by similar instrumental results. If they’re claiming that proxies give you extra info, well, they shouldn’t.
KAP:
Looks like I hit a nerve. Truth hurts. Ouch, sorry for you.
First of all the error bars are the “between series” errors between Moberg, Ljungqvist and Loehle, it’s not just the Moberg uncertainty you’re seeing here.
There’s no similar way to generate a “between series” error just for one series. So what you want me to display isn’t even possible, let alone ignorant or dishonest.
Secondly , all you have to look at is the central value and notice the lack of any long period coherence in the data to realize it’s garbage. By visual inspection, we chunk it, it’s that bad.
Thirdly, if you want a quantitative test of consistency, you don’t just look at overlapping error bars for a data series, you test them using e.g. the chi-square or your favorite variation on this.
You want to put down some quatloos on whether MBH is statistically consistent with the ensemble mean shown here?
Another way of looking at it is using Pearson’s r. Based on this, MBH completely sucks. The only place there’s a meaningful overlap is during the instrumentation period.
We can look at it a third way by looking at spectral content. I’ll generate that when I get a chance, so you can see for yourself MBH is red-noise like with none of the spectral characteristics expected from a real climate signal.
And what’s even more cool is the lack of internal coherency between Mann’s proxies that he screened for. The fact MBH hid this from the reviewers and for years fought attempts to get them to release their r-values, even though they themselves had calculated them is now part of the public record, it’s not deniable. Instead of saying there’s a problem here, they invoked an arcane method for verification, and blew that one too.
They also used a fallacious argument for why they didn’t use Pearson’s r. It’s because if you have a trend in two series with no noise, you’ll always get an r of one.
Yes that’s right…. spurious correlation. The same exact problem that we’re worried about here for screening the proxies against temperature.
So it’s OK to use correlation to screen proxies and accept the issues with spurious correlation, but it’s not OK to use correlation when it fails to verify. Wow!!!
If the issue is with spurious correlation, then you add other consistency tests besides correlation. What you don’t do is ignore fails to verify. That’s a huge red flag right there,
We can beat MBH into the ground here if you feel it’s necessary. (I could easily write a small book on the problems that I know about it.) Or you can admit that that this proxy reconstruction failed.
Look, Mann is to be commended for grappling with the multiproxy method–it’s the basis behind the reconstructions that actually do work–and just move on. It’s one paper, it started a group of other similarly bad papers, before the art progressed to where there’s maybe now some semblance of reliability in the methods.
Nick Stokes (Comment #97879),
Let me try this from a little different angle. For sake of argument, let’s stipulate that all is well and good with selecting trees (as an example) based on correlation. OK. Now we go through the process and identify the “good” trees, and we dismiss as irrelvant all the other trees which don’t seem to respond to temperature. Then we do our reconstruction and (as if by magic) we generate a “temperature history”. Fine.
.
But here is the rub: if you do not identify and verify why the trees you excluded did not respond to temperature, then you have no rational way to know if the trees you selected behaved the same way long before the calibration and “verification” periods. It adds an unknown and unknowable uncertainty.
.
It all boils down to the lack of a reasoned, defensible physical model for selection and exclusion. As I said above, this would never pass muster in other fields. I remain surprised that anyone with the years of experience you seem to have (similar to my own experience) would think this is all OK.
Nick:
Causation is the most common explanation given for persistence.
I keep telling you that you’re making a distinction without a difference. You have to give an argument for why the correlation could be expected to exist.
Which, if it’s spurious correlation, it won’t.
What I’m describing is an “internal consistency test”, which, after selecting your series you perform a statistical test between them (e.g., Pearson’s r). Then you Monte Carlo e.g red noise and you make an estimate of the probability that the value of r you got from your data could have occurred by change.
It’s certainly not a fallacy in testing the series for internal consistency, and any reasonable reconstruction should have some form of this.
The fallacy I was referring to here is a bit different: cum hoc ergo propter hoc raises it’s head here even though the proxies correlate with temperature during the instrumentation period, and still manage to correlate against each other outside of the instrumentation period, [*] the problem is you can’t conclude that the signal you have reconstructed has anything to do with temperature. It’s some kind of “climate index” that may or may not relate to temperature, but who knows?
[*] As I mention, they sometimes post-screen these series and zero-out sections of proxies that don’t agree with the others, this is another not statistically neutral procedure. Good luck modeling that effectively, and extracting defensible uncertainties from it.
Actually it’ been well studied, and not that messy compared to somethings I’ve worked on (literally or figuratively).
Actually, temperature, precipitation, and fertilization responseare some of the most studied attributes of growing plants. They all have some correlation to growth. To claim something with respect to temperature outside of the “training” or calibration sequence requires that you address these known variances in growth or you mis attribute the effect of temperature and worse commit a screening fallacy which is to extend past the point of what has been measured to an area where the relationship is assumed not proven. You may be right you may be wrong. What is certain is that you cannot clam that correlation of the training period explains the other area.
John:
John, that is very succinct. Thank you.
Nick if you are going to continue to defend correlational screening as a mechanism for proxy selection, would you address this please? This is the central issue.
If your defense is “just ’cause”, include this query and mark the box below.
[ ] Just ’cause.
SteveF,
“But here is the rub: if you do not identify and verify why the trees you excluded did not respond to temperature, then you have no rational way to know if the trees you selected behaved the same way long before the calibration and “verification†periods”
No, we know that almost all of the trees in the world cannot be used as temp proxies. That actually is not saying that they don’t respond to temp; just that there are too many other influences, the S/N is too low. So all that has happened is that those many trees were not totally excluded fromn the penultimate screening.
But you can’t even say anything about those late excludedtrees. A significance test was applied. That says something about the trees that were significant, but not about the rest. It’s not proved that they were not temp sensitive. They just didn’t reach the prescribed level of confidence.
And as I keep saying, uniformity (back in time) is based on physical, not statistical reasoning.
B.Kindseth (Comment #97875)
If I remember right,Steve McIntire created a hockey stick out of red noise using MBH98 methodology.
Well, there was a real selection fallacy. Actually. Steve was more careful in his statement, but what Wegman did using Steve’s code was run 10000 with red noise, and then selected 100 based on “HS index” of the results. Then said – look we get hockey sticks nearly every time. That really is peeking at the target.
Nick says “”No, we know that almost all of the trees in the world cannot be used as temp proxies. That actually is not saying that they don’t respond to temp; just that there are too many other influences, the S/N is too low. So all that has happened is that those many trees were not totally excluded fromn the penultimate screening.””
This misconception lies at the heart of your misunderstanding and erroneous claims as to teh bilogical response of plants, in particular trees. You cannot claim this until you show what the relationship is of the known factors of growth. You statement invalidates statistics. That is how bad it is.
As far as I can see the “screened” results in green would be invoking the ‘uniformity’ principle for each tree. But the results are biased in the way shown and there is a statistical reason why the bias is introduced.
This bias affects the major conclusions in papers where these types of analyses are used.
Carrick (Comment #97892)
June 15th, 2012 at 4:33 pm
John:
John, that is very succinct. Thank you.
Nick if you are going to continue to defend correlational screening as a mechanism for proxy selection, would you address this please?
No, it’s not very succint. But worse, it’s another in the endless parrotting of “selection fallacy” without definition. No connection is made with selection, and there is none. All proxy stuff is based on the uniformity principle. That has been endlessly discussed in the literature. It’s justified by the physical situation, and yes, it is not provable beyond doubt. Just as it isn’t in geology or most of science. And it can fail, as with the Tiljander lakes. Nothing to do with selection.
Nick
Mann uses 1200 proxies. Let’s suppose 100 of them passed screening with a correlation of at least .1. Now 1200 random proxies would probably do better than that as well.
If 1000 had passed screening you would have a point.
If I take 10000 proxies, 200 of them pass screening, and the result is a hockey stick, wouldn’t you be suspicious?
Nick
Whatever this “uniformity principle” is, it’s clear that screening this way results in mathemagical artifacts and the papers that use screening make bold unjustified claims based on the appearance of these mathemagical artifacts.
Damn Nick talk about endless parroting!! The ones who make claims about uniformity principle have to support it!! The geologists did by citing that physics works the same now and in the past. THIS IS NOT THE CLAIM YOU ARE MAKING. You even admit it with this quote “No, we know that almost all of the trees in the world cannot be used as temp proxies. That actually is not saying that they don’t respond to temp; just that there are too many other influences, the S/N is too low. So all that has happened is that those many trees were not totally excluded fromn the penultimate screening.”
They do NOT measure the many other influences that are known to exist and determine how they respond in the past> Thus they cannot explain the past. BY YOUR DEFINITION uniformity principle MEANS that there is no covariation in the past of co variants that we now know vary. Your statements are literally self invalidating.
Nick–
Anyway, even if we were to claim we were applying the “uniformity principle” to a single tree, the correct claim would be that the correlation between that grown and temperature for that tree remains unchanged during it’s lifetime. But that doesn’t mean that if we measure a correlation of R=0.41345 based on data from 1921-1990, the correlation is R=0.41345 for that tree. There are error bounds on that correlation. And even if the uniformity principle applies perfectly tree by tree, the screening fallacy arises due to existence of non-zero uncertainty bounds on our determination of the correlation for individual trees.
This “uniformity principle” (which you seem to want to apply tree by tree) does not eliminate the problems associated with screening based on finite (in fact, rather small) sample.
This is why picking based on ‘meta data’ (and preferably getting fresh cores based on the metadata you want associated with those cores and then not screening using correlation is superior.
Phillips is alluding at the possibility that correlations between timeseries may arise just because a third factor is driving the trend in both timeseries. Is this possible in paleo-climatological applications? I think it is very well possible. For instance, a proxy indicator sensitive to rainfall, nutrients or other environmental factors may exhibit a trend that can be erroneously interpreted as an indication of temperature trend. A regression analysis between a proxy and temperature that oversees this possibility takes the risk of not properly estimating regression parameters. If the validation of the regression model is performed in periods where this trend is continued, a high, but perhaps spurious, validation skill is likely to be the answer, specially when using measures of skill that do not hedge against such risks.
Eduardo ZOrita
Nick:
It’s a good think you’re not an experimentalist. You don’t even understand the basics.
Not only is it not provable beyond doubt. It’s not provable at all. It’s just an ad hoc assumption, and the way you are arguing it, I doubt many paleclimatologists would come on board with you. In fact they might even say “please stop ‘helping’ us now.”
Your claim holds no water at all in empirical science, has absolutely nothing to do with the uniformity principle, and in any other field data based on your version of the uniformity principle would be absolutely unpublished.
As somebody who frequently reviews manuscripts and have never had the editor go against my recommendations, I can tell you an argument in a paper based on your reasoning would be sent back as “unsuitable for publication in any form” from me.
I marked your response for you.
[X] Just ’cause.
Lucia, for what ever reason I plotted the reconstruction vs HadCRU and I then took the difference^2. The sum of squares was a bit higher than I expected, so I tried solver.
If you multiply the reported reconstruction by 0.815779579 and take away 0.004775592 you get a much better fit to HadCRU.
What I am having trouble understanding is why they used the 1920-1990 calibration instead of the 1900-1990 period which is in HadCRU.
“The ones who make claims about uniformity principle have to support it!!”
“This is why picking based on ‘meta data’ (and preferably getting fresh cores based on the metadata you want associated with those cores and then not screening using correlation is superior.”
OK, can we write off the selection fallacy now? ‘Cos everyone seems to want to change the subject.
For the umpteeneth time, yes supporting the uniformity principle is the key. And it has nothing to do with selection.
And yes, you should try to do the best you can with metadata and physical reasoning. They do. The space of proxies to look at is reduced on that basis from vast to manageable. But that doesn’t make selection by correlation a fallacy.
I know know why they introduced the staggered Palmyra series. That peak at 1160 matches the present era unless you add an inverted series.
This is fraud.
They knew that Mt Read and Oroko would match the modern record, so they added the little bit of Palmyra to get rid of it.
I suspect that the 1160 point in the Oroko may have suffered a misreading an been ‘accidentally’ given a minus sign.
Anyone know where a Kosher Oroko file is stored?
Nick:
Some do.
Other’s flip their proxies and double count them.
And for the umpteenth time what you are calling the uniformity principle not only isn’t the uniformity principle, it’s not even science. It’s faith based proxy divination.
WE are not changing the subject you are parsing and poorly at that. Not using meta data and mis using the uniformity principle is the screening fallacy Nick. ONe cannot support the claims made that is the definition of a fallacy for scientists though there are other ways to wrong foot oneself
There are 11 proxies that cover 1630 to 1990.
I took these and detrended and normalized ((x-mean)/SD), in 71 year blocks.
First I examined the SD of the points from the 11 proxies at each of the 71 years in the 1920-1990 range.
Then I ranked the SD’s lowest to highest, plotted against normalized rank order. A Gaussian will give a sigmoidal plot.
Then I did the same thing with other chunks outside the calibration period, all the same proxies, all treated in identical manner.
The distribution of SD’s in all periods 1630-1920 is essentially identical.
The distribution of the SD’s in the calibration period is quite different.
Below I show three blocks outside the calibration period and the calibration period.
http://i179.photobucket.com/albums/w318/DocMartyn/normalizedproxiesSDdistribution.jpg
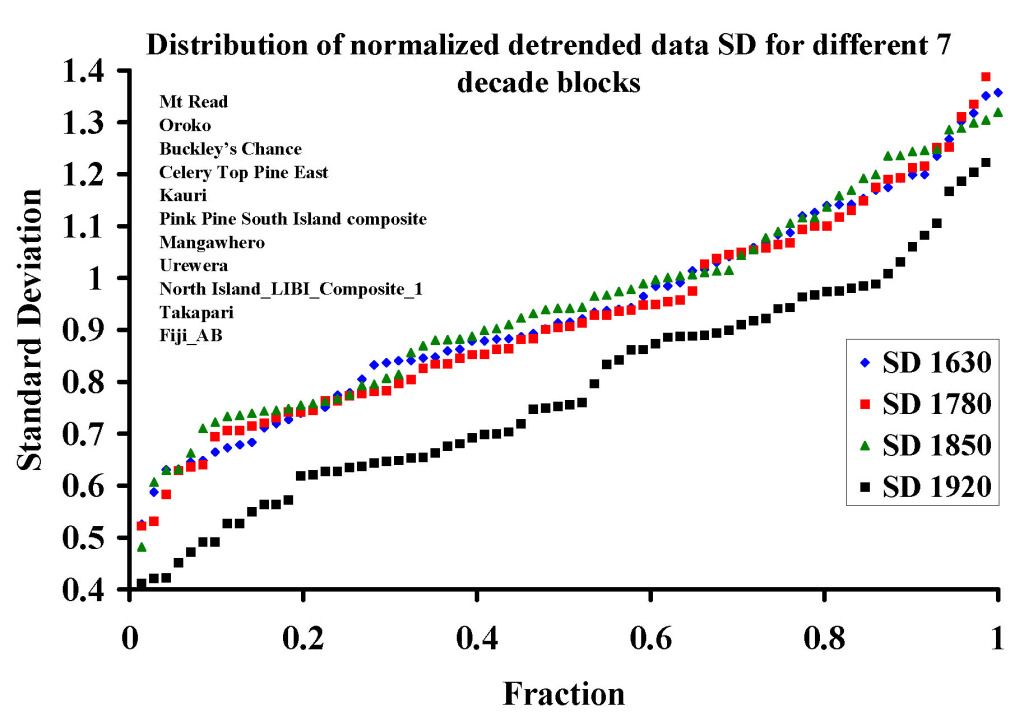
The SD are different by 0.2, the selection procedure has removed a large amount of variance in the 1920-1990 period, but this has not been removed from the rest of the time series.
Thus, there data-sets have been cherry picked to have low variance between 1920-1990, but are mostly noise after that.
DocM don’t you mean that one can’t distinguish between noise and signal before the 1920-1990 period?
Humm… Maybe it is time to agree to disagree: most experimental scientists seem to think proxy selection based on correlation is not good science (and maybe not science at all). Nick thinks proxy selection based on correlation is OK.
.
Honestly Nick, you will never convince me of that, and I rather suspect neither I (nor anyone else) will ever convince you that you are mistaken. Can we at least agree that defined selection criteria established before data collection, and applied without resorting to data snooping, would be more widely accepted as a robust method for proxy reconstructions?
DocM and Carrick, this reminds of the other reason that Nick is wrong. He said ““â€No, we know that almost all of the trees in the world cannot be used as temp proxies. That actually is not saying that they don’t respond to temp; just that there are too many other influences, the S/N is too low. So all that has happened is that those many trees were not totally excluded fromn the penultimate screening.—
The problem is that we know that this type of processing REDUCES the signal relative to the cailbration or training. If the S/N ratio is too low, how can reducing the signal’s magnitude help it? This shows one of the aspects as to why Nick’s reasoning is simply a denial of what the math and the method are doing. He is literally denying that these influences that he has admitted that exist and are driving the S/N too low actually count. But, yet, temperature counts less, as he admits than these others, but he can ignore these that count more. Once again, this can only be true if they do not vary and have no input in the past yet we know they vary and have input in the present. This has to be one of the most stupid arguments I have ever encountered. It is self contradictory.
SteveF, the problem is that Nick makes arguments that are self contradictory.
Nick, you are the one trying to change the subject to whatever the heck your “uniformity principle” is supposed to be in the context of creating proxies and away from the mathemagical artifacts introduced by selection.
You’re going to have to gin something up to show that if this “uiformity principle” (whatever it might be) applies, the mathemagical artifacts arising from screening don’t arise.
“John F. Pittman (Comment #97915)
June 15th, 2012 at 8:02 pm
DocM don’t you mean that one can’t distinguish between noise and signal before the 1920-1990 period?”
There is an identical distribution of noise in all the samples; however the amplitude of the noise has been reduced in the calibration procedure by screening. This is the ‘Screening Fallacy’ fingerprint. There is less variation of between series in the screening period (because half the signals or more have been discarded), so the noise in this period is tight. After the period the distribution around the mean widens.
This is not a question of S/N ratios. We have no signal; we are measuring the distribution around the mean of each of the proxies in the same year.
The bigger the SD, then the less like each other the proxies are. Statistically one expects the width of the SD to be Gaussian; some years they re bunched together and some years wide apart.
The key point is that, with a n=71 years, we can measure the distribution of signal rather easily; The distribution during the calibration period is different from everywhere else!
The calibration period is not part of the same population as the other time points.
Take 22 noisy lines 1000 years ‘long’.
In the center 70 years calculate the mean and throw away the half with the lowest means.
Now you will have a distribution of SD’s that is low in the center, but higher when you move away from the interrogated center.
That is what we have here.
Has anyone published an “Idiots Guide to Treenometers”. I have so many questions.
What makes a tree a treenometer?
Is it possible to plant a tree today and be confident that it will be a treenometer for 500 years into the future? Assume that you control species and location.
If not, why not?
If yes, where are the test groves to confirm this for our great-great grandchildren?
For the trees that the paleo folk have designated as treenometers, I have questions:
– Are all trees of the same species near the treenometer trees also treenometers?
– If not all nearby trees are treenometers, why not?
– Since Robert (NotInAz) claims that microclimate dominates genetics as a determinant on whether a tree is a treenometer, how large an area (microclimate) allows a species to be a treenometer?
– In other words, is a species a treenometer in one location but not in another? What are the microclimate variations that cause a treenometer species to cease being a treenometer?
– Has anyone done a systematic study of microclimate impacts on treenometers? Does the treenometerness of treenometers vary over time in response to microclimate changes? Has this been studied in any meaningful way? Do any of the paleo folk care?
– If yes, have the microclimate variations between locations that allow trees to be treenometers in some locations and not in others been identified?
– For trees that are confirmed as treenometers in the calibration period, has the microclimate that makes the tree a treenometer been confirmed to exist throughout the non-calibration period for which the tree is assumed to be a treenometer?
– Since so many treenometers are in (I’ll say it) weird locations, how well do we understand the microclimate of those locations throughout the calibration period?
– If yes, how was the microclimate been confirmed to be suitable for treenometericity throughout the noncalibration period?
– If no, is this not a significant problem for the paleo folk?
– Apparently some treenometers stopped being treenometers in the 1960s. I’ll label these the divergent treenometers.
– Have the divergent treenometers been eliminated from all recent paleo studies?
– Has anyone determined the microclimate dynamics that caused the divergent treenometers to stop being treenometers? Do any of the paleo folk care?
– If yes – what caused treenometers to stop being treenometers?
– If no, how can we assume that any “treenometer” is a treenometer outside of the calibration period?
– Is anyone resampling treenometers that were determined to be treenometers based on 20 year old cores to see if they are still treenometers? (I have to say that if the paleo folk are not systematically analyzing the divergent treenometers, they are most probably NOT verifying that 20 year old treenometers are still treenometers, but the question must be asked).
Please help – I have so many questions.
DocM, most of the proxies I have look at seem to indicate that the noise is the signal.
http://i122.photobucket.com/albums/o252/captdallas2/average.png
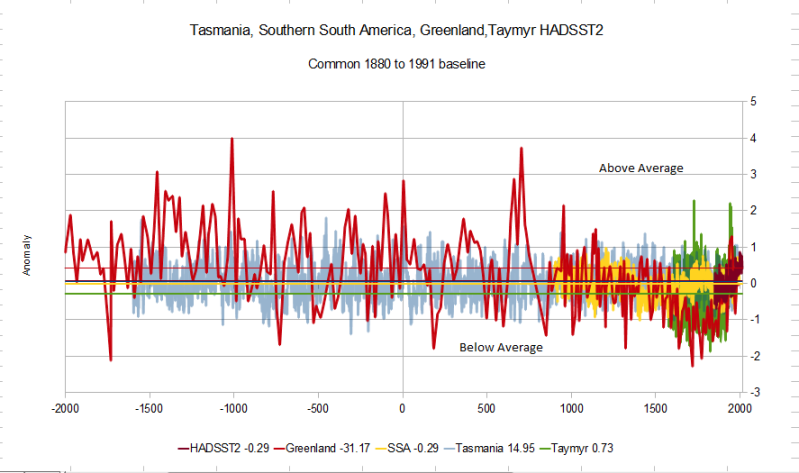
There are two SH recosntructions and two NH reconstruction using 1880 to 1991 baseline (except for Taymyr which Jacoby chopped off at 1970) with HADSST2. The “noise” gets stronger as you go back in time. There is less noise in the SH and more in the NH. Changes in land use and in particular snow cover, could do that in the NH where the SH oceans would be pretty stable.
It looks to me like the screening over looks the obvious.
Re: SteveF (97917) —
You propose a shocking departure from CHP (Current Hockeystick Practices):
While radical, your idea does have a few modest merits over CHP:
* It would allow null hypotheses to be stated, and tested.
* It would permit the correct calculation of standard statistical measures.
* It would align statistical practices in paleoclimate with those in the remaining areas of science.
* It would help climatologists think more clearly and logically about their own practices and findings.
On the other hand, there are compelling arguments for nixing any reform, and sticking with CHP:
* There are tremendous sunk costs in this area.
* Past temperatures will likely be seen to be known with lower precision than is presently asserted by CHP.
* With hockeysticks not a foregone conclusion of paleo recons, the “it’s worse than we thought” message risks dilution.
* Most of CHP’s critics are nerds, and few generalists and policymakers care about statistics anyway. For the most part, critics’ arguments can be ignored, and they can be boreholed in technical fora.
* The slippery slope: if paleo is forced to conform to accepted scientific practice in this area, what could be next?
On balance, considering all that is at stake, I have to cast my vote with the “[x] Just ’cause” faction. Paleoclimatologists should double down on CHP.
“All proxy stuff is based on the uniformity principle.”
Well, it is a safe bet that the volatility of D2O versus H2O has not changed much over time. It is a safe bet that carbon atoms have always tended to form four tetrahedrally oriented single bonds, and that ice has always floated on water. It is a safe bet that U238 decays at the same rate and along the same pathway now as in the past. It is a safe bet that isostatic rebound was similar in mechanism in earlier deglaciations as in the most recent one. It is even a reasonably safe bet that icebergs created by calving of glaciers in Greenland carried stones out to sea in the distant past, just as they do today.
.
But it is a nothing short of a bizarre and illogical bet to say one specific living tree (think Yamal and the ‘dirty dozen’), known to respond in growth rate to a host of factors, was responding 400 years ago to temperature in the same way as it did during a recent “calibration period”, and that it was not influenced 400 years ago in unknown ways by other factors. Funny too that the uniformity principle seems to fail when one encounters the late 20th century “divergence problem” in trees. Maybe we need a modified-limited uniformity principle for tree-proxy reconstructions; something like “We justify tree selection by correlation based on the uniformity principle, except when that is either inconvenient or in conflict with our preconceived notions.” Please.
.
The uniformity principle has nothing whatever to do with the wild-ass speculation that is part and parcel of correlation based selection of trees.
there’s a version in Climategate 2. Cook splices instrumental data with proxy data in his graphic. I haven’t parsed the data, though I’ve taken a quick look. Remind me if I don’t post on it.
“Nick, you are the one trying to change the subject to whatever the heck your “uniformity principle†is supposed to be in the context of creating proxies and away from the mathemagical artifacts introduced by selection. “
No, I’m not. The threads were supposed to be about an alleged fallacy arising from selecting proxies according to the significance of their correlation with temperature.
But instead there’s a clamor of, how do you know the observed correlation applied in the past – or words to that effect.
To which I respond, that’s a property of the actual proxies. It’s nothing to do with how you select them. The only way you could analyze it statistically is if you could extend back the instrumental measure in time to compare.
But it is the fundamental issue with proxies. It’s a big uncertainty, and why no-one would want to use proxies when real thermometers are available. But it is the only quantitative information that we have about past temperatures. So if you want to believe in a MWP, say, that’s the evidence you have.
It isn’t my idea to call it a uniformity principle. Quoth the North Report:
“All paleoclimatic reconstructions rely on the “uniformity principle†(Camardi 1999), which assumes that modern natural processes have acted similarly in the past, and is also discussed as the “stationarity†assumption in Chapter 9.”
and to expand
“Stationarity: The statistical relationship between the proxies and the climate variable is the same throughout the calibration period, validation period, and reconstruction period.”
Now the uniformity principle underlies a lot of other scientific activity. Carrick and SteveF quote a restricted version which talks simply about physical laws and maybe the properties of atoms. But you can hardly say anything about the past without making an assumption that some things used to happen much as they do now. SteveF says the volatility of D2O hasn’t changed. But winds might have changed. Or salinity. In corals its pretty subject to alteration by rainwater.
And to go further afield, here are some of the calibration and uniformity issues involved in carbon dating. In geology, traditional inference about the past has focussed on the laying down of sedimantary layers. There are assumptions there about the continuity of the actual processes; that they were similar in different locations. Here is just one argument taking place, of economic significance, where past processes are modelled on what is known at present, and where the uncertainty dwarfs treerings. Do the frackers just say “can’t prove it” and go home?
These issues are basic, and you can’t change them by selection methods. There’s no “selection fallacy” involved. That’s why I say it’s changing the subject. I don’t mind talking about it, but I didn’t initiate it.
Nick – I have a simple question: why do some trees respond better to temperature than others?
Kan,
There’s variation, but it isn’t the only thing that determines whether it’s useful for temperature meaqsurement. For that you want a tree that is not responding to anything ealse, or at least not anything that varies. So it always has enough water, fertiliser doesn’t vary etc. That lowers the noise – then you want a strong signal, which comes from trees that grow a lot less in cold years than warm. That’s often near the treeline, of altitude or latitude.
Nick, to be fair we’ve covered the screening fallacy ad nauseum, and you shifted the topic to your erroneous notions of what the uniformity principle is.
The uniformity principle applies to things like physical laws that you have a justifiable reason to expect to hold up over a long period of time. It doesn’t apply to things that can occur by accident.
As I said above, it would be interesting to see how many climate scientists follow your somewhat odd notions of the philosophy of science… and I have to admit wondering whether you believe them yourself at this point. This argument of yours is … kind of out there.
Kan:
Sometimes it’s because they aren’t responding to temperature, you just have a large spurious correlation. Stripbarked trees (trees that are damaged) and trees that are changing morphological forms are examples of that (e.g. shifting from shrub-like to tree-like as the treeline moves up the mountain and the tree stops being temperature limited).
Carrick,
“you shifted the topic to your erroneous notions of what the uniformity principle is”
Not me.
And it’s not my notion. I’ve cited sources.
Nick:
I saw jut one source (Gerald North’s report), but North isn’t a climatologist, and looking at his resume, nor is experiment measurement theory his forté. Source yes, credible source no.
Look … it’s pretty simple.
AFAIK, nobody relies on the description given by North these days to do reconstructions. I’m not sure they ever did. So in my opinion, not only are you arguing a specious point, it s based on a “logic” coined by a numericist that doesn’t even have anything to do with the actual process by which modern reconstructions are performed.
So unless you just want to be an apologist for Mann’s original paper (why? he’s moved on, clearly he too agrees for the need to improve on his original methodology … talk about Mann 08), I see no need to further entrench yourself in an untenable position on this.
You need to read Moberg 2005, von Storch 2007, Ljungqvist 2009 and 2010. (I think Moberg gives the clearest explanation of how you “bootstrap” the tree-ring samples into the reconstruction, the methodology for doing that can still vary of course.)
These are papers you should have been familiar with before you decided to fly the white banner in defense of MBH or whatever it is you call yourself doing here.
Carrick
“I saw jut one source (Gerald North’s report), but North isn’t a climatologist, “
He was the chairman of a large and expert panel. And the phrase he used is a standard one repeated in many other papers. Just google it.
But you described it as an “out there” notion of mine. A NRC report is not “out there”.
“whatever it is you call yourself doing here”
I’m trying to pin down this “selection fallacy”. But folks have moved on.
OK, KAP, you went postal on me earlier for this comparison because it didn’t have error bars for MBH.
Next time just ask to see the error bars, k?
Anyway, Plot of ensemble mean vs MBH with MBH errors shown (these are one sigmas).
Here is the difference between MBH and ensemble mean.
Here are the z-scores. The cyan region corresponds the region where the two series would agree at the 95% CL.
The null test (the two series “agree”) fails as the p-value associated with this difference in series is p < 0.0001
Nick:
Not used the way he/you are using it. Uniformity is a term of art. It is used properly the way that SteveF and I have described it and not in the way that you characterize the North report to have used it.
In any case, I know how these panels work, having served on several (larger is worse). Unless they were tasked to examine that one point, more than likely, somebody was just winging it when they wrote that nonsense.
Anyway, just RTFL. They don’t make that assumption in any of the decent modern reconstructions. It’s unnecessary as well as having the inconvenience of being entirely wrong.
I had a long discussion of it here. There are others on this thread. There’s a limit of how many times I’m willing to repeat myself before I decide somebody isn’t teachable.
Feel free to modify my discussion mutatis mutandis to how a particular researcher is doing validation studies.
I don’t like the idea by the way of using the earlier part of the temperature series to validate… because I don’t think the instrumental series is reliable for times prior to 1950 (and definitely prior to 1920). I guess I should publish that comment so it’s valid. 🙄
Internal consistency using paired correlation is how I would do the verification myself, so that’s how I wrote it. By the way, it’s there that you should really see a big difference between “real proxies” and random noise, if there is a signal in the “real proxies” of course.
Carrick,
Well, I should acknowledge that you’ve called it “screening fallacy”. But it’s another in these endless efforts to stuff the uniformity issue under that heading.
Spurious correlation has nothing to do with how you select proxies. It describes the nature of the proxy property. And as I said elsewhere, it’s a spurious notion. There is no phycal mechanism that says that, say, a tree in Yamal should correlate with temperature in Salehard. There are a whole lot of intermediate variables.
Verification is a post-screening step. It’s usually used not to screen, but to accept the whole reconstruction.
What is needed is a statement of statistical basis for the claim of fallacy. Lucia’s emulation is the best we have so far.
re nick stokes and his “You need to screen to find what is a proxy. Billions of trees do not have a temperature signal. Some do. You have to screen somehow to find which ones they are.
Reminds me of monkeys and typewriters.
Somewhere there is a piece of Shakespeare combined with a 10th commandment saying
“These tree proxies look right, lets use them for what we want to prove . and by the way there is no selection fallacy involved, absolutely not” as the experts all agree” citations attached .
For Nick: There is body of work about spurious correlations and their effects such as follows. There is a large body of work from statisticians to philosophers. Just how many times do you have to be wrong NIck?
The problems that arise when research is based on the assumption that a constant conjunction is a necessary and sufficient condition for making a statement about causal laws. The last phrase is from (Smith,1998: 301) and he labels this position empiricism, as opposed to idealism (constant conjunction is necessary but not sufficient)
or realism (constant conjunction is neither necessary nor sufficient).
Based on the discussion above the relevance of the topic should be obvious both to the specific research on drug treatment and more generally for the philosophy of science and the evaluation of positivism/empiricism. If constant conjunction is no good as a guide to causal connections, then the researcher might draw the wrong conclusions – mistakenly arguing that X is best when in fact Y is the best treatment. More generally the positivist philosopher has to face several unpleasant options. He might downplay the degree to which there is a mismatch between constant conjunction and causation in which case he runs the risk of at least sometimes accepting spurious relationships as genuinely causal and – conversely –ignoring true causal relationships that do not manifest themselves in constant conjunctions. Alternatively he might admit that the problem is serious in which case he has to accept the rather disappointing conclusion that the scope for reliable knowledge is not very large. Then, there is the third option of admitting that you were wrong and that you should rather try a different approach to knowledge, like idealism or realism.
This should lead us to focus on ways to avoid the problem – either by specific tests or by adopting rules of research that reduces the problem of spurious association. Although one may make some progress in this direction, it may be impossible – both for practical and for conceptual reasons – to go very far. Taken together the widespread existence of spurious associations and the limited possibility of revealing the spuriousness, implies that our knowledge is severely restricted. This, in turn, implies – as argued by Jon Elster (1998) – that we would be better off trying to search for mechanisms instead
John,
“The problems that arise when research is based on the assumption that a constant conjunction is a necessary and sufficient condition for making a statement about causal laws.”
Who made such a statement?
The winners of the Purdue University Indianapolis “Spurious Correlations Contest” is a good place to start Nick.
OK I’ll expand. Who are you saying made such an assumption in order to make a statement about causal laws?
This is all very waffly.
Yes, Nick I agree about the waffly. But I am a biologist and an engineer, and this is philosophy. It is a paper from philosophy examining “truth” and the difficulty of knowing whether one has established a “truth” or wasted time banging on about a spurious correlation. The part about empiricism, and the potential for spurious correlations is being examined from the philosophical perspective.
I figured if even the waffling people get the concept of spuriuos correlation correct, you could, too.
Nick 97933,
You brought the term “uniformity principle” into this discussion, not anyone else. The reason I and others object is because it relates directly to what is wrong (scientifically wrong) with selecting by correlation to measured temperatures. The uniformity principle applied to physical laws, the behavior of atoms, etc. is perfectly valid, and it even applies to messy things like the average behavior of a collection of trees over time, so long as the selection process for those trees is not based on the behavior you are trying to measure. The problem is that selecting based on the behavior means you are no long relying on the uniformity principle at all.. more accurately one might describe it as relying on the non-uniformity principle. That is, when you select trees which correlate with temperature and exclude those close by which don’t, you are selecting based on unknown/unidentified factors which may not have applied to those selected trees in the past, but which may have applied </i
Continued… (I loath writing on an iPad)…
May have applied to he trees which were excluded in the initial screening. In other words, you introduce unquantifiable uncertainty in the reconstruction, and as Carrick likes to point out, with unknown uncertainty, you know nothing.
.
Rigor in sample selection is the issue, and invoking the uniformity principle does not resolve it.
@pitman
“I figured if even the waffling people get the concept of spuriuos correlation correct, you could, too.”
He knows about spurious correlation. No need to waste everyone’s time.
Bugs:”He knows about spurious correlation. No need to waste everyone’s time.”
Then why does Nick keep making such incorrect and self contradictory statements about it, if he knows. Is he dishonest, schizo, forgot to eat his wheaties? I don’t know. I do know he is making unsupportable statements. That is why I want to nominate him for an honourable mention in the “Spurious Correlations Contest†as belonging in a class all by himself.
perhaps you could just state exactly what it is you disagree with.
Nick,
I fear I did not adequately connect the dots in the above two comments. The connection is that the “selection fallacy” is in this case pretty much the same thing as the misapplication of the uniformity principle. You keep asking for someone to define what the “selection fallacy” is. Fair enough. My working definition is:
.
Selection Fallacy – The erroneous belief that a sample selection method yields an unbiased/representative sample population when in fact the selection process leads to a biased or potentially biased sample.
.
The impact of a biased sample is pretty well known. From Wikipedia (sample bias):
Applying the uniformity principle to a biased sample is simply inappropriate (AKA, just wrong.) Nick, sometimes what you argue makes a lot of sense. This is not one of those times.
Bugs, I have stated it repeatedly, as have others. Sorting as the methodology of say MBH for example becomes spurious first by the sorting. Secondly, because samples were not chosen a priori, one cannot know if one has a correlation or a spuriuos correlation. Third, the unifomity principle is misapplied. Fourth inhis defense Nick first states there are other factors such as precipitation that are known to effect the series and that the temperature signal is usually lower meaning it has a lower S/N while maintaining that phenommena that are known to vary in the present somehow magically do not and cannot vary in the past who were not measured in the past, rather than noting absense of measurement does not mean measurement of absense even though we used that vaery phrase or similar arguing about another aspect of reconstructions!
NIck, the reason you are getting confused about my discussion of spurious correlation is your goal-line defense of “uniformity principle” is intimately linked to it.
Let’s flip it around, if you don’t have causality to explain why a correlation would extend past the measurement period, what’s your explanation? If you want to write a peer reviewed article (you probably don’t, but the people you think you’re defending do), you have to provide a justification for this, or it’s going to get sent back as unpublishable.
You can’t invoke the uniformity principle as you are describing it because that is the
[X] Just ’cause
explanation, and it’s not even an explanation, it’s a punt.
<a href=http://climateaudit.org/2012/06/10/more-on-screening-in-gergis-et-al-2012/#comment-338222"<Here is a link to a related conversation that Nick Stokes has been engaging in at the comments of a Gergis post at CA over the past few hours, with HAS, HaroldW, and others.
Here is a layperson’s proposed working definition of the Screening Fallacy.
When considering proxy-based paleotemperature reconstructions, it is fallacious to frame the issue as: “Since a subset of trees provide tree-ring records that serve as a useful proxy for temperature, what is a straightforward way to define that relationship?”
This view fails to emphasize that any specified group of trees may not contain an identifiable subset that can usefully serve as a temperature proxy for the study period. Or, alternately, that the determination of such a subset and its proxy:temperature relationship may be difficult. As a consequence, this view slights the importance of devising and carrying out tests of the underlying hypothesis (e.g. the “self-concordance in prior periods” exercise of DocMartyn in #97808).
A very fascinating thread. I certainly understand better the blind spots scientists have in their methods. It also demonstrates the need for skeptics of a hypothesis and data support- it is extremely easy to believe your results and methods if they are telling you what you expect. I am guessing all scientists are prone to this blindness, but some more than others.
I don’t have the statistical chops, but I do have a suggestion for someone who might be interested in doing it. It may provide a little more insight.
Since tree ring growth is affected by several different variables, it seems reasonable to run a correlation against as many of those separate variables as you have long term records, just to see which one correlates best.
Law Dome has a 20 year smoothed co2 record running from 1832-1978 with annual resolution which matches very well with Mauna Loa co2 data during the period of overlap. Less than one ppm difference. By combining the two data sets you would be able to judge if the correlation is better or worse than the temperature correlation. You would also have a long enough record to split it in two and see if it breaks down in the untrained portion of the record.
Here are the data links, if anyone decides my suggestion might be worth investigating.
Law Dome:
ftp://ftp.ncdc.noaa.gov/pub/data/paleo/icecore/antarctica/law/law_co2.txt
Mauna Loa:
ftp://ftp.cmdl.noaa.gov/ccg/co2/trends/co2_annmean_mlo.txt
Bob, Is this the sort of study you’re talking about?
See in particular figure 5.
I see that some of the ground I’d been discussing with Nick Stokes at CA has been covered here. I think where we got to there is three conclusions:
1. The uniformity principle has nothing to do with proxy selection, it is the basis for using proxies for hindcasting back before the instrumental period (the environment in the pre-instrumental period is assumed to be the same as during it);
2. Proxy selection isn’t just a mechanical procedure unrelated to the real world. Proxies are justified using models of the world, and those models underpin any selection process. It therefore doesn’t make sense just to say proxies are correlate with temp and that’s the end of it (Nick’s initial position), one needs to consider the implications of the underpinning real world model. This then means the underpinning model is an implicit assumption in any results derived from their use.
3. The selection of proxies can influence (and bias) subsequent analysis. Nick hasn’t signed up to this, but I have just shown in a comment at CA how Gregis’ experimental weaknesses (that Nick concedes in general) and proxy selection in particular lead to valuable information being discarded – information that very likely biases the subsequent analysis (both parameter estimation and their distribution/certainty).
SteveF,
“You brought the term “uniformity principle†into this discussion”
I brought the term, but not the concept. People kept asking – how do you know what you see now applied in the past. I said that’s an important query – it has a name, and gave a source for that name.
But thanks for providing a definition. One reason for my pressing for that is that, without it, we don’t know if we’re talking about the same thing. The definitions are trickling in now and they are pretty disparate. Carrick and John P think it’s to do with uniformity. Amac’s is something general on subsetting. I’m not sure how it could be applied.
Yours is specifically about population statistics. It says basically that selection is bad sampling.
And it would be if that’s what you were trying to do. But it isn’t, as I’ve emphasised here. You’re trying to find trees unlike the others. So my next question is, sampling from what population?
And as I’ve emphasised there also, you apply the uniformity principle to specific situations, not to populations. Some Finnish lakes had ancient interference, some not. Etc.
Nick, again you amaze me. You acknowledge that some Finnish lakes had ancient interference, and don’t add 2 plus 2. This was determined interference. What of the ones that effect a proxy but were not measured or accounted such as precipitation? Simply because someone was trying to get a signal and did not consider that other independent varaibles exerted as much or more and vary accordingly do not mean they do not exist. That is the point you want to avoid. Itwas the authors’ duty to demonstrate this and they did not. This means such works are speculative not quantifiable or robust.
> Some Finnish lakes had ancient interference, some not.
OT — But the very fact that the unsuitability of e.g. Finnish lakes to serve as proxies continues to go unrecognized even after that unsuitability has been conclusively and repeatedly demonstrated is a hint that something is amiss with the reigning philosophy and practice of proxy selection.
Amac,
It was not unrecognized. They just didn’t take exactly the remedial action you think they should have.
Nick Stokes (Comment #97991) —
Now you are being silly.
Off topic. But silly.
Nick – I did not ask how we might find trees that might respond better to temperature, I asked what makes a tree respond better to temperature than other trees.
Since you want to throw out billions of trees you say do not respond to temperature (and there are at least millions that are at latitude, altitude limited growth areas).
I thought it might be useful to find out why the few special trees do respond so well.
Nick,
“You’re trying to find trees unlike the others.”
Sure. But you have to identify them before you look at the data, not after. I (and others) have been saying this for days now. If you base selection on correlation of the data with a “calibration period” rather than a rational, defensible pre-data-collection criteria (based upon your understanding of the physical processes involved), then you are selecting a population which is clearly atypical for reasons you do not understand. Since you do not know why the selected population behaves differently, you do not know if the selected population can reasonably be expected to have behaved the same way before or after the calibration/verification period (think “late 20th century divergence problem”). And you have no way to calculate uncertainty in the results of the analysis. The “uniformity principle” in this case is just not applicable.
.
The correct methodology is:
1. I think the trees which are subject to XYZ conditions are very sensitive to temperature.
2. I collect samples from trees that live in XYZ conditions.
3. I test if if they correlate with historical temperatures. If so, I do a reconstruction, write it up and celebrate. If not, I go back to #1 and generate a different set of selection criteria.
.
Should Briffa or another of the tree ring clan define selection criteria before collecting data (eg. all trees of a certain species on the north (+/-20 degrees) facing slopes of mountains, within 200 vertical meters of the tree line, 20 cm in diameter or more), and collect a random population that satisfies the criteria, then I think people would give their work a lot more credit. They are not fools, so they are probably aware of this. But I would bet that they would find little or nothing in an analysis based on those selected trees. Which is why they have resorted to methods which are so remarkably similar to data snooping, but with lots of added arm waves, and generate results which have so little credibility.
Sad to report Nick is backsliding at CA.
He’s back arguing about the detail of the techniques used in Gergis et al (and possibly suggesting he hasn’t read it closely) and ignoring the basic methodological question: did their pre-selection (or weighting as he prefers to call it) of proxies bias their results.
SteveF.
That is usually what they do. Theory directs them to select certain sites. Sites where they believe the trees will be “non complacent”
A non complacent tree is one where the growth has been limited by the desired factor– say temperature.
As for throwing trees out I think one rule you could use is a test for complacency. If you remove the age effects ( say using RCS) and you end up with a set of rings that are complacent that evidence that the trees growth was not limited by environmental factors. No signal in that tree. ditch it. If the tree is non complacent that’s evidence that there is some kind of signal in the rings.
Carrick & AMac,
You have a set of potential proxies and want to test a hypothesis that some linear combination of them can be used to predict temperature. You build a regression model on a calibration period. You test predictive skill on a verification period. What is post hoc here? I’m not arguing, just trying to understand.
Thanks.
Steven Mosher,
Site selection is fine. Throwing trees out from the selected sites, based on any pre-defined selection criteria you like, except correlation with temperature, is also fine. It is the selection based on what you are trying to measure (correlation with temperature) which is not fine, because it adds unknown and unknowable uncertainty. Data snooping by a different name, nothing more. (There are other less generous descriptions, often involving comparisons of the data with the product of the lower end of the digestive system.)
Re: SteveF (#98018) —
Upthread in Comment #97985, Nick Stokes wrote:
Your (SteveF’s) Comment #98018 is a helpful statement of the problem. Contra Nick’s #97985, IMO it is consistent with what other commenters have offered.
.
I would take limited exception to one sentence of yours. In discussing the shortcomings of a “data snooping” approach, you write:
“And you have no way to calculate uncertainty in the results of the analysis.”
Rather, investigators can perform the uncertainty calculations. It is simply a matter of opening starting the software package (Excel – Matlab – R – etc.), inputting the data files, and running the selected routines. Alas, computers lack a “Watson”-like consciousness that would warn, “I’m sorry, but your experimental design means that the statistical measures that I have just calculated are not valid.”
AMac (Comment #98032),
You are right. I should have been more clear: With a data snooping approach you have no way to calculate valid uncertainty in the results of the analysis.
Nick Stokes,
I will make one final comment on this subject, and no more.
.
Suppose one of Briffa’s grad students notes that most of the trees from a certain site (like Yamal) which appear to respond to temperature share some identifiable trait: say, on average a larger number of branches with pine cones per unit height. Through careful work with a molecular biologist, the grad student confirms the growth habit is the result of a certain shared gene; an uncommon gene which seems to make that species of tree much more sensitive to temperature near the limit of the species’ range. Accepting or rejecting cores based on the presence or absence of the unusual gene is perfectly defensible (and, I would add, very good science). This is a fundamentally different exercise from selection of trees based on correlation with temperature.
.
I hope, but am not certain, that you can appreciate the difference.
Lazar, it’s not whether it’s post hoc that causes the problem, it’s the problem that you don’t know what happens to the correlation between your multivariate proxy and temperature pre-instrumentation data. If you select on one interval of the instrument data, then verify (not the same as validate) on a second interval, that doesn’t demonstrate that your selection remains temperature limited over the entire history of the reconstruction. That remains an untestable hypothesis.
It’s still the correlation is not causation fallacy, because fo the fact know you have a multivariate proxy like tree-ring proxy and can’t argue plausibly that “temperature limited now means temperature limited forever”. You can always say [X] just ’cause [*] as an explanation for why the correlation persist for periods where it hasn’t been tested, but good luck in any field besides climate science getting that through the referees.
To go further, if there is a temperature period for which you are withholding verification tests because you “know” it’s not going to verify that’s a another huge red flag (this is an example of “cherry picking” your selection and verification periods).
The fact your selection criterion is not “statistically neutral” is of course another issue. I would argue that if you “knew” your proxy only responded to temperature this is solvable.
The uncertainty is unknowable because you have no quantitative way of determining whether Nick’s “weak uniformity principle” remains valid outside of the calibration period.
All this said I’ve a bit more than hinted that the “good” reconstructions don’t rely soley on selection based on correlation, Moberg is an example
I suspect somebody like Ljungqvist or von Storch would ask Nick to “please, stop helping us now”. 😉
[*] As in, we assumed the correlation will persist because “our cause is just, our motives are pure.”
Lucia,
Best wishes and prayers for your Dad on Father’s Day.
Andrew
SteveF says:
“1. I think the trees which are subject to XYZ conditions are very sensitive to temperature.
2. I collect samples from trees that live in XYZ conditions.
3. I test if if they correlate with historical temperatures. If so, I do a reconstruction, write it up and celebrate. If not, I go back to #1 and generate a different set of selection criteria.”
.
I think steps 3 needs to be
.
3. I show that XYZ correlates with historical temperatures, and using population/sampling statistics, has significance, write it up, and celebrate. If not, go to step #1.
.
Only then can you go to step 4: do a reconstruction, write it up and celebrate again.
.
In other words – show that there are indeed trees that truly respond well to temperature beyond random chance.
Lazar (Comment #98029) —
Carrick and SteveF understand the nuts and bolts much better than me; their points of view jibe with what I do know, and what I observe in other fields (e.g. clincal trials as mentioned in #97771).
A thought experiment. Consider investigators X and Y.
X goes off to site A in Siberia to measure treerings for making a new paleo recon. There, X cores 100 larches. He establishes that the correlation between the treering width and local temperature during the 1901 – 2010 screening period ranges between 0.12 and 0.24. He goes on to use those 100 cores to build a paleotemp reconstruction for the 1000 – 1900 study period, setting n to 100 in his software package. It calculates that the average temperature uncertainty for his recon over that period is 0.35 C.
Inspired by X, emails him for his methods, then heads off to site B in Siberia. There, Y cores 100 larches — but to his dismay, the cores’ average correlation to local temp (1901 – 2010) is way below 0.12. To address this, he cores 10,000 more larches, and screens them against the local temperature record, setting a lower boundary of 0.12. In this way, he compiles 100 qualifying cores with a correlation at or above 0.12. He goes on to use those 100 cores to build a paleotemp reconstruction for the 1000 – 1900 study period, setting n to 100 in his software package. It calculates that the average temperature uncertainty for his recon over that period is 0.35 C.
Should we have equal faith in these two researchers’ findings?
Carrick,
“The uncertainty is unknowable because you have no quantitative way of determining whether Nick’s “weak uniformity principle†remains valid outside of the calibration period.”
I agree that the unconditional(?) uncertainty is unbounded without having a handle on causal mechanisms. I think you are claiming that repeated observations of a process cannot be used to make predictions unless the underlying causal mechanisms are relatively understood? Would this be an argument against induction and would Bayesians have a counter-argument? If causal mechanisms were understood well enough to be confident in the “weak uniformity principle”, would statistical modelling be redundant?
“good luck in any field besides climate science getting that through the referees”
I was under the possibly entirely incorrect impression that purely (or nearly so) statistical modelling is acceptable in time series modelling and econometrics for forecasting? Provided it is stated upfront what uncertainties are conditional on what untested assumptions, and there are no better options, why not publish?
Thanks for your time.
AMac,
Thanks for the reply.
Clearly the uncertainty for researcher Y is larger than stated, yeah I get this is an example of post hoc.
As it was a thought experiment, what follows isn’t necessarily relevant…
I’m under the impression that core selection for chronology building is by correlations between cores.
Provided that an instrumental verification period is absolutely unused in model building, including screening, does this screening bias thing effect verification stats, or indeed uncertainties when they are based on verification performance? My interest is purely for my own work, not arguing the merits of others.
Thanks!
Lazar:
No because you still have noise in measurement. Statistics were invented to handle the case where you have a physical model and data with noise. They weren’t intended and shouldn’t be used to infer cause-and-effect relations, other than in the sense of … forming hypotheses whose validity should then be tested by direct measurement.
Because Nick’s “weak uniformity principle” is simultaneously a) an unfounded assumption and b) appeal to non-existent authority. In other words, it’s junk science and should remain unpublished.
sent comment previously ? 2 days ago not publshed ? any feedback as why?
angech– There’s nothing in the spam filter. Some comments get munched sometimes.
Lazar (Comment #98101) —
> I’m under the impression that core selection for chronology building is by correlations between cores.
In that regard, it seems to me that there’s an opportunity for a sanity check in the runup to the Little Ice Age, for Europe and other places where it was known to take place. The group of selected proxies have a certain concordance for the recent calbration period, when temps were rising. Fulfilling the conditions of uniformity, It follows that the group should exhibit comparable concordance during the reconstruction period. Thus, they should track the temps-falling time frame at the onset of the LIA. I don’t know if such an assessment has been tried.
“The uncertainty is unknowable because you have no quantitative way of determining whether Nick’s “weak uniformity principle†remains valid outside of the calibration period.”
It’s even worse. We know there is variation outside the calibration period. That’s what the divergence problem is all about. In any other field, a proxy that was shown to stop being a proxy for unknown reasons would be regarded as invalid and results obtained using that proxy would be ignored. Instead, climate scientists defend these to the bitter end. It’s absolutely amazing. Even if there was no screening fallacy (which it seems clear there is), the reconstructions that rely on treerings are worthless. If trees stopped being thermometers recently, they could have stopped in the past.
Stephen—
Out of curiosity, in the construction where ‘the divergence’ appears, was correlation screening used? Did the calibration period end before the end of the temperature data. Tomorrow, I’m going to see if I can create a decline using screening mathemagic.
Lucia, are you talking about Briffa 01? If you are I don’t believe there was any screening.
Carrick, Lazar et al – having breezed to the bottom of this thread without reading much of the statistics in detail (I think I understand the issues pretty well but not the specific details due to lack of time spent on it) – I have to say, I think you are both right.
Let’s say I have a set of possible proxies. I screen for correlation over one time period. I verify against another time period, then another, then another, etc. etc. How mayn “anothers” do I have to have to “validate” my choice of proxies? In some sense, the correct answer would be “infinity” (I’m guessing, for most physicists). In some sense, the more verification, the more educated the guess. We’ll never be able to guess away stochastic variation or lack of stationarity over long periods. But lots of people get away with calling this science, including economics as Lazar noted. Lazar, I think your comment 98094 is insightful.
As with so many things, you can be right in some sense and still be technically wrong.
Lazar:
Do you know a reconstruction that does this? This is a serious question, I’m looking for an example where this internal consistency testing gets done.
I’d say typically most of the reconstructions I’ve seen screen by calibration for circa 1900-1960 then verify against the instrumentation record for circa 1850-1900.
(An alternative form of the screening fallacy involves constructing finite weights based on how strong the correlation is in the calibration period… after all screening is just setting weight values of W=1 or 0 based on whether r ≥ r0).
I’d hope somebody who’s going through the code on some of these algorithms could chip in and help on this one…
You could look for internal consistency (that’s how I’d proceed), then you’d have some guarantee if it passed internal consistency, that what you had was a signal of some sort.
You still need to bridge the gap from there to saying your signal was temperature related… we could almost unambiguously say in the case of tree-rings it’s a measure of climate, it could be a measure of how ideal conditions were for plants/trees for example.
Concluding whether, for these particular tree, the index is also just a measure of temperature is a harder task.
This of course then leaves open two potential problems:
1) If the the cores selected for having a high correlation from 1850-1900 in the first place then the procedure as written is still susceptible to the first screening fallacy (and there could be second one hidden afterwards).
2) Do they simply throw away the ones that don’t verify and keep the ones that do? That would make this indistinguishable from just double screening without calling it “verification”. Or do they throw away the whole site if too many don’t verify? If it’s the former, we can do that problem. It didn’t help the “hockey stick carved out of red noise” problem. It just makes the hockey sticks look ‘more interesting’ and we throw a higher fraction away.
Lucia:
They don’t toss any of them, they look at what percentage pass their verification statistics and make arguments on the chance of this happening by accident. It’s my impression that they mess this up (for example by using low-pass white noise proxies instead of red ones). Jeff has some related comments here.
Carrick, I suspect that large numbers of proxies are not even archived. The researcher will look at the modern period and if the rings go the ‘wrong’ way, write the core off as a bad core.
This is a classic default setting for the inexperienced.
People will run repeats on a ‘successful’ experiment, say six time, than pick the best four, justifying the exclusion of two because they were ‘wrong’. They then do statistics on a n=5.
I have observed this being done by people who should know much better.
The same people are not aware that when you cut and past an Excel plot directly into a Powerpoint presentation you also place the entire workbook in there as well.
Carrick
Really? Really?!
Consider my case of 100% samples have a signal with R=0.25. If I screen I screw things up. If I screen and then “verify” that way, of course, the screened proxies will “verify” because the screened proxies still have R=0.25 and so would have passed in the first place. But you would still get the bias I discussed in the previous posts. This verification does nothing to solve the problem.
Ok. I can replicate that and show what happens in a toy problem.
What that verification might do is show that you aren’t just working with screened white noise. But there should have been other ways to see if you were working with a bunch of not-proxies. One of them is to just compute the average correlation over the whole batch in the first place. It better be positive and the magnitude better be statistically significant.
Carrick,
AMac wrote,
“he cores 10,000 more larches, and screens them against the local temperature record, setting a lower boundary of 0.12. In this way, he compiles 100 qualifying cores with a correlation at or above 0.12. He goes on to use those 100 cores to build a paleotemp reconstruction”
I responded,
“I’m under the impression that core selection for chronology building is by correlations between cores.”
I may well be wrong about throwing tree ring series out based on inter-series correlations, it’s just something I seem to recall reading. Regardless, the procedure is to take two or more cores from a single tree and average them to form a tree ring series. This is done for multiple trees in a site, then the tree ring series are either averaged to form a site chronology, or else averaged with tree ring series from multiple sites to form a regional chronology. It’s on the chronologies, in reconstructions using multiple chronologies, where screening against climate variables occurs. I have never read of this kind of screening being done on individual tree ring series. For internal consistency testing, typically a mean inter-series correlation is reported, which as far as I have seen is always positive and typically around 0.6 – 0.8. Correlations between chronologies within the same region and in similar ecological positions tend to be lower, say around 0.3-0.6. For an example of a reconstruction; D’Arrigo et al. 2004, “Temperature variability over the past millennium inferred
from Northwestern Alaska tree rings”: The standard reference on chronology creating is Cook 1987, “The decomposition of tree-ring series for environmental studies”. Free pdfs of both can be found online.
Thanks
Lazar
I don’t know whether the screening is on individual trees or on chronologies and for the purpose of this cartoon discussion I’m not concerned about it because that detail doesn’t matter to the issue at hand. What matters is the screening against climate variables occurs at some point. You can just switch the choice of words to choosing a series based on correlation.
This is useful and seems like a good way to minimize the likelyhood that the trees in the series don’t share a common signal. That would seem like a good practice to me. But this practice existing wouldn’t mean that someone couldn’t at least hypothetically do the other one. (They shouldn’t… but it doesn’t mean it’s never done.)
This then would justify my use of R’s of 0.25 and 0.50 in my more recent example. I call the series “treenometers”– but we can just consider the “treenometer” to be a site chronology or a regional chronology.
That the screening could potentially happen at three separate levels does not make the bias go away. The potential for bias creeps in the moment the screening is done at any level, it only has to happen at 1 level, and if it happens at several, the potential bias would be aggravated.
Worse: To the extent that the person making the final reconstruction might not know if a screening was performed at a lower level, that’s just dangerous. If the consequences of screening bias are not understood, the possibility that something is done and a person failed to report exists.