I’ve had my head in the sand doing other things. But I saw this in my logs:
Super-mega leak. This was bound to happen. I’m going to have to go snag copies of everything now (as if others aren’t doing it simultaneously. Tapping foot… slow…slow… mega slow…)
Those who’ve read it, tell me what’s most exciting. 🙂
Not worth it’s own post
BTW: A while back Josh asked how my first name is pronounced. These singers pronounce it correctly.
Now: everyone should go get some cookies and Lucia cakes to eat on St. Lucia’s day. ‘Cuz it’s today. 🙂
Haven’t read it yet, but I’m betting that more solar means less aerosol and the sensitivity range remains the same.
If you look at EPICA Dome C you will note that maximum range of the last 800 ky is 16 degrees and that insoluble dust (aerosols) range so that max is equal to 500 times min; 2.7 orders of magnitude.
The plots of log(dust) vs Temperature are also better than CO2 vs temperature.
Downloading is slow. I’m most interested in 9,10,11, 12. I’m snagging before the vanish. Tomorrow… I’ll stop looking at my ‘bot data (of which I had accumulated quite a bit.)
I have not managed to download anything. I am still trying to do 13, sea level.
Off topic and old, but possibly of interest to this forum:
Journal of Political Economy > Vol. 100, No. 6, Dec., 1992
http://www.academia.edu/818308/Are_all_economic_hypotheses_false
Our knowledge of the distribution of test statistics allows as to examine a set of tests that fail to reject null hypotheses and ask the following question: does the distribution of these test statistics conform to what we would expect if a prespecified fraction of the null hypotheses were in fact true? In other words, we can use the results of classical hypothesis tests to in turn perform a classical test of the hypothesis that a fraction Ï€ of null hypotheses are true. We perform such a test,and find that we can reject at the .05 level the null hypothesis that more than about one-third of unrejected null hypotheses–more than one-eleventh of all tested hypotheses–are true. Moreover,our point estimate is that none of the unrejected nulls is true.
Doc–
I’m getting some. It’s s_l_o_w. I went and sauted oninon during one download…. I’ve prioritized my order of downloading. I’ll be reading tomorrow. I got 9,10,11. 12 is downloading… my mac says 29 minutes more… I’m going for the summary for policy makers and technical summaries next. After that, I’ll start snagging others… well.. until Jim comes home. Then we’ll eat dinner and I’ll just pop in and out to download as is convenient.
WUWT is getting in a tizzy about the section in Chapter 7 on GCRs (e.g. 7.4.5). Maybe I’m missing something, as I don’t really see anything objectionable in there, and they conclude that there is strong evidence against GCRs having an impact on temps over the last half century.
I general, I think the AR5 is much more comprehensive than the AR4 in a number of areas. Chapter 2 on surface observations is particularly good (and I’m only slightly biased because they cite my paper :-p ).
DeWitt Payne,
As far as I can tell, there is no groundbreaking reassessment of solar forcing. Just cherry-picking.
Zeke–
That may be so. I saw some of the leaked first draft and thought it was better written. Of course I anticipate I’ll disagree with some stuff- but chances are everyone will find something to disagree with. That said, I’m getting the solar chapters later on.
Right now. I’m just plodding through and downloading.
I wasn’t going to sign up and I wasn’t going to leak them. But… well…. I’m curious. I’m going to read them now. (I anticipated this would happen. Who didn’t?)
DeWitt 107366,
Not sure I see your logic. If there has been greater warming due to solar influence then the aerosol influence has to be greater, unless you also say that climate sensitivity is lower.
Lucia,
I gave up after ~15 with little progress. After you get what you want, can you grab the sea level chapter?
SteveF: My take on the logic was that the ‘if’ in your proposition is not supported by the text when read in context. Not read the context myself so don’t have a view.
I’m on “technical summary” right now. It says 54 seconds…. I should be able to snag Ocean next!
I’m downloading “sea-level”. My mac says it will take 50 minutes. Jim should be home for dinner soon… maybe around dessert time Chapter 13 will finish.
Clearly, these need to be zipped?
Lucia,
Yes zipping makes a lot of sense. Maybe someone with the initials LL coud zip them. 😉
As I suspected, no real change in solar forcing estimates, despite the histrionics by Rawls: http://i81.photobucket.com/albums/j237/hausfath/ScreenShot2012-12-13at43419PM_zps4a925dbf.png
Ok… I’m getting server “We are having a bit of a problem” messages. I suspect server overload… but who knows. Clearly, between all the people downloading this this is now “out”.
Zeke, I notice your png shows a slight cooling due to aerosols.
7 Pinatubos worth of SO2 around 1975/80, and then a 1 Pinatubo drop in SO2 from 1980 to 2000.
And yet …
“A paper published today in Global and Planetary Change finds solar radiation at the Earth surface in Spain “shows a significant increase over the 1985-2010 period” of “+3.9 Wm-2 per decade”
http://hockeyschtick.blogspot.ca/2012/11/new-paper-shows-large-increase-of-solar.html
And there are many papers showing that clean air legislation results in lower aerosols and large increases in sunshine from 1980 to 2000 or so.
AR5 is just another joke.
Zeke,
Thanks for posting that graphic. I think It shows a very big increase in the best estimate of net forcing compared to AR4, due in part to falling estimates for secondard aerosol effects. Hummm.. If you subtract 0.5 watt per square meter for accumulation, you are left with ~1.8 watts yeilding ~0.85C warming (effective sensitivity of <0.5 degree per watt.
SteveF is right, new we have indirect aerosol effects on clouds 3.6 W/m2 is 1.7 degrees.
Alternate links have been posted on WUWT. The new links are buried in the comments so I’ll post them here to save you searching for them.
Alternative links for AR5 WG1 SOD. At each page click on the button that says “create download link,†then “click here to downloadâ€:
Summary for Policymakers
http://www.peejeshare.com/files/363425211/SummaryForPolicymakers_WG1AR5-SPM_FOD_Final.pdf.html
Chapter 1: Introduction
http://www.peejeshare.com/files/363425214/Ch1-Introduction_WG1AR5_SOD_Ch01_All_Final.pdf.html
Chapter 2: Observations: Atmosphere and Surface
http://www.peejeshare.com/files/363436270/Ch2_Obs-atmosur_WG1AR5_SOD_Ch02_All_Final.pdf.html
Chapter 3: Observations: Ocean
http://www.peejeshare.com/files/363436276/Ch3_Obs-oceans_WG1AR5_SOD_Ch03_All_Final.pdf.html
Chapter 4: Observations: Cryosphere
http://www.peejeshare.com/files/363436279/Ch4_obs-cryo_WG1AR5_SOD_Ch04_All_Final.pdf.html
Chapter 5: Information from Paleoclimate Archives
http://www.peejeshare.com/files/363436282/Ch5_Paleo_WG1AR5_SOD_Ch05_All_Final.pdf.html
Chapter 6: Carbon and Other Biogeochemical Cycles
http://www.peejeshare.com/files/363436285/Ch6_Carbonbio_WG1AR5_SOD_Ch06_All_Final.pdf.html
Chapter 7: Clouds and Aerosols
http://www.peejeshare.com/files/363436286/Ch7_Clouds-aerosols_WG1AR5_SOD_Ch07_All_Final.pdf.html
Chapter 8: Anthropogenic and Natural Radiative Forcing
http://www.peejeshare.com/files/363425217/Ch8_Radiative-forcing_WG1AR5_SOD_Ch08_All_Final.pdf.html
Chapter 8 Supplement
http://www.peejeshare.com/files/363436312/Ch8_supplement_WG1AR5_SOD_Ch08_SM_Final.pdf.html
Chapter 9: Evaluation of Climate Models
http://www.peejeshare.com/files/363436298/Ch9_models_WG1AR5_SOD_Ch09_All_Final.pdf.html
Chapter 10: Detection and Attribution of Climate Change: from Global to Regional
http://www.peejeshare.com/files/363436302/Ch10_attribution_WG1AR5_SOD_Ch10_All_Final.pdf.html
Chapter 11: Near-term Climate Change: Projections and Predictability
http://www.peejeshare.com/files/363436303/Ch11_near-term_WG1AR5_SOD_Ch11_All_Final.pdf.html
Chapter 12: Long-term Climate Change: Projections, Commitments and Irreversibility
http://www.peejeshare.com/files/363425220/Ch12_long-term_WG1AR5_SOD_Ch12_All_Final.pdf.html
Chapter 13: Sea Level Change
http://www.peejeshare.com/files/363425221/Ch13_sea-level_WG1AR5_SOD_Ch13_All_Final.pdf.html
Chapter 14: Climate Phenomena and their Relevance for Future Regional Climate Change
http://www.peejeshare.com/files/363425222/Ch14_future-regional_WG1AR5_SOD_Ch14_All_Final.pdf.html
Chapter 14 Supplement
http://www.peejeshare.com/files/363436309/Ch14_supplement_WG1AR5_SOD_Ch14_SM_Final.pdf.html
Technical Summary
http://www.peejeshare.com/files/363425223/TechnicalSummary_WG1AR5-TS_FOD_All_Final.pdf.html
They have alternative download links posted in the comments at WUWT.
Anthony has posted the links now in his “Update 2” on the story… save you sifting through the comments looking for them.
I’m new here so cast nerfballs instead of stones:
Leaked AR 5 Climate Models:
“While there has been substantial progress since the AR4 in the sophistication of assessing the reliability of the ensembles and evaluating whole ensembles of climate models against observations, there is to date no robust strategy for how to weight different models based on their performance within an ensemble (Section 9.8.3).”
Isn’t this the same problem as before? the math isn’t ready for probability density functions tied to non-linerity and non-equilibrium?
Me more asking than telling.
Re: SteveF (Dec 13 17:36),
You’re right. I had it backwards.
I notice that the error bar on indirect aerosol effects very nearly includes zero effect.
Got a quick look at the sea level chapter, and especially projections of rise. The chapter is long, really, really long. Lots of hands seem involved (eg. “on the other hand”, repeated seemingly hundreds of times). Way too much credit and page space given to the non-physical Rahmstorf-style ‘semi-empirical’ models, which uniformly project enormous sea level increases. The physically based models continue to indicate relatively modest increases, but maybe 20% higher than AR4.
.
My overall impression: they really are not at all sure what will happen, which explains all the caveats, but they do seem more up front about that uncertainty than in AR4, which I guess qualifies as progress. They still seem unable to just discount crazy studies, and so they generate averages which include the nutty stuff. Oh well.
Is AR5 just a summary of science that was already available, or some of it new?
SteveF
At anthony’s, and update says someone(s) created a RAR. I still only have a subset. By the time I have them all, the problem will already be solved. Let’s face it, alec posted these–and everyone wants them all at the same time!
Jane–
In some sense, it’s supposed to only be a summary of science already available. However, this can include material that was accepted into journals but not yet available to the public — with acceptance up to a certain date. The authors are not, themselves, supposed to do anything “new”.
That said, the actual projections and language generally do not pre-exist in some journal. The data from the computer runs on which projections are based pre-exist — but how to synthesize some of this is — to some extent– the work of the committee. I don’t know how the interpret the rules in that regard.
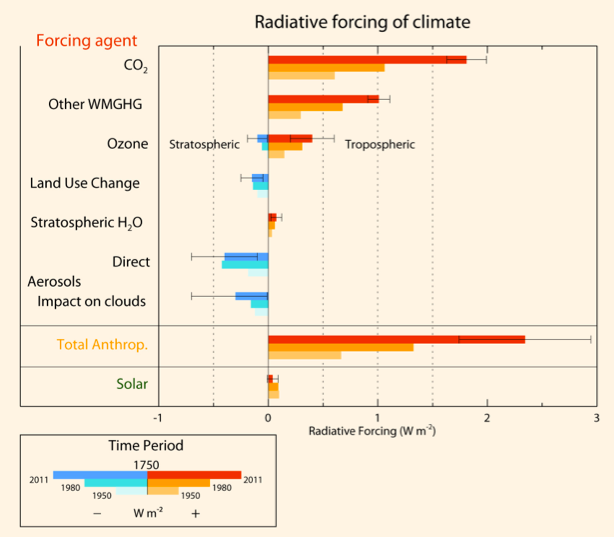
The comparable AR4 version to the AR5 posted by Zeke can be seen here:
see here
As Zeke points out, solar forcing is about the same.
Hmm. From the graphic above, what explains all the pre-WW2 warming? Will have to read it now for exciting explanation.
Comparing the two forcing diagrams, estimated net anthropogenic forcing has gone up quite a lot. The forcing due to CO2 has gone up a bit, but the estimated -ve forcing due to aerosols has gone down. Looks like about +0.7W/m2 difference in total forcing between the two diagrams.
The scale has changed from -2 to +2.5 in AR4 to -1 to +3 W/m2 now, showing the reduced impression of aerosols and the higher total +ve forcing.
Don’t know why land use change is -ve, and not sure what has become of black carbon.
The graphics show a difference of about 1 W/m2 between the two reports.
The temperature is the same as in the two reports.
Climate sensitivity must have changed.
Carrick,
An argument can be made that the IPCC is a little schizophrenic about it. If there is considerable evidence for non-TSI solar influence, then why/ how does that not qualify as a solar forcing?
That forcing graphic Zeke posted, with current plus two past forcing estimates, looks nothing like the recent forcing profile used in the GISS model E runs, where aerosols have consistently offset ~50% of GHG forcing starting in about 1900. Hummm… More schizophrenia? If the judgement of the IPCC is accurately represented by that graphic, then it is hard to see how is there any credibility in model projections based on very different forcing.
SteveF:
This does seem like a conundrum. (I believethe picture gets even less tidy the more you look at it.)
SteveF (Comment #107401),
The total aerosol forcing at http://data.giss.nasa.gov/modelforce/ is ~ -1.4W/m^2 which is within the range shown in the AR5 draft. However, I’ve been informed that the forcing time series on that page does not relate to the GISS-E2 historical runs for CMIP5, but is the result of an inverse modelling exercise performed in one of Hansen’s recent papers.
Actually, in AR4 almost all featured models produced negative aerosol forcing below (above?) the IPCC’s “best estimate”, a couple even had net zero/positive forcing, which was outside the estimated range in chapter 2. This time around I suspect a few models will have historical aerosol forcing outside the range estimated in the forcing chapter, at both ends of the scale.
Regarding projections, all RCP scenarios have sulfate emissions reducing nearly to preindustrial values by 2100 so aerosols aren’t particularly important by the end of the century.
Paul S,
The graphic at the page you linked to for GISS net forcing shows ~1.6 watts/M^2 net man-made at present. The graphic above shows ~2.35 watts/M^2, with an uncertainty range of ~1.7 to ~2.95. It’s hard to see how the GISS number is consistent with the graphic above. Further, the above graphic shows a 1980 value of ~1.3, while the GISS graphic is closer to ~1.
.
It seems to me that if those people who are judged by the IPCC to be able to evaluate net forcing come up with a best estimate of net forcing, then the modeling community should, at a minimum, be required to run the IPCC best estimates for IPCC projections, not whatever combination of forcings and aerosol offsets they happen to like.
.
Not insisting on common historical forcings for the models is IMO a bizarre disconnect in the whole process. If the GISS model (and many of the others) were run with the above estimated forcing, I am quite sure the discrepancy between the model projections and recent temperature history would be obvious, with the models running far too warm. All I am saying here is that the process of relying on projections from models which are in no way constrained by the best available data, and each of which uses a different assumed forcing history, is very strange indeed; how will anyone ever be able to differentiate between accurate and inaccurate model parameterizations (like cloud behavior) if the models are not at all constrained? So long as modelers can use the aerosol kludge in any way they want, we will never know which models are ‘good’ (if any) and which are clearly ‘bad’.
“BTW: A while back Josh asked how my first name is pronounced. These singers pronounce it correctly.”
My hearing is not as good as it should be, but I am wondering whether we refer to you as Saint Lucia or is it better pronounced Sant Lucia. I think that title means even more in a secular sense.
The leaker rationalizes the timing of the leak by noting that the secretive agreement was intended to avoid blog discussion during the review process, but the leak came after the fact. In other words, the lack of transparency in the process avoided any influence from discussion outside the process and the leaker’s timing of the leak did not impede that lack of openness. I do not find that action particularly heroic.
SteveF (Comment #107404)
I agree wholeheartedly.
SteveF, Paul S –
According to http://data.giss.nasa.gov/modelforce/Fe.1880-2011.txt, GISS is using the net present anthropogenic aerosol forcing of -1.65 W/m^2. However, as it notes on that page, only 1880-2003 is from GISS Model-E, whereas 2004-2010 appears to come from the “assuming a specific sensitivity and a simple energy balance model, what would the aerosol forcing need to be?” inverse modeling procedure from Hansen’s 2011 paper, as Paul S mentioned.
Shindell et al. (2012) “Radiative forcing in the ACCMIP historical
and future climate simulations” has the GISS-E2-R aerosol forcing in 2000 as -1.10 W/m^2, whereas in 2000 in the above file it has -1.46 W/m^2, so as Paul S also notes, it could be that GISS-E2 suggests a smaller magnitude for the aerosol forcing than GISS-E. This could also come from a difference between the “Adjusted” and “Effective” radiative forcings.
Kenneth,
” I do not find that action particularly heroic.”
.
Breaking a promise seldom is. Alec may find he is not going to be allowed to review again.
.
Still, the whole secrecy thing strikes me as unjustified, since the process is supposed to be based on consolidation of published (or accepted to be published) work. In my darker moments, I suspect the cloak of secrecy is intended only to hide the kinds of normal scientific disagreement we should expect, and strengthen the frequently trumpeted claim that the ‘consensus’ view (which is in fact the consensus view of a few top dogs in each group) is beyond question. Public scientific arguments about what papers are better and why would put the lie to that, and show exactly who does and who does not fully support the ‘consensus’. But maybe there is a more positive explanation for secrecy.
Troy_CA,
“assuming a specific sensitivity and a simple energy balance model, what would the aerosol forcing need to be?â€
.
I think the evidence is clear that is pretty much how it works for the entire historical period, not just since 2004, and not just for GISS model E. The process of choosing a forcing history to use for each model is less than rigorous if the goal is to evaluate model accuracy.
SteveF (Comment #107408)
“I suspect the cloak of secrecy is intended only to hide the kinds of normal scientific disagreement we should expect”
It’s SOP in normal commercial endeavors to have a cloak of secrecy about a product until the ‘marketing campaign’ has been organized.
WWF/Greepeace et al will all receive a ‘leaked copy’ of the IPCC report before it’s released so they can organized their propaganda campaigns.
Troy_CA & SteveF,
You’re both looking at the effective forcing, whereas I’m looking at the RFs in the top panel, which are more relevant to the process-based estimates in the IPCC chart. The new AF metric complicates matters because it involves some adjustment in the troposphere, but I don’t know if effective forcing would be the most relevant for comparison in that case either.
Kenneth
I wouldn’t call it heroic. I think it was inevitable. And of course many things aren’t heroic.
Yep. And Moncton won’t be admitted to any IPCC things anymore either. I suspect both anticipated that penalty before doing that which will result in the respective penalties.
With respect to myself– I wasn’t going to promise not to leak and then leak the thing. But I expected it to leak. I think the IPCC”s decision to impose opacity was silly, self-serving and futile. I think their goal was to try to be “the ones” to impose their spin. But they way they went about it guaranteed that someone else would seize the opportunity to do something that gave an outsider a chance to spin things the outsider’s way.
I have no idea why anyone in the IPCC thought their attempts to pretend to be transparent while maintaining opacity was going to work. Presumably, it’s the sort of idea that survives in a committee that is used to forgetting that outsiders often do not have to comply with the committee’s wishes, policies, choices or whatever.
Paul S (Comment #107417),
Please clarify what you are trying to saying. Are you saying that there is not a big change from AR4 in the best estimate of man made forcing? Are you saying that the above graphic posted by Zeke, and the corresponding graphic from AR4 (linked to by Carrick) are not comparable graphics? If not, why not?
But what is the total aerosol forcing from 1980 – 2000? It must be positive since SO2 dropped by 1 Pinatubos worth of SO2 from 7 Pinatubo’s.
I don’t care what the forcing is from 1750. I want to know what it is for the short 20 year period that the CAGW alarmists claim is a harbinger of doom/
SteveF,
No, I’m talking about the GISS forcings. Troy and yourself are looking at the effective forcings on that page. These are not the same thing as the “pure” RF values in the AR4 and AR5 tables because they are diagnosed after the troposphere is allowed to adjust.
Perhaps you haven’t seen it, but in the AR5 forcing chapter they also give a new ‘AF’ estimate, which is a diagnosed forcing found after tropospheric adjustment. This was introduced to allow clear quantification of some aerosol indirect effects which were not included in the AR4 table. This relates to the total aerosol impact on forcing, whereas RF can only fully record the direct effect + cloud albedo effect, and has a range of -0.1 to -1.8, with a best estimate of -0.9W/m^2.
Paulo S,
OK, I think I understand what you are saying. The web page you linked to does not make clear that there is more to the “net forcing” than a simple summation of the individual components.
.
Based on what I read in the AR5 chapter, on net there is not a lot of difference between the AF estimate (-0.9 W/M^2) and the sum of the direct and indirect effects (graphic posted by Zeke), which is also close to -0.9 W/M^2.
.
The chapter authors appear to make clear that the new estimates of aerosol effects are smaller than the AR4 estimates.
lucia (Comment #107418)
My comment was intended to point to the leaker’s seemingly good intentions of making the process more transparent, but in fact the leaking was done after it would have made transparency useful with regards to discussion outside the process. If indeed this is the first major leak and it came after the fact then I would say that the contributors to this process were rather good soldiers – in maintaining opaqueness.
SteveF (Comment #107404)
I took your comment here to mean that models that used different scenarios – as in Scenario A, A1, B, C etc. -are difficult to compare vis a vis differentiating the models performance given the input versus looking at climate output that is affected by both differing input and the model performance itself. Your reference to aerosols would I guess go further where the models could use the same input (amount of aerosol) but attribute to it different quantitative effects.
What bothers me generally is that models can only truly be tested with out of sample observed data. What I see with models outputs that have been obtained several years back is that some have made forecasts with a given scenario of inputs and from those we can only debate how much the difference with the observed climate is due to the model and how much based on how well the input scenario matches the actually inputs. Since we would like to evaluate the model directly, the model would need to be re-run with the actual inputs and the output compared with the observed climate.
I have never seen this done. I would guess that part of the reason for this situation is that the modelers judge they are making continuous improvements in their models and are not motivated to go back and rerun with older model versions. That is too bad as out-of-sample is the only true test of these models currently available at least as I see it.