
GISSTemp posted their surface temperature anomaly for Jan 2009 here. The temperature anomaly dropped from 0.51 C to 0.41 C. Comparison to the cache showed relatively few changes in recent historic temperatures. Because I picked Jan 2001 as the start date for most my analyses, worth nothing the trend since January 2001 remains negative.
What if we look at 5 year running averages?
Some of you may recall that back in 2007, when rebutting the argument that global warming ended in 1998, James Hansen decided to recommend readers examine 5 year running averages in GMST.
It’s think interesting to look at the 5 year running averages today:

As you can see, the 5 year running mean has taken dip. Does this mean global warming has ended? Nope. Smoothed graphs aren’t particularly good splendid ways to figure out what’s happened to trends. That said, looking at this graph there is no reason to think the surface temperatures are no longer rising. A not too dissimilar dip not associated with any volcano occurred between 1984 and 1986. We came out of that one; we are likely to come out of the current one.
But when?
The weird thing about running averages is we have some ability to “predict” when they might tick up or down. In case you’re wondering when the GISS five year running average to is likely to tick up, the answer is: sometime before June.
Why? Well, the monthly anomaly dropped quite a bit between March 2004 and April 2004. If you examine the graph carefully, you’ll see the GISSTemp April 2004 temperature anomaly is lower than the Feb 2009 anomaly. So, if the temperature for March and April stays exactly where it is, the 5 year running average will tick “up” a little when the April 2009 temperature is replaced the April 2004 temperature.
Of course, we can be certain the uptick won’t happen sooner nor can we be certain it will happen at all. But it’s fun to watch these things. I’ll try to remember to show this graph either when a) the 5 year average does have a “uptick” or b) in June!
We all just have to hope that there are no more volcanoes in the next decade. Given that, we may just be able to get a clear picture of how the globe warms up. If temperatures stay largely flat for another decade and there are no volcanoes we will have learned something. If there are volcanoes perhaps we will not learn that much even with declining temperatures.
Alex
Large stratospheric eruptions or attacks from Mars would make it difficult to test predictive ability. The forcings driving climate models don’t include them in the future.
Since 1970 the 5 year trend has had minima centred about the years 1974, 1983, 1992, 2000, and 2006 (the current downtrend). The three largest volcanoes produced aerosol peeks in 1975, 1983, and 1992. There was a very large Nino/Nina switch around 1998/2000. So the timing of the early four downtrends is readily explicable. The current mininum is the deeper than that of 2000, very similar to those of 1983 and 1992, but not as deep as that for 1974. So it is signifiacnt but lacks any association with a dramatic event. So what has caused the five year trend to drop as much as it did for Pinatubo during an historically quiet time? Solar and PDO are obvious candidates but that would cast doubt on how much of the the dramatic period of warming was also solar and PDO.
I think the arguments are going to get very interesting, We have an effect, we will need to assign a cause.
(All data HadCRUt3, All calcualtions my own)
Alex
Alex
I suppose if volcanoes caused significant cooling in 75, 83, 92 — then, absent those volcanoes, the temperature gradient from then to now would be less (assuming there has been no comparable volcanic activity recently). This could imply less CO2 effect than hypothesized for that time period.
Alien92,
I would not get too excited. For the trend illustrated in Lucia’s second graphic; The El Chichon might make a bit of a difference as it is at the beginning of the period, Pinatubo is only a little before the middle of the period so it would do less. That said the long term trend as illustrated in Lucia’s second graphic probably would not change much, but every little helps. A significant amount of the variance is however due to the volcanoes. My point is that if one could convincingly remove the variance due to volcanoes, and major Nino/Nina reversals then the current downturn would appear much more of an exception. If the current downturn was the result of a volcano there would be no argument but it isn’t. It is true that the last 5 year period has gone from El Nino to La Nina conditions but nothing as dramatic as the period centred on 2000. So I consider that the “well its El Nina, it happens” type of explanation just a little unconvincing.
Alex
Oops La Nina!
Allen63, I do apologise, my eyesight is not what it was! But I should really get peoples names right.
Alex
Alexander,
I can easily relate to the eyesight related discombobulations 🙂
And, I do not disagree with your points. I was approaching it from the “every little bit helps” point of view.
Actually, I have this “feeling” that the last 30 years or so we had “level” temperatures for about the first 20 years. Then, a jump up caused by El Nino that lasted a few years to the present. Maybe we are now settling back to the nearly horizontal “gradient” and temperature levels that existed prior to the 1998 El Nino. My unscientific hypothesis might be helped if the volcanic effects were removed from that first 20 years.
By the way, my point is NOT visible when looking at 5 year averages GISS temperatures above. Rather, one has to look at the satellite data circa 1978 to present. I think GISS temperatures suffer from too much (well intended) manipulation and a preponderance of poor historical data sources (which are the only ones available globally) — garbage in, garbage out.
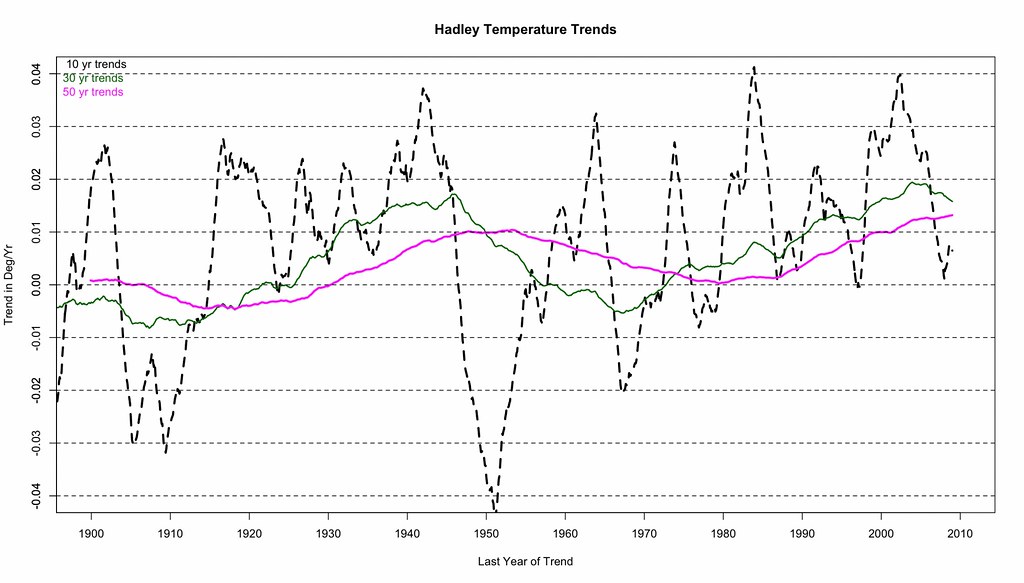
Ok, here’s another way of looking at the trends. This has all of the 10, 30, and 50 year trends for the Hadley temperature set. Each value is the trend for the preceding time period (i.e. the 2009 ten year trend is based on 1999 to 2009). The rule of thumb has been 30 years for climate, but notice the sinusoidal in the trends which is on the order of about 60 years when the trends get longer than 30 years. If the pattern continues the trend should go back to close to zero (in about 30 years).
Let me try that link again
trends graph
Hi Lucia,
Off topic a bit, but have you done an update since June 2008 of Hansen’s 1988 predictions versus surface measurements:
http://rankexploits.com/musings/wp-content/uploads/2008/06/hansenlineartrend.jpg
The next 2-3 years on that is going to be important, as “Hansen B” and “Hansen C” start to really separate over the next 2-3 years.
Thanks,
Mark
Mark– I haven’t updated that recently!