There is a cancer growing in the climate blogging world. It is a cancer of bad faith, a default assumption that the other side must be lying, stupid, or in the pay of someone nefarious. It manifests itself in one-sided discourses, and personal attacks, and in the blind rejection of results that do not conform to a specific world view.
I tend to be hard to rile up by nature, but a recent article on Fox News was too egregious to be ignored. It was not the criticism of data adjustments that was the problem (though this was somewhat unfounded, as I will discuss later), but rather the remark at the end attributed to Anthony Watts. He said:
 Is history malleable? Can temperature data of the past be molded to fit a purpose? It certainly seems to be the case here, where the temperature for July 1936 reported … changes with the moment. In the business and trading world, people go to jail for such manipulations of data.
I’m sorry, but accusing people that you disagree with of fraud, and even suggesting that they go to jail, is simply beyond the pale. Not only does it stymie any possibility of constructive scientific discourse; it is also blatantly unethical. Fraud should only be alleged in extreme cases when there is strong evidence supporting it, not simply because the results don’t match your preconceptions. If you disagree with someone’s approach and methods, the proper way to respond is to create your own approach and demonstrate that it is superior. That is the way science moves forward. To descend into personal attacks, to politicize the science, is deeply irresponsible.
This type of discourse also creates immense distractions for the scientists involved. Many of the folks at the NCDC have spent a significant portion of their time over the past three years dealing with two different GSA investigations, various congressional hearings, and the need to respond to media furors like the Fox News story. This is not to say that we cannot be skeptical of the results of scientists like those at NCDC, but rather that the correct approach to that skepticism is handled through scientific arguments rather than political or media attacks.
In the spirit of civility, I would ask Anthony to retract his remarks. He may well disagree with NCDC’s approach and results, but accusing them of fraud is one step too far. Given all the steps the scientists at NCDC have taken to publish their data and code, to make their papers accessible without a pay-wall, and to work with external groups to evaluate and verify their findings, there is no reasonable justification for the allegation of fraudulent behavior, and certainly not to suggest the scientific work they are doing is a jailable offense.
_______________________________________________________________
Now that that is off my chest, lets look at the evidence surrounding NCDC’s approach to homogenizing temperature data. Temperature data in the United States is imperfect. It is measured at weather stations that were not intended to create long-term climate records, and over the past century these stations have moved (e.g. from building rooftops to airports and wastewater treatment plants in the 1940s), the instruments have changed (e.g. from liquid-in-glass thermometers to electronic sensors in the 1980s), the time of day at which the temperatures were measured has changed (from evening pre-1970 to morning), and the environment around sensors has changed as cities have grown and more land has been developed.

(Click to Embiggen)
To correct for these issues, the National Climate Data Center (NCDC) at the National Oceanic and Atmospheric Administration (NOAA) has created methods to detect and remove so-called inhomogeneities (biases due to non-climate factors). This approach, called the pairwise homogenization algorithm (PHA), is an automated method that look for step-changes or spurious trends that occur at one station but are not seen at the same time in nearby surrounding stations. The idea is that climate operates on larger regional scales, and local changes not seen in the regional average are likely artifacts station moves, sensor changes, etc.
The net result of these adjustments, at least for the United States, is a significant increase in century-scale temperature trends. Notably, the same adjustments don’t have a particularly large effect world-wide, suggesting that some of the cooling biases corrected are specific to the U.S. (or, conversely, that parts rest of the world has too little station coverage to adequately detect breakpoints). The figure below shows both raw and adjusted contiguous U.S. temperatures from 1895 to 2012 (with a baseline period of 2004-2006).
Given the magnitude of the adjustments (and their direction), it is important to ensure that biases associated with things like station moves and instrument changes are being properly removed without introducing any additional bias. To this end, there have been a number of different efforts, both by folks within the NCDC and external groups that test and evaluate the effectiveness of adjustments. These include tests on synthetic data, the creation of pristine reference networks (e.g. USCRN), independent analysis and homogenization methods developed by the Berkeley Earth group, and comparisons to satellite records. Lets examine each in turn.
Tests with Synthetic Data

The best way to determine if an automated algorithm is working properly is to test it using synthetic data with know biases, and see if the algorithm correctly removes those biases and produces a result in-line with the “true†unbiased data. To that end, the folks at NCDC worked with Peter Thorne to create eight synthetic worlds. Each of these worlds had a “ground truth†created by sampling the climate fields of four different global climate models at the locations of all U.S. co-op stations. Each world then had different types of bias added in. Some worlds had negative net trend biases, while others had positive ones. Some worlds were characterized by lots of small break-points, while others had large breaks. Some worlds had good metadata documenting breakpoints, while others had little to no metadata or even false metadata. It is also important to note that this was a blind evaluation; the NCDC researchers did not know which world was which or what the “ground truth†of each world was prior to running the algorithms, removing any temptation to tune the algorithm to produce the desired results.
Overall, the PHA did quite well in this exercise, removing the majority of bias in all cases. It correctly cooled worlds. The figure below shows the results for one representative world. The raw biased data is in red, and has twice the century-scale trend of the true data, in green. The default run of NCDC algorithm is shown in yellow, with a few dozen variants of the algorithm (created by varying the breakpoint detection parameters and correction methods) shown in black. More details on this exercise are available in the Williams et al paper published last year, as well as our recent AGU poster.

Similar work has been done by a European group that tested the accuracy of the PHA-homogenized individual station records rather than regional temperature reconstructions, as well as other homogenization methods. It showed that the PHA was one of the better-performing methods (though not the best). There is still more work to do in the area, specifically around testing data with articial trend-biases added to individual station records rather than simple break-points, and it is quite likely that more papers will come out in this area in the next year or two. The new International Surface Temperature Initiative led be Peter Thorne (in partnership with NCDC) is putting a large focus on creating standardized tests and metrics for homogenization algorithms, for example.
The U.S. Climate Reference Network


Starting in 2001, the NCDC began to deploy the U.S. Climate Reference Network, a distributed network of stations with pristine siting, uniform instrumentation, frequent readings, and multiple redundancies to provide the most accurate possible record of U.S. climate change. Unlike the existing USHCN/co-op network, which was set up primarily to measure weather, USCRN’s purpose is to provide a continuous and uniform measure of the U.S. climate. Since 2004 there has been enough station data to create a temperature estimate for the full conterminous U.S. temperatures which, as shown below, are largely identical to those from the USHCN network.

This is clearer when we look at monthly data since 2004. While there are a few notable differences for individual months, the trends of the two are nearly identical over the 2004-2012 period, providing further evidence that the reported USHCN data is not far off the mark.
Â
The Berkeley Earth Project
 The Berkeley Earth Surface Temperature project developed their own homogenization process involving cutting station records at detected breakpoints, recombining station fragments using a least-squares method, and creating a spatial field via a kriging approach that applies regional correlation-weights to individual station records to down-weight divergent records. They use a larger set of stations than NCDC uses, as they can effectively integrate short non-continuous station records. Their results for the conterminous U.S., however, are effectively identical the homogenized NCDC data. While it is possible that both approaches suffer from as-of-yet undiscovered methodological flaws, the fact that an independent group using a significantly different homogenization approach found identical results should serve as a powerful validation of the NCDC’s approach.
Â
Satellite Data
 Recent work by John Christy and Matt Menne have resulting in an interesting comparison of UAH and USHCN data for the conterminous United States over the satellite record (1979-present). While minimum temperatures are more difficult to directly compare due to the decoupling of the nocturnal boundary layer, maximum surface temperatures show a remarkable correlation with satellite lower tropospheric temperatures (r-squared = 0.96, vs. 0.86 for minimum temperatures). Notably, UAH is much closer to the homogenized data than to the unhomogenized data, providing an additional independent validation of the NCDC’s approach. To forestall the obvious question, we would expect satellite TLT and USHCN records to be the same over the U.S., as there is no expected amplification over land areas.
The homogenization approach taken by NCDC is not perfect, and will almost certainly be improved in the future. Indeed, they just launched a new version of the code (v2.5) that is significantly better at detecting breakpoints. This is the way science works; it iterates, and responds to reasonable criticism by making improvements. What is critical to understand is that the folks at NCDC, like most scientists, are making good faith efforts to improve our understanding of the climate of the U.S. and the world. Accusations of fraud, especially when the preponderance of evidence in the literature supports NCDC’s approach, is deeply counterproductive to the advance of science.
” Is history malleable? Can temperature data of the past be molded to fit a purpose? It certainly seems to be the case here, where the temperature for July 1936 reported … changes with the moment. In the business and trading world, people go to jail for such manipulations of data…”
“..there is no reasonable justification for the allegation of fraudulent behavior, and certainly not to suggest the scientific work they are doing is a jailable offense…”
Pardon me if I point out that nowhere is the word “fraud” used.
And he did also did not say that what was done was a jailable offense.
Climate science is not so well regulated that false/misleading statements are jailable as false/misleading statements are in the financial world.
Misleading statements are made all the time in climate debates where similar misleading statements in the financial world world could lead to jail time.
I’m sorry, but accusing someone of manipulating data (and suggesting that those who did it in the business world would go to jail) is an accusation of fraud. No amount of wordsmithing will change that.
If you torture the data hard enough, it will confess.
.
Considering the number and direction of “adjustments” made over time, one should be forgiven if one should consider the results “suspicious”. Somethings are just natually suspicious, “like a trout in the milk”.
.
.
“..(and suggesting that those who did it in the business world would go to jail)..”
.
Zeke…this is a true statement. You can go to jail in the business world for misleading statements.
I fully agree with that and must admit that I am so happy to be working in Germany without having to fear violence from the climate ostriches. The quote may be misleading in that it implicitly suggests that the climate ostriches are part of the scientific community or are part of the scientific discussion. In reality most of it, and certainly Anthony Watts, is just a PR circus, that keep scientists from their work.
For what is is worth, I guess the word of Zeke is respected more here, but I am the first author of that “European group that tested the accuracy of the PHA-homogenized individual station records” and can vouch for the accuracy of the information on the pairwise homogenization method. (Except maybe that the comparison with the reference network tells us that the reference stations are beautifully representative for the USA average, but does not say that much about the homogeneity of the homogenized data, for the latter the time series is still too short.)
Ed Forbes,
Right now there are two adjustments done to U.S. data. Once is for time of observation (TOBs) changes, and the other is for breakpoints detected via the pairwise homogenization algorithm. You can even reduce it just down to using the PHA and get pretty much identical results, since most TOBs gets picked up as breakpoints relative to nearby stations.
Once you have a single automated adjustment process with no manual data changes or judgement calls, it becomes much easier to create objective tests for the validity of your approach. The major tests to-date, as outlined in this post, lend credence to NCDC’s approach.
There certainly isn’t the type of evidence that would be required to accuse someone of bad faith “manipulation” of the data.
“Is history malleable? Can temperature data of the past be molded to fit a purpose? It certainly seems to be the case here, where the temperature for July 1936 reported … changes with the moment. In the business and trading world, people go to jail for such manipulations of data.”
I don’t see anything wrong with that statement. It is factually correct in all counts. How someone interprets it might be another story. I interpret it as in the business world there are ramifications (including jail) if data is, ahem, adjusted. In the climate world, nothing happens, or worse, these people are made heroes and/or rich.
If we focus on the data changes. We have either a) incompetence or b) malfeasance.
In either scenario, the result has impacted a lot of people (starting with taxes, subsidies going to wind farms, Solyndras, ethanol etc.) and will only get worse. So, the result is the same no matter whether it’s a “honest” mistake or a “not-so-honest” mistake. If it is a mistake, at the least they should correct it – that’s what’s expected of everyone. I’m sorry, at work I am accountable for what I do – why shouldn’t these people be?
Victor Venema,
I agree that the CRN/HCN overlap is too short to really say anything about the validity of homogenization. It does show, however, that the HCN reflects the “true” temperature over that period rather well (at least to the extent that the CRN is the “truth”). There also have been some rather silly claims going around of late that the CRN and HCN differed substantially, based on an (incorrect) averaging of absolute temperatures rather than an anomaly-based approach.
Without getting into semantics, I’d like to ask Zeke a simple question.
What is the correct CONUS average temperature for July 1936?
What was it ten years ago? Twenty years ago?
What was it in late 1936, when all the data had been first compiled?
As an auditor, I think Anthony is overstating his case. People do not go to jail for adjusting data in the business world. Businesses restate earnings. In any given quarter this happens. Even more often they revise estimates.
At the same time, despite claims to the contrary, these adjustments often occur with little transparency. The methods may be published in journals, but its not uncommon for adjustments to occur unannounced. Sometimes these are true adjustments, sometimes errors. In the past GISS was not always forthcoming with explanations.
Maybe the current comments are over the top. But we shouldn’t be naive about the past. I think the work of BEST and others have shown that the temperature records are reasonable. But it should not have taken BEST to accomplish that.
Anthony,
If I were trying to get an estimate of the absolute temperature for July 1936, I would add in the average absolute temperature of the CRN stations for a particular period of overlap (say, 2004-2006) to the anomaly values for USHCN. I would argue that this would be a much better estimate of absolute temperatures for that date than using a simple average of absolute temperatures of stations reporting in July 1936. I’ll take a stab at calculating it and post the results when I finish.
The reason for this is simple: the absolute temperature readings of the stations available in 1936 is likely not representative of actual 1936 temperatures. For one thing, a significant number of stations in the pre-airport days of 1936 were located on top of buildings in urban areas, admitedly a poor place to get a representative temperature of the U.S.
By taking an anomaly approach, we can remove the effect of differing absolute temperatures (e.g. pristine stations vs. rooftop locations) and isolate the change in temperatures over time. By applying a breakpoint-based homogenization method like the PHA we can correct for various biases due to changes in station characteristics of locations over the course of the record (and even remove some meso-scale UHI effects, see http://www.agu.org/pubs/crossref/pip/2012JD018509.shtml ).
Reading the actual news story, this example, with others, jumps out.
.
“..Spencer says that the data do need to be adjusted — but not the way NOAA did it. For instance, Spencer says that urban weather stations have reported higher temperatures partly because, as a city grows, it becomes a bit hotter. But instead of adjusting directly for that, he says that to make the urban and rural weather readings match, NOAA “warmed the rural stations’ [temperature readings] to match the urban stations†— which would make it seem as if all areas were getting a bit warmer…”
.
I am not up on stats enough to argue directly as my training in PubAdmin stat classes were more on what to look for to ring warning bells when someone is using stats to sell you something. The adjustments made to the actual data definitely rings my chimes.
Anthony Watts,
Reasonable questions all, and asking them is perfectly OK. What I think Zeke objects to is the “go to jail” comment, which I must agree is more than a bit over the top, insulting, and ultimately counterproductive if you want an honest discussion about whether the adjustments applied to the original data are technically correct.
Mr Watts…this is not a very intelligent attitude to take. The “correct” average temperature of CONUS is not a fact. It is totally normative – different people will have different ways of computing averages. What you need is the range of these estimates of the average plus properly assessed error bars. The fact that you pose such a question is not very logical to me.
“There is a cancer growing in the climate blogging world. It is a cancer of bad faith, a default assumption that the other side must be lying, stupid, or in the pay of someone nefarious. It manifests itself in one-sided discourses, and personal attacks, and in the blind rejection of results that do not conform to a specific world view.”
.
Well said. I encourage you to put the terms “well-funded denial machine” into your favorite search engine. A couple of links that jumped out at me:
.
http://www.thedailybeast.com/newsweek/2007/08/13/the-truth-about-denial.html
.
https://en.wikipedia.org/wiki/Climate_change_denial
So Zeke, may we take from your presentation that the 1930’s were not particularly hot and the the 70’s were not particularly cold?
You see the thing is that I remember the ‘coming ice-age’ entering popular culture during the first half of the 70’s, with comedians like Dick Emery doing a skit on life in England whilst dressed like an Inuit and Leonard Nimoy narrating a popular science magazine program ‘In search of…’, on the upcoming ice-age.
Now I can’t remember the 30’s, but have seen pictures and read the literature.
So my impression is 30’s warm and 70’s cold.
Now your datasets don’t show the cool period I remember.
It could be that I am making stuff up, that really no one thought there was the possibility of an ice age coming due to a series of cold winters. Thing is Zeke, I don’t believe your data as you have a collapse in temperature from 1956 to about 1966; followed by a rise. Born in 1964 so if your data was tight all I would have ever heard is ‘damn, its getting warmer’ throughout my childhood, but I didn’t, it cooled until my mid-teens and then it warmed.
I cannot believe the data you present. The data presented on your third figure conflicts with my own personal recollections.
Wow! Just like I remember.
2-23 In Search Of… The Coming Ice Age (Parts 1, 2 & 3)
http://www.youtube.com/watch?v=5ndHwW8psR8
http://www.youtube.com/watch?v=tokbiZW3gVY
http://www.youtube.com/watch?v=nprY2jSI0Ds
There is no doubt in my mind that if one can make a case for adjusting data in a meaningful way it should be adjusted. That very need for adjustment admits to a significant uncertainty in the measurement and reporting of that data originally and of course that in turn puts the onus on the adjuster to show that his methods have made improvements.
I see no malfeasance in the attempts that have been made to adjust temperatures. That however does not mean that we lessen our efforts to ensure ourselves we have eliminated all the possible non climate effects that could affect measuring temperature trends and the uncertainty of those trends – with Anthony’s and Zeke’s comments notwithstanding.
Not Sure (Comment #108641) ,
Good links. The cancer grows on both sides… unfortunately.
Anthony,
My (albeit rather quickly conceived and not thoroughly tested) approach to estimating the absolute average temperature of July 1936 results in 75.44 F. This is slightly higher than the 2012 July temperature of 75.34 F. However, the result will differ a tad based on the grid size chosen and the baseline years used. Even in the homogenized data the July temperatures in the 1930s are about as warm as today; for annual average temperatures, not so much.Correction: When I ran my first analysis my code was accidentally set to use the raw rather than homogenized data. Correct results are later in the thread.
http://cdiac.ornl.gov/epubs/ndp/ushcn/ts.ushcn_anom25_diffs_urb-raw_pg.gif
DocMartyn,
We are talking about U.S. temperatures, not global ones per se. And the popular media spin on science is rarely in line with what actually shows up in journals: http://ams.confex.com/ams/pdfpapers/131047.pdf
Maybe Anthony is employing hyperbole to bring attention to an issue that you would not be here discussing today, if he had just asked what the temp was in 1936. At least he didn’t suggest that anybody be killed for not being sufficiently alarmed and frantic about “climate change”.
Not Sure,
Activists in certain quarters are just as quick to assume bad faith. When both sides engage in it, constructive dialogue is nearly impossible.
So Zeke, just to be absolutely sure that this is your point;
‘The popular media reports of cooling from the late 60’s until the mid-70’s was quite wrong. Whilst popular media reported cooling of the Northern hemisphere, including the continental USA, there was actually warming occurring’
Would you accept the paragraph above as representative of you position?
If not, can you please supply a similarly written paragraph that explains the perceived cooling between he late 60’s until the mid-70’s and the reality presented by you and colleagues?
I only ask because many of us think this very important.
“This does raise the point that NCDC probably erred in hyping July 2012 as the “hottest ever†when the difference (0.2 C) between it and July of 1936 is within the range of error introduced by methodological choices.”
Which might raise the point that they seem to always err and hype in that direction. Are they that dumb?
Its also worth pointing out that the liquid-in-glass thermometers employed in 1936 had significantly higher max temperature readings than modern electronic MMTS thermometers, so there is that as well: http://rankexploits.com/musings/2010/a-cooling-bias-due-to-mmts/
Without some sort of homogenization to deal with these biases you end up comparing apples to oranges.
DocMartyn,
The global cooling media craze in the 1970s was a result of two things:
1) Some early (and rather crude) attempts at estimating global temperatures that showed significant cooling from 1940-1970.
2) The Rasool and Schneider (1971) work on aerosols suggesting that their effects might result in significant negative forcing.
This article is a tad old, but still covers it well (and shows estimates of global temps as of 1970): http://www.yaleclimatemediaforum.org/2007/11/common-climate-misconceptions-1970s-global-cooling-concerns-lacked-todays-scientific-rigor-and-relevance/
You slaughter women and children hey, I didnt use the word murderer whats your problem.
skeptics are just like those people who refuse to admit that hilter killed millions of jews. hey I didnt use the D word.
Zeke,
“erred in hyping July 2012”
There is a lot of that going ’round. I agree that Anthony should lower the temperature of his rhetoric, but he is certainly not the only person who should do so. No doubt there is a lot of (honest!) bias in many climate analyses I have seen, but there are altogether too many accusations of bad faith and willful dishonestly… and that is by no means limited to ‘skeptical’ blogs. Everybody should avoid those accusations.
There is some serious lack of reading comprehension being displayed here.
1. Mr. Watts did NOT accuse anyone of fraud
2. Mr. Watts did NOT say anyone should go to jail.
3. Mr. Watts did NOT ask for Zeke’s best estimate of US temperatures in July 1936.
4. Mr. Watts in fact asked for the best estimate for that time period at specific points in the past.
I would imagine that he believes that the temperature estimates would be progressively higher the farther back in time you go – indicating that the adjustments were always going a single way. Perhaps you could actually respond to his actual statements at some point in time rather than creating a series of strawmen.
PS There have been a number of warmistas who have suggested much MUCH worse in regards to skeptics, and I don’t recall Zeke getting similarly hot and bothered (though I may certainly have missed it).
Replace ‘best estimate’ for ‘then published estimate’ in the above post.
as an engineer may I suggest that I can see nothing wrong with adjusting temperatures…. I run a small number of small databases
One caveat, or rule, as you will….
retain the original data and record clearly why and how it was adjusted and show that in an accessible format.
If the data is not good enough to share with your adversary then its not good enough data, period.
I think many are missing the point. It’s not that adjustments are made, but that the method of adjustment keeps changing the answer. Zeke, you mentioned a method in reply to calculate the temps for July 1936. Anthonys point was that if you then run the same calculations using data from 10 years ago you would get a different answer.
The temps in 1936 should not depend on whether you are looking from 2012 or 2002, they just are what they are. (I also have to wonder how you could compute a trend from that date if the start temp keeps moving)
@John Vetterling. Companies do restate earnings and revise forecasts. However, as an auditor, wouldn’t you be concerned if the way a company did its accounting resulted in a rewrite of its past earnings each month? Their earnings for (say) 2002 are what they are and changing those would result in severe questioning or jail time. First and foremost because changing the past financial history of a company misrepresents the actual growth of a company.
John, I’m certain that alarm bells would be ringing if you found the past earnings of a company were dependent upon what the current earnings were.
I freely admit to being a tyro in the stats field but this is an area I’ve never really understood. D-Day was the 6th June 1945, this is historically fixed. Armstrong set his foot on the Moon at 2:56 UTC July 21, 1969. The time is not open to revision as it is in the past.
Yet past temps get revised on a monthly basis? Sorry, what? The temp in america in July 1936 depends on what the temp is today? No, they are historical figures, they don’t change.
If you rewrite the account books of your company you will enjoy a prolonged holiday at Her Majestys pleasure. So why is it acceptable in climate? History is history and historical data doesn’t change, it can’t.
Anyway, my confused 2 cents.
Criminality is a wrong, injury with intent. Mens rea. The warmers have certainly intended to do wrong. The outcome is inevitable criminal proceedings. And it is desirable in my view that the offenders go to prison.
Steven Mosher (Comment #108654)
And Communists are people who won’t admit that Stalin and Mao each killed more people that Hilter (sic).
And this is why I get in trouble trying to do things quickly. The 1936 estimate I posted above was using the unhomogenized data. After homogenization I get:
July 1936: 74.59
July 2012: 75.35
Zeke, do you really think NCDC and USCRN are the same when month to month they can be .8F different, and comparing states the differences fluctuate from -4.8 to 2.8.
http://sunshinehours.wordpress.com/2012/10/09/uscrn-vs-noaa-september-2012/
Hyping one individual months under those circumstances is very, very wrong.
Threatening to kill and jail “deniers” and is standard operating procedure for the AGW Cult.
The temperature in 1936 in the raw data is fixed for a specific stations. From the raw data a second dataset is computed with homogenized data, which is used to compute the temperature anomalies and the temperature trends. The temperature in this homogenized dataset can change as homogenization methods improve. For convenience it is assumed that the current measurements are unbiased and the older data is corrected and can thus change. The advantage of assuming that the last homogeneous subperiod is unbiased is that you can add new measurements without have to homogenize the dataset anew every time.
As the amount of digitised data is increasing, the average temperature in 1936 computed over the digitised dataset can change. Furthermore, as the quality of homogenization methods is improving, the computed temperature of the homogenized data can change. Also with more digitized data, the differences from one station to its neighbour becomes smaller. As these differences are used for homogenization, this again can change the temperature estimate for 1936 in the homogenized data.
Jim T (Comment #108656)
January 23rd, 2013 at 5:39 pm
There is some serious lack of reading comprehension being displayed here.
1. Mr. Watts did NOT accuse anyone of fraud
2. Mr. Watts did NOT say anyone should go to jail.
3. Mr. Watts did NOT ask for Zeke’s best estimate of US temperatures in July 1936.
—————————–
Mr. Watts did say: “Can temperature data of the past be molded to fit a purpose? It certainly seems to be the case here……”
Molding data to fit a purpose? That is quite an accusation.
Zeke. My struggle here is that the validation of the adjustment approach appears to have focused on a model with (apparently) no attempt to find ways to validate the data from the real world.
For example, if a location is adjusted down for a period, can that adjustment be tested against natural phenomena. We regularly read reports that some plant or insect is now found further north than “before”. Can we use similar anecdotes to validate that many of the temperatures in the 30s were lower than were recorded? Has an attempt been made?
In business you can go to jail for improperly adjusting (gaining money by fraud). But you can also go to jail for not adjusting when required.
The TOBS adjustment in USHCN is one that is simply required. We know from the record that the time of observation changed. And we know how to calculate the effect, and that it matters.
But homogenization is vital too. I’ve been plotting historic readings on the Earth’s surface, color shading the intervening intervals. If you use unadjusted modern readings, suitably anomalised, you get a lot of spatial homogeneity. Nearby stations agree well – you can see it.
But as you go back in time, things get ragged. The best indicators are the decade plots, which bring out the systematic station biases. Here is a snapshot from that site of the 1921-30 average anomaly. You can see that Europe is still fairly homogeneous, but Africa and W Asia are dominated by aberrations, plus and minus. These are due to station changes.
” For convenience it is assumed that the current measurements are unbiased and the older data is corrected and can thus change”
Now if one were to do this in a clinical trial, one would be completely discredited.
RobertInAz,
I’m not aware of the use of natural proxies for 1930s U.S. temperature as a validation exercise (and, frankly, proxies are often such an imprecise estimate that the uncertainty would likely be larger than the difference in raw and homogenized temperatures).
The CRN provides a great validation going forward, however, since it will never need any homogenization. If it diverges significantly from HCN, we will have evidence of a problem.
Satellites also provide a good test from 1979 to present, though there is some uncertainty around satellite estimates and I’d take it with a small grain of salt.
The only cure is complete openness and verification
Zeke, please come back to the previous thread where I had some questions for you. I think a thread where you wave a red flag not related to the substance of climate science is going to be counterproductive and bogged down in petty details that in the end affect nothing.
“Owen (Comment #108665)
—————————–
Mr. Watts did say: “Can temperature data of the past be molded to fit a purpose? It certainly seems to be the case here……â€
Molding data to fit a purpose? That is quite an accusation.”
No. A am a research scientist and all my work is biased. Every single scientist is subject to bias. We spend a LOT of time in attempting to remove bias; typically we write out, a prior, EXACTLY what we are going to, in terms of data collection AND analysis. You should never perform data analysis as one goes along as you will change the data you collect ‘throw that one away’ or the methodology you use ‘this gives a lovely bunching of mean and median’.
Scientists are human beings with passions and faults. I can place everyone in front of a microscope and ask them to pick a field; they always pick the most interesting part, they pick the most heterogeneous area. They do this because human evolution has made us look at the aberration, which is why clouds look like camels and shadows on the wall look like vampires.
Like me, Zeke and Steve are biased, they are human.
How much of their bias leaks into their finished product I don’t know. They both state that they have attempted to be as unbiased as possible, and I accept this as an honest self-appraisal. However I do know that a transparent validation of everyone of ones steps is essential.
The conversation over on WUWT is mostly focused on the difficulty of calculating absolute temperatures, but I thought I’d crosspost this over here:
Anthony,
They way that NCDC calculates absolute temperatures is by calculating anomalies and adding in a constant absolute temperature for each month, based (I believe) on modeled outputs of a U.S. temperature field for the climate normals period. I’m not well versed in the details, however, as I rarely if ever deal with absolute temperatures.
My approach was to try and replicate what NCDC does, but to use the CRN to determine the “true†absolute temperatures for the period in which CRN and HCN overlap. I realize this is somewhat complicated (and perhaps overthinking), but the point is that there is no “simple†way to get an absolute temperature value.
As far as anomalies go, you can see (homogenized) July anomalies here: http://i81.photobucket.com/albums/j237/hausfath/ScreenShot2013-01-23at43154PM_zps3d02490c.png
.
The Monthly Weather Review for 1936 (or USHCN raw data for 1936) will give me the recorded measurements at all stations available. However, a simple average of these will not necessarily result in a good estimate of U.S. absolute temperatures, due to unrepresentative siting (many stations back then were fairly urban), instrumentation (CRS measures higher max temps than actually occur), and spatial coverage (there were fewer stations back then, and the elevation of stations doesn’t necessarily represent the elevation profile of the CONUS).
The way regional/national average absolute temperatures are calculated is to add anomalies to a modeled field, or to spatially interpolate between absolute readings. The use of anomalies is preferable when evaluating changes over time as it corrects for differing absolute temps and isolates changes; the absolute approach is better for current weather reports where the decadal-scale continuity of measurements is irrelevant.
Put simply, you can average all the readings from all the stations in 1936 and get a rough average of “true†U.S. temperatures, but it won’t be particularly comparable to temperatures in 2012. To create a comparable estimate you both need to use anomalies (to correct for things like elevation and to some extent urban locations) and some sort of homogenization to correct for station moves, instrument changes, and the like.
But one last question/observation here for you, Zeke.
As I recall the adjustments to the GHCN 1900-current series (where the trend increased by 0.13 degrees C per century) made on their recent version change were confined mostly to the early periods of that series. As you say we have more independent data in modern times to confirm the instrumental data, however, that does not preclude changes in earlier periods that will affect trend estimates and continue to do so into the future – providing we agree that temperature adjustments are a work in progress.
DocMartyn (Comment #108668)
“Now if one were to do this in a clinical trial, one would be completely discredited.”
No, it’s just a matter of definition. You have modern and ancient readings, which may disagree. Which is right? Likely, both. Maybe a site was moved from alt 100m to alt 120 m. You define the site you’re talking about to be the one at 120m, and adjust the old readings accordingly. It’s a convention. You could have gone the other way, but would then have more updating work to do.
Kenneth,
You are correct. The Berkeley results, for example, have notably lower pre-1880 temperatures than Hadley.
DocMartyn (Comment #108672)
January 23rd, 2013 at 6:57 pm
——————————
No. Watts flat out said that the adjustments were being done to support an agenda. It’s an accusation of fraud, not uncertainty or bias of the type you were describing.
“I’m not aware of the use of natural proxies for 1930s U.S. temperature as a validation exercise (and, frankly, proxies are often such an imprecise estimate that the uncertainty would likely be larger than the difference in raw and homogenized temperatures).”
Interesting. IIRC collections of much older proxies are granted an “accuracy” of fractions of a degree.
Nick we have talked about this before and the same thing happens.
I say one needs to calculate, a prior, the temperature of a station inside a rosette of stations using the homogenization procedure. The calculated is then compared to the actual.
The Mosher says do it yourself.
Can you explain why the adjustments shown above resulted in the cooling of older years, with very few adjustments required starting at about 2000? (Slightly earilier than 2000 actually, but I can’t pinpoint the year from the charts.)
gcapologist,
After 2000 there haven’t been that many changes to weather stations. Lots of station moves happened in the 1940s, time of observation changes happened in the 70s and 80s, and most of the stations were changed from liquid-in-glass thermometers to electric MMTS instruments in the last 80s and early 90s (often with associated station moves to be closer to a power source). Those three factors account for the majority of bias in the record.
You can find a good explanation of the type and timing of break points detected and corrected here: ftp://ftp.ncdc.noaa.gov/pub/data/ushcn/papers/menne-etal2009.pdf
Here is an old chart of US national temps produced in 1999. Looks different now.
http://www1.ncdc.noaa.gov/pub/data/baker/usthcnann_pg.gif
Bill Illis,
Back in 1999 they were using USHCN v1, which included a lot of manual adjustments (e.g. this outdated chart http://www.ncdc.noaa.gov/img/climate/research/ushcn/ts.ushcn_anom25_diffs_pg.gif )
Version 2, adopted around 2009, switched to an automated homogenization process for detecting and correcting breakpoints in individual station records not shared by neighboring stations. This approach has been tested and validated by a number of exercises that I outline in the original post. Its probably not perfect, but its the best we’ve been able to come up with to-date.
DocMartyn – “Now if one were to do this in a clinical trial, one would be completely discredited”.
Now I am puzzled. Lets say you the only difference between now and 1934 was TOBS. You want to know how much average temperature has changed between now and 1934. If you didnt make allowance for the fact that measurement data has a known and correctable bias, then I would say your clinical trial would be completely discredited. Whether you warm the current temperate or cool the older temperature (both valid ways of correcting for bias), makes no difference to the result but one is more convenient for use than the other.
It seems to me that you are saying that TOBS (and any other issue like change of thermometer) should not be corrected for. Or do you have a preferred way of doing it, that you think gives a better comparison.
Mr Watt,
At the very least, acknowledge the fact that you can post freely here: Something YOU do not allow on your blog whenever someone dispute your allegations/writings.
Who’s the fraud now?
Anthony (at his blog)
I guess your point is that there is some basis for suggesting that we don’t know whether 2012 had hotter US temperatures than 1936. If this question is simply presented, it’s a fair enough question. And certainly, it might be better if those reporting US records made some mention of uncertainty.
That said: the question is something of a subject change relative to Zeke’s point which is more related to the intimation that something about the data processing involved in determining average temperatures warrants jail time .
One really does have to be very careful about making broad hints that something a person or group of people merits jail timed. Special care should be taken when discussing with large news outlets (like Fox News.) Jail time it does suggest criminality.
It’s true some in the “warming” camp also call for jail time– death penalty and so on. People rightly criticize those in the “warming” camp who make such suggestions. But their doing this sort of thing doesn’t mean that “coolers” get a carte-blanche to do the exact same thing. So I have to agree with Zeke that it’s regrettable Anthony made any allusion to “jail”.
Francois T,
Your allegation is untrue.
Scott, yes the allegation is untrue. You are of course not “free” to post on this blog. You post at Lucia’s discretion on this blog, just as you post at Anthony’s discretion on his blog.
Seriously I’ve grown very tired of people who cry over not being able to post venomous entries on somebody else’s dime that violate pre-defined rules for commenting on that blog. Seem we have another person in need of “big boy” pants.
As I mentioned over on Curry’s blog, I can’t believe something I read in this article:
This is a barely veiled reversal of the burden of proof in the form of, “If you can’t prove me wrong, I’m right.†The idea that disagreeing with “someone’s approach and methods†requires me to do a better job is ridiculous. And it’s ridiculous in two different ways.
First off, it directly implies having any answer, no matter how bad or wrong, is better than having no answer. That’s silly. In reality it is perfectly okay to say, “We don’t have a way to solve this problem.†We don’t have to find a better answer to say one answer is wrong.
Second, it places an incredible burden upon anyone who disagrees. Even if someone knows what a better approach would be, they may not be able to create and implement it. It is absurd to say a single, unfunded individual must do as much, if not more, work than teams of individuals that get paid for what they do.
lucia:
Which is and has been my biggest complaint about climate reporting all along, namely the apparent lack of interest in reporting uncertainties in measurements.
That said, I don’t see there being much substance to Anthony’s comments here.
The CONUS mean temperature is an estimate based on coarse & irregularly sampled grid using measurements that have well documented systematic errors. If we had ideal measurements that met the Nyquist sampling criterion, we’d be able to come up with a very precise value for temperature in say July 1936.
Since the data are irregularly sampled, and don’t always meet the Nyquist criterion, it’s not surprising that the value for a particular data is “non-local”, that is depends on temperature values for other time periods besides July 1936, and as data availability changes, small changes in that reported mean value for July 1936 are also observed.
That said and without having actually performed the task, I would be surprised if the changes actually exceeded the stated uncertainty in the estimated value for the mean COTUS temperature. And if they did exceed it, all this would tell us is the uncertainty was underestimated.
Just don’t see anything particularly deep here.
My sentiments echo Zeke on the inappropriateness of suggesting that the mere fact that numbers change as data and algorithms involves a “manipulation of data” that would warrant people going to jail. This is just wrong headed to even suggest.
Lucia and Zeke,
I’m concerned that you are misreading what Watts said. Anthony’s quote is “In the business and trading world, people go to jail for such manipulations of data.”
He didn’t state that people should go to jail for this. He was agnostic on that point. He said that “In the business and trading world…” I’m concerned that you are leaving that crucial part out of the quote.
In the spirit of civility, I would ask Zeke to retract his remarks claiming that Watts called what NCDC did “fraud.” That is incorrect. Watts called it “manipulations of data.” Watts also did not call for jail time for the people at NCDC. Instead, Watts said “In the business and trading world, people go to jail for such manipulations of data.”
So in the spirit of civility, Zeke should retract his remarks and more accurate describe what Watts actually said.
On the topic of what Watts said, I want to point something out. This is the actual quote from the article:
Notice the part I put in italics. Notice also the quote in that paragraph ends in a comma, meaning we don’t know if there was anything more after. Also notice there is a paragraph break and a new quotation section. These things mean it is impossible to know if there was anything said between these two quotes.
I don’t approve of the second quote, but I think it is strange to claim it immediately followed the first (and that the first ended at the end of a sentence) when there is no way of knowing that’s the case. The news article clearly chose pieces of Anthony’s statement to quote and others to drop so how can we join the two pieces as though they were one?
I think again that basic points are being missed. It’s not that what is done in adjusting things warrants “jail time” but that if adjustments were made the same way in different areas they would result in interesting investigations. (At least)
I personally would love to sit in on the discussion where someone tells the Tax Office that they want to rework their Income Tax for the last 30 years because they’ve come up with “a better algorithym”.
By all means, go and adjust the financial books of your company, I’m sure the relevent Securities Commission will be all agog at the improved brand of accountancy and won’t question you at all. 😉
The reporting of 2012 as the warmest year ever for USA with big fanfare by NOAA/NCDC is calculated malfeasance when such a statement is not true.
So if Zeke gets hot under the collar for Anthony Watts giving an opinion on such a statement, it is an act of hypocrisy when he continues to keep quiet about the statement from NOAA/NCDC which led to Anthony’s remark.
Zeke, if you are to be offended by Anthony’s remark, please post an article condemning NOAA/NCDC for misleading the public and do so when everytime Hansen and all other AGW supporters call for skeptics to face jail, death penalties etc. They have made far worse statements and you’ve been invisible when such statements were publicly aired.
Brandon Shollenberger (Comment #108692) – A well reasoned statement. And Zeke, I think you are getting exercised over nothing. I see little that is offensive in what Anthony said. In the business world you would be prosecuted (assuming it was a public company) for manipulating data, but not for innocent restatements. In the world of clinical trials, some last for 5 or more years and with predetermined protocols, statistical analysis plans, pre-approved data collection and handling methods, there is no valid way of adjusting raw data and to do so would land you in purgatory. Granted, the presumption of ethical behavior and innocence should be accorded, but to many skeptics climate scientist have broken their trust. The historical temp. data has not been adequately explained with respect to uncertainty and a lot of people simply don’t trust many mainstream climate scientists. Take a gander of all those that still defend Mann, Karoly, Lewandowsky, or Steig.
Madoff conned investors out of billions, but if there is anything nefarious with the CAGWers, we are talking many trillions down the rat hole. Zeke, given the behavior of some in the climate science arena, you are being way to sensitive. Don’t be such a wuss.
Bob:
Venter:
Tell us how you know 2012 isn’t the warmest year on record [for the USA]?
Carrick,
The answer is that with the current uncertainities in the measurements, the constant adjustments of data and the absence of reliable metadata, the answer is that we don’t know. And that is what should be stated. NOA/NCDC did not stated that and stated something with a false certainity with glaring headlines designed to deceive. Anthony Watts objected to that. Zeke got in a huff at Anthony but not at NOAA/NCDC. I called that as hypocritical.
Any further doubts?
Zeke, Where is the code and algorithm documentation of the homogenization algorithm? Your comment about comparing apples to oranges may be correct but It seems you are now just comparing apples sauce to mashed orange.
Maybe microclimates are important. It certainly could be argued that raw data is a more consistent way to look this.
Zeke,
It seems to me that if you accuse Anthony of falsely accusing someone of committing the criminal offense of fraud for manipulating temp data, you should furnish some evidence that such a crime exists. What is the relevant criminal code for fraudulently manipulating temperature data, from let’s say 1936? Is there a statute of limitations?
Anthony probably should not have said that last thing he was quoted as saying. But it ain’t something to hyperventilate about. I seen a lot worse from the climate alarmist heros, many of whom are on the public’s payroll.
Stupid question, I know — still I’m curious.
Why the fascination with urban heat islands, and why the drive to discount readings from stations located there? Heat islands don’t record falsely, they just record heat present at that place. That additional heat is not radiated off into space with no effect downwind, nor in the place it was recorded, but instead becomes a part of the heatload of the planet.
So why discount it? Who says it’s inaccurate, and how?
While the mention to “jail” seems to be excessive, saying “2012 is the hottest ever”, without mentioning all the uncertainties, seems to be close to cheating the public. Do we know there will be no more adjustments changing the results again?
But I agree we better put the idea of jailing people to rest.
Ed Darrell @ 1.43am: Re UHI’s.
Two points come to mind easily:
1) How much area does the station located in a UHI represent – i.e If a site in the middle of a city of 10km^2 (for example) is used to represent temperatures of the surrounding 100km^2 will it be a fair representation?
2) Attribution of warming – what weighting will be given to represent forcing due to urbanization (if any)?
Zeke,
I agree with you that Anthony Watts should not have added his reference to “jail-time”. It is unwarranted in its implications.
But if the objective is to “de-polarise” the debate, and I think it should be, then someone needs to advise NCDC to stop putting out unqualified headline statements of the following type:
No mention of uncertainty bands, and buried inside the NCDC report is the statement: “The data for 2012 are preliminary.”
These types of headline-grabbing statements are unscientific and clearly intended to offer a simple message to the masses. They do not help to improve the credibility of the scientists actually doing the work, and nor does such reporting present NCDC as an honest broker. The UK Met Office is trying to do something right now about its image problem, largely because it became apparent that their reporting and their forecasts had become agenda-driven, rather than strictly science-driven.
Zeke,
“This approach, called the pairwise homogenization algorithm (PHA), is an automated method that look for step-changes or spurious trends that occur at one station but are not seen at the same time in nearby surrounding stations.”
The majority of discontinuities associated with station move are actually corrections (better situation after move). Homogenization remove these corrections. This treatment is legitimate only if the gradual increase of perturbations is also removed. Unfortunately, this is clearly not the case:
1. The methods described do not allow such corrections. The difference between climatic and non-climatic influences can not be modeled by synthetic data. The comparison between neighboring stations is not a solution because they can be subject to parallel perturbations increase. It should be remembered that the source of perturbations is mainly in energy consumption and waterproofing of surfaces. These two factors increased steadily throughout the twentieth century and this with a relatively stable rates (the rate matters) throughout the country.
2. Given the nature of non-climatic perturbations, we should expect overall negative corrections for the twentieth century but the opposite is observed.
“Phil Scadden (Comment #108686)
DocMartyn – “Now if one were to do this in a clinical trial, one would be completely discreditedâ€.
Now I am puzzled.”
Well the central point is does one have a continuous or a discontinious data-set to analyze?
We are not looking at a series of records for a set of screened thermometers. Two things happen, stations move and thermometers change.
Now one also assumes that the data is attempting to kill one, so one assumes the possibility that station moves occur for a common reason and introduce a common systematic error.
Thus I begin to give heart drug to 20,000 fifty-year old males and 5,000 drop out during the first five years due to kidney disease, and are replaced with a cohort of women aged between 50 and 55.
Changing thermometers is allowable, all you need is 5 years of co-measurements of the two assay methods showing that one gets the same results.
One can say the same thing of change of location AND altitude. The altitude adjustment algorithm would need to be independently validated.
Zeke: I think your overall point is well-taken. Watts should not have mentioned jail time. You are being extremely picky in how you parse what he said, but he’s arguably wrong.
However, I think your “just look at the literature” approach ignores history, which is also a factor. For example, you show graphs with the USHCN and USCRN. The establishment made the USCRN, as I understand it, only because of McIntyre et al showing how ridiculously poor many USHCN stations were. I think it could be argued that without skeptics’ pressure there would be no USCRN.
(I would mention in passing that the agreement among USHCN and USCRN since the USCRN’s establishment is not necessarily an endorsement of USHCN, which I believe was cleaned up around the time the USCRN was established.)
Similarly, you show UAH. As I understand it, there has been tremendous pressure from the “mainstream” that UAH is way wrong, that they don’t know how to calibrate their data, that they’re cooking their books and they’re the last skeptical holdout among the big players (NCDC, etc).
Last, a prediction was made decades ago about global warming. It was made at a time when the data was not friendly towards the prediction, and for a long time it’s proponents had difficulty explaining the data. The proponents have in their chain of command a major control over the data, I believe. And over the decades, corrections to the data have consistently and overwhelmingly moved the data in a direction that strengthens the prediction and eliminates difficult historical issues.
That doesn’t mean that the books have been cooked. But considering climategate emails, toleration of poor station siting, relentless and personal criticism of skeptics, etc, there is a historical/political dimension to the discussion that simply cannot be ignored.
It might be different if Lucia was head of the NCDC, you were head of GISS, and Mosher was head of NOAA. But that’s not the case, and based on history/politics Watts’ has an arguable point in terms of his feelings.
That doesn’t justify his accusations or his language. But neither does your “look at all of these graphs and appreciate all the little people that work for these folks” approach cover all of the bases.
DocMartyn–
The moving thermometers is a challenging problem. But analogies are nearly always imperfect. In some ways moving thermometers is like changing the population involved in a medical experiment; in other ways it’s not. And anyway, it’s a bit more like you had a mix of 20,000 males and females of mixed ages. 5,000 dropped out and then you replaced with 5,000– also of mixed ages. Certainly, overlap of drop outs and non-drop outs would be better. But that doesn’t mean you can’t do something with the new data.
I know this could violate medical protocols. But protocols are written to be optimal in a medical research where to a large extent, things can be planned in advance. In this case, one has the data that happened to be taken way back when before anyone was thinking of figuring out whether climate change was happening.
I think the point is that if you report that 1936 was 77.4F one month while claiming that 2012 was “warmer” then the next month after the remaining data comes in and 2012 is less “warm” then the initial results but you then say don’t worry its still the “hottest” because now 1936 is 76.43F something is wrong.
Which is it 77.4 or 76.43? the next question is what did they say it was 10 years ago and what did they say in 1937?
If I said a project would have a rate of return of x but then the cost changes significantly but I still claim the same ROR clearly something is wrong. If a company did this is quarterly stock releases they would quickly find themselves in real trouble. The point Anthony was making is that this type of revisionist behavior is allowed in the climate science community and ignored.
Its not about how or why they adjust the data its that the “new” adjustments always give them the answer they want and change from month to month what the “actual” temperature in history was they then use these constantly shifting “actual” temperatures to make claims of hottest ever and most extreme. If 1936 was 77.4 in August 2012 it should still be 77.4 as I do not think the data has changed since August but the algorithm changed and now 2012 is warmer and 1936 is colder. Very convenient for those who like to make press release claims and headlines.
MrE (Comment #108703):
You can find a list with homogenization packages here:
http://www.meteobal.com/climatol/DARE/#Homogenization_packages
This includes a link to the PHA of NOAA:
ftp://ftp.ncdc.noaa.gov/pub/data/ushcn/v2/monthly/software
Ed Darrell (Comment #108705):
It is not a stupid question. In fact if you were interested in urban climate and for example its relation to public health, you would not want to remove the effect of urbanization.
If you are interested in climate, you do want to remove the effect of urbanization, because the temperature increase at an urban station is typically not representative for the region around the station. If your observation network would be sufficiently dense at you would have many stations inside and around every city, you would not have to remove the effect of urbanization, because in that case the stations would be representative for the regions around them.
phi (Comment #108710):
This not right, because not only discontinuities are corrected, also gradual changes in the difference between one station and its neighbours are corrected. In the European validation study of homogenization methods mentioned by Zeke we also included local trend inhomogeneities.
Only if there would be a similar gradual trend due to non-climatic reasons in all stations simultaneously, that would be a problem. That would be something you would not notice by comparing multiple stations with each other.
fraud is not exactly unknown in science, and continued readjustments of historic data (downwards) does raise questions, of why, what reasoning be it fraud or confirmation bias to a theory.
“If it were a private company…jail time’
This is an auditors statement
http://www.peabodyenergy.com/mm/files/Investors/Annual-Reports/PE-AR2011.pdf
Because of its inherent limitations, internal control over financial reporting may not prevent or detect misstatements.
Statements such as that in the ‘private sector’ are quite common…because they don’t want to end up going to a place called jail.
The bean counters end up having to state that there is a possibility that they didn’t count the beans correctly because it is impossible to be 100% certain that the beans were counted correctly.
Lucia, I think you missed my point about the changing cohort.
This is the problem that you missed;
In the same way patients can drop out of the study for the same reason, it is possible that stations may move for the same reason.
In a drug trial people drop out for all manner of reasons. It is possible that part or most of the dropout is due to a drug effect. This drop out affects the outcome, look at all the studies on blood pressure/kidney disease which used Caucasians and African-Americans.
Now I say, wearing my Statistical-God pointy hat, the vast majority of station moves are due to not random events BUT have the same underlying cause.
Wearing my smarmy biological sciences been buggered by this before hat, I can tell you that the vast majority of station moves are due to the two-headed property-price/Urban heat Island dragon.
As a local expands, so it gradually encroaches on the virgin temperature station, so temperatures and land prices rise. Eventually we arrived at the Land-Price-Temperature event horizon. The land is sold and the station moved further from human habitation. The new station records a cooler temperature than previously, and so it’s record is spliced to the previous record.
Then the population rises, and the two-headed property-price/Urban heat Island dragon chases it’s new pray, forcing up the poor stations temperature and land price.
So it goes on, a ubiquitous, systemic change occurs in the record that gives the appearance of uniform heating, whereas we are looking at a sampling artifact due to SAMPLE SELECTION.
Lucia, more on the medical vs. climate.
We have records going back 200 years of blood pressure measurement, the recording of different individuals at different time but of maximum (systolic) and a minimum (diastolic) pressure.
No physician has ever attempted to calculate changes in ‘average’ blood pressure using (systolic plus diastolic)/2. This is because both systolic and diastolic pressures are real values, whereas (systolic plus diastolic)/2 is not.
All physicians have calibrated their instruments throughout the last 200 years. At no stage have physiologists introduced a ‘Tight corset bias’ adjustment to lower systolic and raise diastolic pressures in women of the pre-1900 cohort. To do so would involve the humiliating ritual of having ones sphygmomanometer broken in front of ones peer.
Quite a lot of what the reconstructionists say and do appears to make sense. However, it is arbitrary.
‘We have identified this problem and will solve it this way’, is all very well, but it only means that one removes bias introduced by problems that have been identified. You do not remove the bias introduced by problems that you have not identified.
Essentially, what we have here is Galton asking the crowd the weight of the cow, but when ever someones comes up with a lowish estimate, Galton says, post hoc,
‘she looks uneducated and so I will ignore that estimate’
‘he looks like as townsman and so I will ignore that estimate’
‘she is a child and so I will ignore that estimate’
‘he looks drunk and so I will ignore that estimate’
I think Lucia is the voice of reason in this thread. The moving thermometers is a problem, but Anthony Watts mentioning jail on a major news outlet is a little over the top and regrettable.
I feel (and I may be wrong here) that most of the adjustments to temperature are made by well-meaning individuals who are using the best methods available to come up with the proper number. The unfortunate part is when the adjustments coincide with one side or the other trying to make cheap political points.
Since both sides know that there are individuals trying to make political points, it’s important to be transparent and open when making changes to the record.
Victor Venema (Comment #108715)
“This not right, because not only discontinuities are corrected, also gradual changes in the difference between one station and its neighbours are corrected. In the European validation study of homogenization methods mentioned by Zeke we also included local trend inhomogeneities.”
There are limitations here in what a breakpoint algorithm of these difference series can find with regards to a change in mean or trend depending on the magnitudes and what other changes might have occurred before and after the change of interest. Another factor is the noise level in the difference series.
Another limitation is the corrections made for these changes as there is some subjective choices that have to made in instructing the algorithm over what period and at what magnitude the change is made. GHCN uses the nearest neighbor stations to estimate the proper change. One would think that an adjustment for a trend would result in trends if one were to subtract the Unadjusted series from the Adjusted series. Invariably what you see when do that differencing with GHCN series are plateaus.
One can artificially come up with a sequence of changes in a time series that would significantly and dramatically affect the resulting trend, but that would go undetected by a breakpoint algorithm. The point then becomes one of determining or attempting to determine whether these changes can and/or might occur in the real world.
Doc
I understand your point. But that doesn’t mean one can do nothing. My point is merely that you are overstating the problems inherent in the issue.
First: I would dispute a claim that an average temperature over 48 states is not “real”– or at least if you are going to claim it’s not “real” you should define what “real” is supposed to mean. It may turn out that lots of “unreal” things are useful to know. Certainly, engineers track average temperatures of various sorts all the time and it’s a very useful thing to track.
It may well be that the average of systolic and diastolic pressures is of no value at all and so doctors don’t compute it, track it or give it any thought. I suspect they also don’t track things like the average of the length of the left toe and waist dimension over time. But the fact that you can come up with examples of some things that should not be averaged doesn’t mean that other averages are either “not real” or “not meaningful” (or whatever is the more proper standard).
Seriously? You think you just make up assertions involving the name “Galton” and claim people are doing something and that’s some sort of proof that they do something remotely like what this Galton person did/does or whatever? Sorry, but it doesn’t work that way. If you think NCDC are just making up excuses to throw out data for arbitrary reasons, you need to point to specific examples where they threw out data for arbitrary reasons.
Zeke has shown lots of comparisons with different treatments of data– as have NCDC.
@DocMartyn. Your thight-corset bias is something real, but might not be what you want to study, thus it is similar to a bias due to urbanization, it will depend on your research question whether you want to keep this bias in your dataset or not.
Most problems in homogenization would be more similar to changes in blood pressure measurement technology.If you would know that modern automatic measurements release the pressure in the cuff more slowly and thus find higher blood pressures as conventional stethoscope measurements, then you would definitely want to remove this effect if you wanted to use such a long record to study public health.
Inhomogeneities in climate records are seldomly due to calibration problems.
That is why we do not homogenize using metadata (station history) only, but use relative homogenization. By comparing one station to its neighbours, you will find inhomogeneities irrespective of their causes.
While a pattern of multiple moves from the urban areas to suburban ones does happen, most climate station moves are simply because volunteer observers retire. Many important inhomogeneities, which have the potential to bias the records, are technology changes. For instance over the centuries the protection for radiation errors has improved.
Zeke would it be possible for you to ever run these analysis using Max temp and Min temp separately and comparing the results you already have to “average” temp? As we know min and max are not effected equally by UHI/land use I wonder how the homogenization would look on them separately versus “averaged”.
Maybe just doing the adjustments and break point analysis on the min and max seperatly would yield vastly different detections in series history.
i.e. when doing the analysis on (min+max)/2 adjusted for TOBS and everything else would show different break points then each measurement seperatly.
I find I “trust” analysis using only max or min temp more then the arbitrary “avg” temp for some reason. I would love to see charts with 3 lines on them one for each like we see for MIN/Max/avg ice extent trends.
Taking this discussion further with observations of the difference series arising when one subtracts the Unadjusted series from the Adjusted ones in the GHCN data set, one finds that those absolute differences have decreased montonoically over time and in the recent past show that the corrections are being smaller and less important. When this is broken down by country one sees that some countries require no adjustments and that that has been the case for some time. The US differences between Adjusted and Unadjusted series standout out as having needed large adjustments in the past and while lesser ones in the recent past still needing relatively larger adjustments than most other countries.
Part of this country difference can, I think, be attributed to the length of the series used in differencing a reference station with its neighbors – as the shorter series have a significantly lower amounts of adjustment per unit of time than the longest series. The US has a high portion of the longer station temperature series in the world.
Also it is worth noting that of the 7000 or so stations that GHCN reports approximately 4000 have required no adjustments over the entire time period of the station series.
Victor Venema, are you an author of the European benchmarking analyses of the algoritms used to adjust temperature series? If so, do you have any comments on your benchmarking versus that that has been published for testing the GHCN algorithm and perhaps what was used in the BEST versus GHCN testing?
DocMartyn
It’s worth noting that medical researchers do consider ‘adjustments’ when they can make them and it makes sense to do so. For example, we have age-adjusted cancer mortality rates here:
http://www.health.ny.gov/statistics/cancer/registry/age.htm
These sorts of adjustments are also requied to figure out whether our ability to detect treat or cure things like cancer has improved or declined. After all, if we don’t adjust for age, and merely examine overall mortality rates, we might see a decline after an outbreak of the-new-bubonic plague that kills 50% of the population and conclude that we’ve “cured cancer” merely because everyone died before the age where they could get cancer.
It is hardly the case that the medical community doesn’t make “adjustments”. They consider them judiciously. Obviously, those computing average temperatures need to also adjust judiciously. But claiming MD’s don’t do it at all and then suggesting that those in other fields must be held to this fictional standard that does not apply to MD’s is not rational.
@Kenneth Fritsch. Yes there “are limitations here in what a breakpoint algorithm of these difference series can find”. Homogenization will improve the trend estimates, but will not remove biases from the climate record entirely. As the validation studies presented by Zeke in the post show.
As parallel measurements with historical and modern measurements show, the observed temperature values were likely too high in the past. Thus not being able to remove this bias entirely means that the global temperature trend estimates are most likely too conservative and the real increase in temperature was higher.
I do not understand your second paragraph.
How would your “sequence of changes in a time series that would significantly and dramatically affect the resulting trend, but that would go undetected by a breakpoint algorithm” look like. The only scenario I can think of with a dramatic influence on the trend that would go unnoticed would be if all stations had all inhomogeneities on the same dates. A rather unrealistic scenario.
@DocMartyn. The computation of the daily mean temperature by averaging the minimum and the maximum temperature, is a good approximation in most countries. People did not start using that equation with checking that. With round the hour manual measurements by multiple people or using an expensive and fragile thermograph people already very early checked the validity of this relation.
Many countries use 3 or 4 fixed hour measurements to compute the daily mean temperature and naturally have checked how well that works.
Nowadays automatic weather station no longer need this and can compute the daily mean temperature from high-resolution measurements. Using this data can again be used to validate the equations used to compute the mean temperature. Feel free to show that this is a problem.
Lucia, I think you missed my point. One could make an argument that women in the past wore tight corsets. One could take a group of present day women, measure their blood pressure, place them in tight corsets, than remeasure, then write an algorithm to ‘correct’ the effect of corsets on women’s blood pressure.
We could then view a set of historic women magazines and work out the ratio of advertisements for corsets vs. baby cloths and from this ratio workout the ratio of women wearing corsets in a particular year. Thus, we can adjust women’s blood pressure using a validated algorithm and a proxy for women’s corset wearing, and see if there has been a trend in women’s blood pressure.
All logical, all reasonable, all post hoc.
Zeke: I would also add that your argument that the scientists are hard-working and honest ignores confirmation bias. The fact that record highs were declared with preliminary data, then fell with full data, then was rescued by “better corrected” historical data is just a “poster child” moment.
You can try to say you’re “just the facts ma’am” and context doesn’t matter, but when it comes to credibility and avoiding confirmation bias that other stuff matters.
Just to interject my thoughts on the Watts’ comment: Totally uncalled for and counterproductive.
As to changing the tone of these climate blogs, I think that is best accomplished by ignoring some of these more inflammatory remarks in favor of keeping conversation on topic and more technically oriented.
I once took part in discussions at a blog where the exchanges could become heated and partisan, but there was one participant, who happened to be a lawyer, that was able to ignore and/or readily fend off the personal part of the conversations and keep the discussion focused on the subject at hand with clinical analyses. I did not always agree with him but I admired what he was able to accomplish. I always hearken back to that experience when I hear participants come unto to a blog with a countervailing point of view and complain about their treatment. I viewed that gentleman I described above make very succinct points in the heat of battle not dissimilar to what those might face with countervailing POVs and who complained. That gentleman I judged was more interested in making his points and not attempting to determine which side of an argument had the most aholes.
Ben (Comment #108727)
“As we know min and max are not effected equally by UHI/land use I wonder how the homogenization would look on them separately versus “averagedâ€.”
Ben, GHCN does the adjustments on maximum and minimum temperature series and not the mean. The mean should be a result of an averaging of the maximum and minimum. The adjustments that are made to the maximum and minimum temperatures can vary within a given station, i.e. the breakdates in the maximum series will not necessarily correspond to those in the minimum series.
This situation is readily seen by merely downloading the GHCN max and min series for Adjusted and Unadjusted and then differencing the Adjusted and Unadjusted series. You will obtain for most stations where adjustments have occurred a series wavy staright lines with sharp upward and downward changes producing plateaus.
DocMartin
So what? The fact that you can dream up a silly thing one might do with blood pressure data doesn’t tell us anything at all about the reasonable-ness of an entirely different operation on temperature data.
No. Your corset stuff isn’t “all logical, all reasonable”. It could only become reasonable if you had a substantial trove of information about the effect of corsetting to permit you to “correct” and other information to verify other steps and somehow knew what you were trying to estimate is “blood pressure of women in the uncorseted state”. I think the main reasons no one would bother calculating this value is no one has any interest in the information at all because … well… who cares?
As for the accusation that a correction is post-hoc? So what? It is true that if possible it is best to define what one searches for before data are collected. In test of efficacy of pharmaceuticals for the approval process, it is the gold standard– but that is in part because it is possible to do. But in some fields, post-hoc studies are the only thing possible. With respect to estimating temperature trends for the US, it is simply not possible to travel back in time, install thermeters etc. So, one has the data that one has. Necessarily, there will be an element of “post hoc” in data analysis.
Even in medicine some post-hoc studies are done. Without post-hoc studies, it would become impossible to begin to detect health issues related to diet, exercise, gender, genetic-race and so forth. Even if these studies aren’t used in drug trials, these post-hoc exercises are valuable in epidemiology and medicine. There is no reason to suggest that “post-hoc” is a problem per se.
If you want to argue there is a problem with corrections for temperature data, it would be wiser to familiarize yourself with the corrections to the temperature data and consider them in their own right rather than trying to concoct strange exercises one might do in medicine, and then simply claim that somehow the calculations for the thermometer record are similar to the fictional exercise you dreamed up. Certainly, you can’t fault the reconstructions merely because they are “Post hoc”. Post hoc exercise done correctly are well accepted in all branches of science. Of course they can get screwed up– but so can not-post-hoc experiments.
Re: The adjustments that are made to the maximum and minimum temperatures can vary within a given station, i.e. the breakdates in the maximum series will not necessarily correspond to those in the minimum series.
I would be very suspicious of different break dates for maximum and minimum temperatures. What is the justification for moving the maximum-recording thermometer, but not moving the minimum-recording thermometer?
“How would your “sequence of changes in a time series that would significantly and dramatically affect the resulting trend, but that would go undetected by a breakpoint algorithm†look like. The only scenario I can think of with a dramatic influence on the trend that would go unnoticed would be if all stations had all inhomogeneities on the same dates. A rather unrealistic scenario.”
I should perhaps have been more careful of my use of dramatic and used instead significantly affect the trend. For example a number of small changes in trends in a difference series are more difficult to detect than one large trend change. The sequence of increasing and decreasing trends can change the detection limits. As I sit here I am thinking about how a breakpoint algorithm would detect a long running trend breakpoint in a series that has been truncated by the available station data such that the series is one longish trend. If I difference that series with a series that has let us say no trend in this period the difference will be a long trend but without a start or end date.
Have you attempted to determine various combinations of changes that might make a breakpoint algorithm fail to detect a change?
Also a breakdate as determined by a breakpoint algorithm is not an exact date but rather a date with a confidence interval that can have a relatively short or long range.
“Lucia,
Certainly, you can’t fault the reconstructions merely because they are “Post hoc—
I wasn’t.
However, there is always the human element and if you look for something you can find it. That is why data-mining is so tricky, one can make ‘reasonable’ changes and get anything.
However, in the late 60’s and mid-70’s it was cold and cold enough to warrant people to speculate that the ice-age was coming.
The reconstructions show that this was a warming period.
Zeke shows summer 1936 was 75.44F ‘raw’ and 74.59F ‘adjusted’.
I cannot believe that the people in 1936 were so incompetent as to be unable to measure the maximum and minimum temperature within half a degree; yet this is what BEST suggest.
@Ben. The average temperature is available for much more stations, not all minimum and maximum temperature have been digitized yet. As the quality of relative homogenization depends on the noise in the difference time series, average temperature can thus be homogenized better and is likely of better quality. At least globally this would be the case, I do not know the situation in the USA, maybe here also minimum and maximum temperatures are fully available.
@Kenneth Fritsch. Except for the additional correction for the TOBS, the rest of the inhomogeneities found in the USA cause a bias that is very similar to the bias found for the global datasets, about 0.2°C.
Yes, I am the author of the European validation study. Both validation studies had a different in methodology. We were comparing many algorithms and were interested in making the dataset as realistic as possible, so that you could see which algorithm would perform best in praxis.
The validation study by Peter Thorne et al. only studied the PHA and tried to see whether the algorithm would break down in difficult situations. In that respect this study is less realistic, the statistical properties of the inserted inhomogeneities much more difficult as in praxis. Thus you cannot use this study to determine the uncertainties in the data after homogenization.
An important aspect of the study by Peter Thorne is that they included biases in the trends due to inhomogeneities. This is something we forgot, consequently there we had only small biases in the regional average temperature and precipitation and our results for these averages is less robust.
There is an upcoming validation study of the International Surface Temperature Initiative, which will be global and will thus also include data sparse regions, which was missing in both validation studies.
I did not have a look at BEST yet, but looking at the end results, I feel that the uncertainty is too small and wonder whether they took the influence of inhomogeneities with a bias rightly into account.
Zeke,
Were you outraged by this from the Fox article:
“Aaron Huertas, a spokesman for the Union of Concerned Scientists, argued that the debate over the adjustments misses the bigger picture.
“Since we broke the [temperature] record by a full degree Fahrenheit this year, the adjustments are relatively minor in comparison,”
“I think climate contrarians are doing what Johnny Cochran did for O.J. Simpson — finding anything to object to, even if it obscures the big picture. It’s like they keep finding new ways to say the ‘glove doesn’t fit’ while ignoring the DNA evidence.”
A spokesman for the Union of Concerned Scientists equating “contrarians” to the slickster, who got an obvious murderer off the hook.
Why is it that Anthony suddenly triggered your outpouring of outrage about the growing cancer? Since you gave him as the only example of the cancer, are you calling him the cancer? Ain’t that just some senseless antagonistic hyperbole, Zeke? Do you literally mean that Anthony is a cancer? Do you think that Anthony literally meant that scientists should go to jail? Are you mad at Anthony for laughing about the BEST-JGR-G&G fiasco?
JR (Comment #108737)
“I would be very suspicious of different break dates for maximum and minimum temperatures. What is the justification for moving the maximum-recording thermometer, but not moving the minimum-recording thermometer?”
Why would you assume that the breaks were the result of moving thermometers? There are other changes that can result in breaks in the series and if these are caused by undocumented changes then I guess you will not know exactly what that change was.
The comparison Watt’s made with company financial statements is fallacious.
Financial statements and other kinds of corporate accounting are done in a style which maintains the myth that they are equivalent to balance sheets of a person or a household at a bank. They are not. While some parts of them are quite concrete, others are estimates, and others are shifts of monies into time periods and categories which benefit the company — and sometimes its executives and board — for tax and other purposes. They are advertised to be a true picture of the company’s health but they are presented with a point of view and subject to a bewildering set of choices with respect to one or more tax codes. Thus, they do not present the true picture. Discerning the true picture demands skill and detective work by securities analysts, as well as pointed questions during earnings calls.
Indeed, if someone wanted to construct a true picture of the company’s health, it would be better to use some of the adjustment mechanisms which Watt’s impugns to do so. It’s like political polls and exit polls. If you want a comprehensive and better picture, you get one by weighting them according to their past accuracy, not averaging them in altogether.
The same argument has been made with respect to the national Census, and the counterarguments are equivalent to what Watts argues. If literal nose counts are made, there will be people missed in a Census, whether because they are difficult to reach, or because, like some conservative pundits, they avoid being counted. This is not a new problem at all in sampling: Fish don’t like to be caught in traps at times either. So, there are ways of estimating the uncounted, and these will give better results than if the estimate of the actual counts were made.
Nose counts aren’t perfect.
Thermometers aren’t perfect.
And weather stations have biased of location and personnel.
DocMartyn (Comment #108739)
“I cannot believe that the people in 1936 were so incompetent as to be unable to measure the maximum and minimum temperature within half a degree; yet this is what BEST suggest.”
It is not necessarily the temperature measurement per se but rather changes in micro climate of the station going forward that can result in a need for adjustments.
Venter:
Actually the correct statement is we do “know” … within uncertainty bounds.
If you want to test whether it’s warmer in July 2013 than in July 1936, you need to statistically test this proposition.
The trouble I have with various groups talking about temperatures being warmer or colder is they never get around to doing this. They compare central values, and if the central value is larger they pronounce “it’s warmer now”, without ever seeing whether, within uncertainty bounds, that difference in temperature has any meaning.
Re: Kenneth Fritsch
I’m thinking about it in the context of what I know about the historical temperature record and outside of some rare and unusual cases, I would be surprised to see breaks in one or the other series but not both.
Victor Venema (Comment #108740)
“The average temperature is available for much more stations, not all minimum and maximum temperature have been digitized yet. As the quality of relative homogenization depends on the noise in the difference time series, average temperature can thus be homogenized better and is likely of better quality. At least globally this would be the case, I do not know the situation in the USA, maybe here also minimum and maximum temperatures are fully available.”
GHCN publishes mean, maximum and minimum temperatures and these series are further subdivided into Unadjusted and Adjusted series. This would indicate that the adjustments are done on the maximum and minimum temperatures. I do, however, have a question into GHCN on my seeing max and min temperature series that were truncated around 1948 compared to the corresponding mean temperature which could go back past the turn of the 19th century. I have also have seen GHCN stations where the adjustments to the max and min series do not correspond to what I see in the mean series.
Kenneth Fritsch:
If those small changes would have random directions, they would not influence the secular trend much. If they go in the same direction, they would add up to one large trend and could be detected just as well as a single large trend of similar size. You may not get the begin and end times right, which is a problem if you are interested in weather variability, decadal variability and modes in the climate system, but the secular trend after homogenization, which is what most “sceptics” are interested in, would be corrected with similar accuracy.
Such difficult combinations are sometimes used in studies on a new or updated homogenization algorithm. Especially modern method detecting all break points in one series simultaneously, like such examples where older algorithms that detect the breaks one after another may have problems.
In our study, we aimed for realistic scenarios and inserted breaks at random dates and stations with a size that was determined by a normal distribution with a width of 0.8°C. We also inserted breaks at random dates in multiple stations. And we inserted local trends with a length of 30 to 60 years. The validation study, Zeke linked to in the post, is in an open access journal, so you can read all the details.
Exactly, the date of the break is uncertain and especially for small breaks can be a few years off. It is therefore more informative to look at how good the homogenized data reproduces the (nonlinear) trends and the decadal variability as at detection scores.
“Kenneth Fritsch
to
DocMartyn
“I cannot believe that the people in 1936 were so incompetent as to be unable to measure the maximum and minimum temperature within half a degree; yet this is what BEST suggest.â€
It is not necessarily the temperature measurement per se but rather changes in micro climate of the station going forward that can result in a need for adjustments.”
Come on seriously.
You think that the people who were running weather stations in the 1930’s placed them in places that caused them to read almost a degree more than WARMER the average weather station today.
That’s all you got.
Fine.
So the people in the 1930’s didn’t know how to position weather stations away from volcanic vents, large magnifying glasses from the ACME Corp and air-vents from heat intensive all night marathon dancing competitions and didn’t know how to read a maximum and minimum thermometer. This mis-siteing and inability to use a thermometer properly means you need to remove, on average, about 1 degree F from their data.
Sometimes I get the feeling Antony is too relaxed.
Kenneth Fritsch:
The breaks in minimum and maximum temperature often compensate each other (partially). For example, a change in the radiation protection would do so. Thus some breaks seen in the minimum and maximum temperature may not be detectable in the mean temperature.
Victor:
There is something extremely ironical about putting the word sceptic in scare quotes on a blog post regarding basic civility.
(One of the principles of civility in discourse is not to assume the other’s motives.)
Re: 108747
Your question about truncation prior to 1948 is probably at least partly related to the big move of stations from city centers to rural airports in the early to mid 40s. GHCN created long time series for many stations by combining earlier city data with later airport data.
Brandon Shollenberger,
I’m certainly not suggesting that “if you can’t prove me wrong, I’m correct”. Rather, I’m saying that if the preponderance of evidence suggests that I am correct, than saying that I should be jailed based on my work is not a constructive argument. While if is my job to convince you that my approach is right (which I attempted to do to some extend in this post), you are free to disaggree. All I would ask from you is an assumption of good faith on my part, and the part of my NCDC co-authors.
.
Venter,
2012 is the hottest year for the U.S. in the homogenized data. It is the hottest year for the U.S. in the raw data. It is the hottest year in the U.S. in the satellite data. There really is no question that 2012 was the hottest year on record for the U.S. (though not the world), regardless of your opinion of the validity of data adjustments.
.
MrE,
The code and algorithm documentation are in the original post, hyperlinked as “data and code” and “papers”.
.
Ed Darrell,
Heat islands are true local records. However, a disproportionate amount of station are located in populated areas, so if we disproportionately sample urban areas we will get a biased estimate of the overall U.S. temperature.
.
phi,
Temporally and spatially parallel perturbations are exceedingly rare. The major known inhomogenities (1940s era station moves, TOBs changes, 1980s instrument changes, etc.) are all temporally staggered. Even UHI doesn’t have a temporally uniform signature across all stations in a region (and you can use only rural stations to homogenize to avoid aliasing in any urban signal).
You need to explain more clearly what you mean by “the nature of non-climatic perturbations”. If you are referencing UHI, it is worth pointing out that the net effect of non-TOBs minimum temperature adjustments is to lower the trend vis-a-vis non-adjusted data. However, station moves to airports, TOBs changes, and the MMTS transition all introduce well-understood cooling biases.
.
Wayne2,
CRN was conceived back in the late 1990s, before McIntyre (or Watts) were a blip on the radar for NOAA folks. That said, work by Watts (McIntyre really doesn’t do much surface station stuff) has certainly increased the public attention on the need for well-cited stations.
There are really only a handful of scientists at NCDC who work on these data issues. Having worked with them extensively on a number of projects over the past few years, I have nothing but respect for their character, integrity, and scientific prowess. That is in part why I reacted with such indignation to Anthony’s remarks.
.
Scott Basinger,
Thanks for your remarks. I wanted to emphasize that while NCDC might not be correct (though, as I mentioned in the post, there is a lot of evidence supporting their position), they are making a good-faith attempt to create the most accurate possible temperature record. Statements that they are manipulating the data to obtain desired results are aggravating, knowing the people involved, how rigorous their work has been, and how open they have been to have other people replicate and test their approaches.
.
Ben,
I have a paper in press in JGR on UHI and homogenization that focuses specifically on min and max temps. I’ll be discussing that in the next week or two once we get the final proofs up. You can download a draft version (with the figures at the end) from the JGR In Press website in the mean time if you are interested.
.
Victor Venema (Comment #108740)
“@Kenneth Fritsch. Except for the additional correction for the TOBS, the rest of the inhomogeneities found in the USA cause a bias that is very similar to the bias found for the global datasets, about 0.2°C.”
Victor, to give you a feel for my analysis of the average absolute adjustments made to all of the stations from a given country I eyeballed some examples from my previous results in graphical form and give you those adjustments in the early period (the first part of the 20th century) and a later period (most recent 10 years or so). All adjustments are given in degrees C.
Country Early Late
US 0.7 0.3
Canada 0.25 0.05
Australia 0.25 0.03
France 0.1 0.0
Germany 0.12 0.0
Norway 0.30 0.1
Ukraine 0.0 0.0
India 0.35 0.0
Turkey 0.65 0.1
Russia 0.12 0.0
UK 0.15 0.0
Jan Galkowski, thanks, interesting comments.
Yes it’s well known that companies play all sorts of games with balance sheets, inventory and so forth. Regardless, they have a lot riding on getting the answer right, because if they don’t, they go out of business. Of course if they distort their financial data in “the wrong way” they end up facing fines, termination of their job or a long stay in the big house… but it’s clear that a fair amount of balancing of different forces are at work here.
For a weather station getting the answer right usually means not looking too ridiculous compared to neighboring stations so that your station doesn’t get shut down as unreliable. That could mean registering temperatures that are always off by a large offset, or simply poor quality site selection or maintenance.
The point here being “failure” for a government-sponsored weather station means something very different than it does for private enterprises.
It certainly is not the case that historically these stations were maintained to provide ultra-high accuracy temperature measurements, so if we want to use these stations for that purpose, additional effort is needed to homogenize the data, fix systematic effects associated with changes in observation times, equipment etc.
It’s actually interesting to look in depth why we think we can glean something about these temperature data. (That’s why the BEST project is of interest to me. I think another set of eyes on problems like this always helps.)
Carrick: “There is something extremely ironical about putting the word sceptic in scare quotes on a blog post regarding basic civility.”
I use “sceptics” for people that judge an argument by the results, whether it makes the trend stronger or not. If you are a true sceptic and you judge the result based on the strength of the argument, then I did not mean you. Then you can also call yourself an (amateur) scientist.
Commenting at WUWT once in a while, I have seen much worse things as a few quotes. 🙂
Have to go now.
Zeke:
But what are the uncertainty bounds?
I don’t think there is “no question”. It’s a valid question to ask whether we really know it is or not until the systematic uncertainty is fully accounted for.
Changes in geographical distribution of data, calibration methods, data collection methodology, land usage etc near the measurement site, do raise the specter that your certainty is a bit unfounded.
Victor, I use scare quotes to anybody who is skeptical of a thing regardless of whether they meet a purity test.
I too need to run along.
Wayne2,
Confirmation bias is certainly worth keeping in mind. That is why a good approach is to invite third parties to test and verify your approach, and make your work easily replicatable. I point out a number of independent lines of evidence that support the NCDC’s results in my post. Again, I’m not suggesting that they are infallible or even necessarily right. Rather, I’m suggesting that the evidence available to-date supports their position, and any argument going forward should start with the assumption of good faith on their part. Accusing them of manipulating the data because you disagree with the results is not a productive approach.
.
Kenneth Fritsch,
I usually tend to follow your lawyer friend’s example. In this particular case, having worked with Matt and Claude quite closely on a few projects and knowing how much time these sort of attacks take away from their ability to actually work on scientific projects, I needed a bit of a cathartic rant. Please take my assurances that this is something of a one-off, and my future discussions here will contain less invective 😉
.
JR,
Sometimes max and min can change separately. For example, if you convert a LIG thermometer to a MMTS thermometer (which happened to most instruments in the 1980s), you will get significantly lower maximum temperature readings post-transition (by upwards of 0.4 C!) but roughly the same minimum temperature readings, provided that you don’t move the instrument far from its original location.
.
DocMartyn,
People in 1936 did not have a network of instruments capable of precisely measuring the temperature field for the United States. Rather, they had a set of instruments (many with known biases or poor siting) in a set of specific locations. Going from those measurements to an estimate of the overall CONUS temperature is a non-trivial exercise, and simply averaging the absolute temperature readings available at the time will not give you a particularly accurate result. Given the persistent confusion over this issue both here and on Anthony’s blog, it might be worth a more in-depth post examining the difficulty of calculating absolute temperatures (vs. anomalies) with a toy model or two.
.
Victor Venema,
In the U.S. pretty much all stations have min and max readings, so they are homogenized separately. I’m pretty sure Matt and Claude have compared the results to just homogenizing the mean data; I’ll ask them if they noticed any differences.
Maybe we could step back for a minute. Anthony Watts is not a bad guy. He is hot-tempered and frequently wrong on the facts. This has bitten him on the butt repeatedly, but I guess he’s set in his ways.
The key to this contretemps is the first sentence in your post, Zeke. This cancer isn’t growing. It has been full-blown and metastasized for over a decade. Walking into a war and thinking it just started doesn’t help you understand what’s going on.
NCDC is to a certain extent an innocent victim/bystander. They deserve your defense and I hope Watts will find the good grace to acknowledge his hyperbole for what it is.
But anyone who has followed this for more than ten minutes understands perfectly well how much crap has been thrown in Watts’ direction, for how long, and the motivation of many who have done so.
Incitement to riot is not a legitimate excuse for riot. But if you’re trying to understand rather than react, spend a couple of minutes remembering how much and how much worse the abuse hurled at Watts has been.
Zeke:
Rod did an analysis here.
This probably doesn’t include all sources of error, but it certainty doesn’t look like, within uncertainty bounds, we’re warmer now in the CONUS than in 1936.
Maybe you could find a BEST conus reconstruction that includes uncertainty estimates? I’d like to see that.
I’d also like to see everybody in the climate science community who compares central values without looking at error bars get an anvil dropped on their foot. (Full disclosure: I own a crutch factory.)
Carrick,
Good question. Given how ridiculously over-sampled the field is (with ~20,000 stations in the co-op network), the sampling error is rather small. However, I don’t have a good number offhand for the error introduced by inhomogeneities (and the choice of homogenization methods). Perhaps we can bound it by the range of runs (with different possible homogenization parameters) in the Williams et al paper: http://i81.photobucket.com/albums/j237/hausfath/ScreenShot2013-01-24at100358AM_zpsbe024c02.png
Carrick,
Here is the Berkeley result for CONUS with uncertainty: http://berkeleyearth.lbl.gov/regions/contiguous-united-states
Re: Zeke 108759
Wrong. If you are going to quote the max difference between MMTS and LIG, then you need to quote the min difference as well- an increase of up to 0.28 C! MMTS breakpoints should show in both series.
Victor Venema (Comment #108750)
“The breaks in minimum and maximum temperature often compensate each other (partially). For example, a change in the radiation protection would do so. Thus some breaks seen in the minimum and maximum temperature may not be detectable in the mean temperature.”
That’s what I thought might be the case but with the stations I have sampled it was not the case. I have given those station IDs to GHCN. Also I think we might have a disconnect here in that if the adjustments are based on the max and min temperature series and those series are averaged to obtain the mean then even small differences in the min and max adjustments would be evident in the difference between the mean Adjusted and Unadjusted series. If, on the other hand, the max and min where averaged to obtain a mean and the algorithm was applied to that series the difference might be detected. But then how are the min and max adjusted temperatures determined?
JR:
“I would be very suspicious of different break dates for maximum and minimum temperatures. What is the justification for moving the maximum-recording thermometer, but not moving the minimum-recording thermometer?”
I was under the impression that the same thermometer was used to measure both the low and high temperature for the day.
I think what was meant by your quoted comment is that the average for the minimum temperature might move a different amount than the average for the maximum temperature.
As I understand it, the warming has affected nighttime temperatures (the low) more than the day temperatures (the high).
thomaswfuller2,
Agreed. All of my communications with Anthony have been unfailingly civil, and I believe he takes a good faith approach to his arguments. In this particular case, however, I think he was far out of line. Others on the activist side have been equally out of line by calling for bad things to be done to skeptics, and I condemn their remarks as well.
Victor Venema (Comment #108748)
“If those small changes would have random directions, they would not influence the secular trend much. If they go in the same direction, they would add up to one large trend and could be detected just as well as a single large trend of similar size. You may not get the begin and end times right, which is a problem if you are interested in weather variability, decadal variability and modes in the climate system, but the secular trend after homogenization, which is what most “sceptics†are interested in, would be corrected with similar accuracy.”
I’ll have to look at my simulation results again but I do think that several trend changes in a series will not add up to one large one with regards to ease of detection and I am rather sure that a trend that spans an entire period will not be readily detected when differenced against a series with no trend.
“But anyone who has followed this for more than ten minutes understands perfectly well how much crap has been thrown in Watts’ direction, for how long, and the motivation of many who have done so.”
Zeke couldn’t think of any examples of all that other cancer, off the top of his head. Apparently Anthony’s alleged fraud accusation was the straw that broke the camel’s back. Zeke can only take so much hyperbole, before he has to go hyperbolic. Self-righteous indignation is almost always very amusing.
I am not upset about the adjustments or about the need to spatially weight stations to achieve data coverage I understand the need and purpose of all of these things.
What bothers me is when they actually quote a hard number for a specific month and then the same organization quotes a different hard number for the exact same month a few weeks later. For the express purpose of showing that now is “hotter”.
I am not saying the individual scientists involved are being deliberately misleading and manipulative but maybe they need to be more involved in the press release process to avoid these accusations.
The press releases went out saying July 2012 was 77.6 warmer then July 1936 the previous record of 77.4 . Then a few weeks later it was July 2012 being downgraded to 76.93 but they also changed July 1936 to 76.43 making July 2012 “still the hottest”.
Why give the media numbers to make headlines with when you and I both know anomalies with error bands are the best we can do. Either they are willfully allowing these sensationalized press releases or they are intentionally giving out numbers for headlines that they can later change with the knowledge that nobody will see the later revisions and the effect of the headlines will already have served its purpose.
Nobody remembers a retraction or walk-back from a statement its the initial claims that count to the general public and is an easy place to start if climate science wants to gain back some lost respect.
Zeke I enjoy reading your work and Love this forum Lucia gives us engineers and laymen to interact with the scientists but take back the science from the PR people and the media relations types so trust can return.
Ben,
I agree with you that the scientists should be more involved in what the press office puts out. In the classic conflict between nuanced reality and simple story-telling, the latter wins out far too often.
As far as why the past changes, Peter Thorne had a good post explaining this the other week: http://surfacetemperatures.blogspot.com/2013/01/how-should-one-update-global-and.html
“The fundamental issue of how to curate and update a global, regional or national product whilst maintaining homogeneity is a vexed one. Non-climatic artifacts are not the sole preserve of the historical portion of the station records. Still today stations move, instruments change, times of observation change etc. etc. often for very good and understandable reason (and often not …). There is no obvious best way to deal with this issue. If ignored for long enough station, local and even regional series can become highly unrealistic if large very recent biases are not dealt with.
The problem is also intrinsically inter-linked with the question as to which period of the record we should adjust for non-climatic effects. Here, at least there is general agreement that adjustment should be made to match the most recent apparently homogeneous segment so that today’s readings can be easily and readily compared to our estimates of past variability and change without performing mental gymnastics.
At one extreme of the set of approaches is the CRUTEM method. Here, real-time data updates are only made to a recent period (I think still just post-2000) and no explicit assessment of homogeneity is made at the monthly update granuality (there is QC applied). Rather adjustments and new pre-2000 data effectively are caught up with major releases or network updates (e.g. with entirely new station record additions / replacements / assessments normally associated with a version increment and manuscript). This ensures values prior to a recent decade or so remain static for most month to month updates but at a potential cost if a station inhomogeneity occurs in the recent past which is de facto unaccounted for. This can only then be caught up with through a substantive update.
At the other extreme is the approach undertaken in GHCN / USHCN. Here the entire network is reassessed based upon new data receipts every night using the automated homogenization algorithm. New modern periods of records can change the identification of recent breaks in stations that contribute to the network. Because the adjustments are time-invariant deltas applied to all points prior to an identified break the impact is to change values in the deep past to better match modern data. So, the addition of station data for Jan 2013 may change values estimated for Jan 1913 (or July 1913) because the algorithm now has enough data to find a break that occurred in 2009. This then may affect the nth significant figure of the national / global calculation in 1913 on a day to day basis. This is why with GHCNv3 a system of version control of v3.x.y.z.ddmmyyyy was introduced and each version archived. If you want bit replication to be possible of your analysis then explicitly reference the version you used.
What is the optimal solution? Perhaps this is a ‘How long is a piece of string?’ class of question. There are very obvious benefits to either approach or any number of others. In part it depends upon the intended uses of the product. If interested in serving homogeneous station series as well as aggregated area averaged series using your best knowledge as of today perhaps something closer to NCDC’s approach. If interested mainly in large scale average determination and under a reasonable null that at least on a few years timescale the inevitable new systematic artifacts average out as gaussian over broad enough space scales the CRUTEM approach makes more sense. And that, perhaps, is fundamentally why they chose these different routes …”
Zeke — thanks. The quoted uncertainties though appear to be screwed up. They increase with time, which is backwards. Are temperatures really more uncertain in 2012 with 10,000 stations used than in 1910 with perhaps 2,000 stations?
Looking at the figure, you maybe have 1/5th the number of stations in 1936 as now, and if there are regions that are undersampled, that will lead to systematic errors, when trying to compare then to now.
Generally, since different latitudinal bands have different amplification factors, changes in distribution over time present challenges to accurate reconstruction.
More generally this is exactly the sort of problem I hope to see the BEST group tackle.
There are lots of problems where people get side tracked by the mechanics say of aggregating different data sets, and see the mere fact they can get a number that looks reasonable as a triumph.
Science though needs more than that, we need uncertainty bounds of course. A measurement without an error is a folly.
Because the adjustments are time-invariant deltas applied to all points prior to an identified break the impact is to change values in the deep past to better match modern data.
Here is the problem that I have with that statement. Take a look at the time series for Amarillo. According to the above, temperatures prior to the break near 1940 will be “pushed down” to match the more recent series, but that is obviously not correct. The clue is that the temperatures were trending up prior to the break and then trended flat after the break.
Ben,
The PR people and the media relations types don’t look over the shoulders of the scientists and then take their numbers and run with them. The scientists give the numbers to the PR people and characterize them for maximum effect. And doesn’t it seem that the hoopla is always about unprecendented heat, or drought, or fires, or cold and snow caused by-guess what-heat. There is a deliberate campaign to spread CAGW alarmism going on, and the scientists are willing participants.
JR,
Well, ideally homogenization would pick up and correct both the anomalous trend during the urban period and the breakpoint associated with the airport move. I would actually check what USHCN does, but I can’t seem to find any station named Amarillo in the database. Do you have the USHCN ID or lat/lon that I could use for reference?
Zeke: “Here is the Berkeley result for CONUS … ”
5 months missing for 2012.
Zeke- that is a GHCN station. #42572363000
“Zeke
DocMartyn,
People in 1936 did not have a network of instruments capable of precisely measuring the temperature field for the United States. Rather, they had a set of instruments (many with known biases or poor siting) in a set of specific locations”
May I then ask a very simple question. Do you know the names and locations of the network of instruments in the US, in 1936, which are not crap?
Can you give us the subset of those which had no breaks?
Then we could just compare these small subset of stations in 1936 and 2012 and see if they are, on average, about 1 degree F warmer.
Zeke: Perhaps I’m too rigid, but I have an aversion to the phrase “adjust the data”. Unless there is a single non-controversial method for unambiguously correcting blatant mistakes in a data set, the data is the data. Unfortunately, the data wasn’t (and still isn’t, except for a few CRN sites on 3% of the surface) collected under conditions suitable for accurately extracting a modest warming trend. So you must PROCESS (not “adjust”) the data to EXTRACT a warming signal from the data. Why are semantics important?
One trivial reason is that “adjusted temperatures” are at the heart of Andy Watts’ argument. Citing temperatures that have been adjusted downward for July 1934 and saying that July 2012 was warmer is a dubious proposition (which is why you are having trouble coming up with a satisfactory answer to his question). The only thing that is relevant is the DIFFERENCE in temperature, both before and after correcting for biases and uncertainty. The DIFFERENCE is indistinguishable from zero in both cases! Therefore press releases on this subject seem reflect the politicization of science and the NCDC has earned the attention they received from Fox News on the subject.
More importantly, to properly understand the uncertainty in the warming signal, you need to combine the uncertainty in the noise in the raw data with the uncertainties AND biases contributed when attempting to remove known biases. From my naive perspective, a “pairwise homogenization algorithm” is simply an opportunity to spread bias from stations effected by increasing UHI bias to nearby stations and should be regarded with suspicion until stations potentially biased by UHI have been removed from this process. If BEST’s method for extracting a warming signal in the absence of UHI turns out to be correct, they will be the first avoid this problem after two decades of analysis. However, until they can demonstrate the presence of UHI bias their non-rural stations, no one can be sure they have eliminated the stations biased by UHI. (We know there are some stations whose trend is biased by a large UHI. Until one finds them, we could be looking in the “wrong place”; which is the best place to look when you don’t want to find something.)
Here in the US (but not elsewhere?), we know that the historical trends are contaminated with a large, changing time of observation bias, which has negated some warming. It is totally absurd to discuss the US trend without removing TOB. Remove TOB using meta-data (real data), not the PHA; and include the documented uncertainty in estimating TOB from Trenberth’s paper.
Do we need to use a PHA to “improve” the data? Is there any real data that leads us to suspect that the average station move is associated with an overall warming or cooling bias? If not, station moves appear to be just a part of the ordinary noise in the data and PHA’s simply artificially suppress the scatter in the data.
DocMartyn – many of the changes (especially screen changes, TOBS, and thermometer changes) do have known, tested-for, systematic biases.
I would also think it remarkably unlikely that you could find any screened stations with same TOBS, screen and instrument from 1934 but I do think there would many where there are overlapping records to give confidence on the homogenization process. The stations used to determine the biases for a start. Perhaps start with papers on this to find them?
Zeke:
Zeke, I have no problem with the position you advance here, but it isn’t what you said in the quote I provided. You specifically said “the proper way to respond is to create your own approach and demonstrate that it is superior.” By saying “the proper way,” you say there is only one way to (properly) respond if you disagree with someone’s methodology or approach.
In reality, there are lots of proper ways to respond to someone who’s approach and methods you disagree with. You might get in touch with the person and ask questions to see if your disagreement is well-founded. You might show a problem with their approach/methods and ask them to correct it. You might just suggest something they could try to see if it improves things. All of those are proper responses, as are hundreds of other possibilities.
It may not have been your intention, but you said none of those are acceptable. You actually said it is not a “proper response” to ask questions.
JR (Comment #108776)
“Take a look at the time series for Amarillo. According to the above, temperatures prior to the break near 1940 will be “pushed down†to match the more recent series, but that is obviously not correct.”
Well, here is what GHCN actually did. The green is adjusted, red unadjusted. So they are identical back to about 1950, then it is adjusted down prior to the break. The algorithm doesn’t get the break year quite right.
‘(We know there are some stations whose trend is biased by a large UHI. Until one finds them, we could be looking in the “wrong placeâ€; which is the best place to look when you don’t want to find something.) ”
Do we really know this?
you know C02 goes up and the temperature goes up, and we are told that it could be something else.
you know the buildings and population in a city go up and the temperature goes up, well it could be something else.
ln(unicorns)
Frank,
“It is totally absurd to discuss the US trend without removing TOB.”
US TObs corrections are quite singular (see eg Menne 2009, fig. 3). They are so unlikely (statistically speaking) that it is not absurd to regard them with some suspicion.
“Phil Scadden (Comment #108783)
The stations used to determine the biases for a start. Perhaps start with papers on this to find them?”
I am neither an idiot or a neophyte.
I know all the damned arguments for adjusting the data and know that people have come up with plausible data massaging routines.
What I don’t know is if the routines are bollocks or not.
I am skeptical on many levels;
Firstly, is there warming? Possibly, but the way data is homogenized means it is impossible to test if there has been a change in homogenized temperature or not. You are measuring different countries if you use sensors in completely different regions.
The only true test is to examine the temperatures in the same locations with sensors in July 2012 and thermometers July 1936. The TOB disappears if you use a single months averages.
(Reply do it yourself).
Secondly, is it CO2? Well probably not in the USA. The BEST data is quite informative of this. If you look at the (Tmax+Tmin)/2 and (Tmax minus Tmin) from 1955 you can see a man-made change in temperature.
In about 1965 temperature start to take off in a linear fashion, and the same rate continues until the present day. (Tmax minus Tmin) falls from 65-85 and then rises from 85-2012. This second phase is the time period when electronic sensors were introduced.
The differential plot of (Tmax+Tmin)/2 vs. (Tmax minus Tmin) is biphasic, like a V tilted 90 degrees clockwise.
The fact we have two intercepts tells us we have two quite different phenomena increasing the (Tmax+Tmin)/2.
Doc
If you mean that people in 1936 could not measure the maximum or minimum temperature on a specific location on a specific day to within 1/2 degree: That’s not what BEST suggests about their ability to measure an individual temperature.
Well Lucia, what does it mean?
Can you get me out of the queue?
DocMartyn,
I’ll repeat an example I gave earlier, which might help explain why your question is a tad more complicated than it sounds. I’ll also probably do a follow-up post at some point on the anomaly vs. absolute issue.
________________________
The Monthly Weather Review for 1936 (or USHCN raw data for 1936) will give me the recorded measurements at all stations available. However, a simple average of these will not necessarily result in a good estimate of U.S. absolute temperatures, due to unrepresentative siting (many stations back then were fairly urban), instrumentation (CRS measures higher max temps than actually occur), and spatial coverage (there were fewer stations back then, and the elevation of stations doesn’t necessarily represent the elevation profile of the CONUS).
The way regional/national average absolute temperatures are calculated is to add anomalies to a modeled field, or to spatially interpolate between absolute readings. The use of anomalies is preferable when evaluating changes over time as it corrects for differing absolute temps and isolates changes; the absolute approach is better for current weather reports where the decadal-scale continuity of measurements is irrelevant.
Put simply, you can average all the readings from all the stations in 1936 and get a rough estimate of U.S. temperatures, but it won’t be particularly comparable to temperature measurements taken in 2012. To create a comparable estimate you both need to use anomalies (to correct for things like elevation and to some extent urban locations) and some sort of homogenization to correct for station moves, instrument changes, and the like.
Doc
I don’t see any DocMartyn comments in the spam or moderation bins.
“Put simply, you can average all the readings from all the stations in 1936 and get a rough estimate of U.S. temperatures, but it won’t be particularly comparable to temperature measurements taken in 2012.”
That is probably because they were not using the same instruments, in the same places, at the same times. But you can pretend to correct for that and get a rough estimate, if you must pretend to have a fairly precise comparison. Rough estimate compared with rough estimate averages out to close enough. Right, Zeke?
In order;
1) unrepresentative siting (many stations back then were fairly urban)
2) instrumentation (CRS measures higher max temps than actually occur)
3) spatial coverage
4) the elevation of stations
Now 1), 3) and 4) allow me to change the temperature average of the USA in what ever direction I want.
One can increase the density of stations in areas that are warm and remove those from areas that are cool; or vise versa.
I AM NOT SAYING THIS IS WHAT YOU DID
As I have stated before, the only way you can do the comparison of 2012 and 1936 is to use stations that are in the same local in the two datasets.
If your homogenization procedure give a much different, and higher 2012, I will be very surprised.
i do not think you can ever emulate stations that didn’t exist in 1936 in mountains or in the North. You can eliminate existing stations and compare ‘sweet’ 1936 stations with ‘sweet’ 2012 stations.
The possibility that the warming you are seeing is an artifact, caused by inappropriate ‘adjustments’ is why skeptics are skeptical.
2) I find it difficult to believe that liquid thermometers are inferior to electronic thermometers, over any equally long time period.
I have used both electronic and manual liquid thermometers in real life and use the latter where ever I can.
Nick Stokes (Comment #108785)
“Well, here is what GHCN actually did. The green is adjusted, red unadjusted. So they are identical back to about 1950, then it is adjusted down prior to the break. The algorithm doesn’t get the break year quite right.”
Interesting, Nick Stokes, since that is a question I have into GHCN, i.e. the alignment of the Adjusted_Unadjusted series difference breaks and the breakpoints I see in the difference series of the reference stations to their nearest neighbors (for the Unadjusted series) do not align very well. It would indicate that the adjustment precedes in time the breakpoint. I am hoping for a timely answer to that puzzle from GHCN.
“Now I say, wearing my Statistical-God pointy hat, the vast majority of station moves are due to not random events BUT have the same underlying cause.
Wearing my smarmy biological sciences been buggered by this before hat, I can tell you that the vast majority of station moves are due to the two-headed property-price/Urban heat Island dragon.”
After a long day, and a very long thread read – this made my evening!
Thanks Doc.
RickA :
No, the minimum and maximum thermometer are installed together in one screen and thus moved together, but they are 2 different instruments.
Frank:
Do I hear Anthony Watts? After all these years of blogging, he could at least have tried to understand how relative homogenization works and avoid this meme.
Let’s take the simplest case, one station in an urban area (U) and two outside (R1 and R2). U, R1 and R2 all experience the same change in the regional climate, but U may have an additional trend due to urbanization. If there is a (stronger) trend in U as in R1 and R2, you will see a trend in the difference time series of U-R1 and U-R2, while the difference time series of R1 and R2 is flat. Thus by comparing multiple pairs of stations, you can see which stations has the problem and correct it. No smearing anywhere. This is explained better with some figures on my blog.
Probably Zeke knows better, but as far as I know the urban stations are not used to correct rural stations in the PHA. I consider this explicit step unnecessary, but it does not hurt and you would hope it would appease some “sceptics”.
Frank:
The TOB is removed using metadata. Zeke only wrote that *if* you do not do so, the PHA will remove them. Which is also nice as metadata is never perfect. If you are interested, I wrote a short introduction on the time of observation bias and its correction.
Frank:
There are many more reasons for inhomogeneities as just moving an instrument. In the 19th century people often performed temperature measurements at a North facing window of an unheated room, but in summer the sun may heat the instrument or the wall below durign sunset and sunrise. Later many countries started using screens that were open to the North and the bottom, which is good for ventilation, but if the soil is dry it may heat up and heat the thermometer. Then most countries introduced Cotton Region Shelters, which are closed to all sides using double louvre walls and a double roof. Nowadays many measurements are performed by automatic weathe stations with often have mechanical ventilation, reducing radiation errors further; on the other hand if an instrument was broken or the ventilation blocked by ice, in the past the observer would notice it when reading, in case of an automatic weather station such problems are not always noticed in time. Then we have the time of observation bias and urbanization. In the Check Republic they used a plastic Cotton Region Shelter for some time, which reduces maintenance, until they noticed that on very hot days in summer the plastic deformed and let the sun in. In the past people used quicksilver thermometer, which cannot measure temperatures below -40°C, nowadays alcohol thermometers are preferred, especially for the minimum temperature. Growing vegetation may block the sun or make the ventilation worse. There are many possibilities. On average there is one break every 20 years, makes Docs strategy of using only stations without inhomogeneities impossible.
Furthermore, people are not just interested in the USA average or global average temperature, but also in local information for public health, hydrology, ecology and the calibration of climate proxies. People are interested in the variability of climate at all time and spatial scales and in the relations between various climatic elements.
As I have stated before, the only way you can do the comparison of 2012 and 1936 is to use stations that are in the same local in the two datasets.
############
fundamentally untrue.
Victor Venema, a maximum and minimum thermometer is a single ‘U’-shaped piece of glass. One end has an alcohol working reservoir and the other reservoir with alcohol vapor expansion chamber.
The U is filled with mercury and a pair of pins sit on the mercury on both U arms.
When it is hot the ethanol expands and pushed the mercury round to the side with the expansion chamber. On cooling the pin stays behind on this side. When the minima is reached the second pin reaches its highest point (lowest temperature).
http://en.wikipedia.org/wiki/Six%27s_thermometer
“Steven Mosher (Comment #108798)
January 24th, 2013 at 5:21 pm
As I have stated before, the only way you can do the comparison of 2012 and 1936 is to use stations that are in the same local in the two datasets.
############
fundamentally untrue”
OK Mosher. Compare reading more than 75 years apart collected at different locals, different altitudes and at different densities by mathematical magic and many people will believe that you have, erm, over reached.
I do not believe that you have in any way, shape or form proven that the summer of 2012 was warmer than 1936, on the continental USA.
I might just be persuaded if you did the same averaging procedure on stations that are temporally different, but geographically the same.
it’s not in anyway personal, I like you and Zeke, you just appear to be balancing an elephant on its trunk and telling me its a tree.
Victor Venema,
Currently USHCN uses all stations (both urban and rural) to detect inhomogenities. As we discuss in our upcoming paper, however, if you use only rural stations to homogenize you get nearly the same results, with the exception of the early period (pre-1930s) where the low density of the station network results in more breakpoints going undetected.
http://www.agu.org/pubs/crossref/pip/2012JD018509.shtml
ftp://ftp.ncdc.noaa.gov/pub/data/ushcn/papers/hausfather-etal2013-suppinfo/
DocMartyn,
Anomalies are mathematical magic, at least in a world with a high spatial correlation of temperature changes (but a relatively low spatial correlation of absolute temperatures). As I said earlier, I’ll do a more detailed post on absolute temps vs. anomalies later, but this article by Lucia should help illustrate their usefulness when you have stations in the network changing over time: http://rankexploits.com/musings/2010/the-pure-anomaly-method-aka-a-spherical-cow/
@DocMartyn. Yes, a minima-maxima thermometer is a single U-shaped instrument, I should have read the Wiki page I linked to. 🙂
Still, as far as I know it is typical to have separate minimum and maximum thermometers (and a normal one) inside of a shelter, but I will have a look at that.
Zeke, I know that everywhere in the USA is different from everywhere else in the USA. I know this stuff isn’t easy and know you are trying hard to answer a difficult question.
I count cells for a living and have to both living and dead cells. Now don’t have a working definition of what constitutes dead; apparently its sort of like pornography, you know it when you see it.
You can have a station in the middle of a field and get one (Tmax minus Tmin)/2 and move three miles towards the large lake and get a second (Tmax minus Tmin)/2; I know this having lived near a lake.
Victor, I went back and checked some examples of how a breakpoint function/algorithm can fail to detect a rather large change in a non climate trend placed in a difference series. If a large trend over the entire length of series is placed onto a series that has no breakpoints the breakpoint function will not “find” a break. If smaller incremental trends are placed in the series over its entire length that are all in the same direction and add to a large trend the breakpoint function will fail to detect. Further if a series that already has detectable trends is superimposed with a single large trend or smaller incremental trends in the same direction adding to a large trend, the imposed trend can cause previously detected breakpoints to be no longer detected.
Also of interest is the fact that if one presents simulated arima models of the anomalized difference temperature series with a standard deviation of 0.55 for breakpoint determination a number of breakpoints can be found in a 1000 data point series. Very few or no breakpoints will be detected if one simulates a 1000 data point series with a normal distribution and a standard deviation of 0.55.
Of further interest is that, if one constructs or takes from observations monthly difference series that are 90 to 100 years long and measures the breakpoints and then divides these series into shorter segments of say 10 years and then measures those breakpoints summed over the short segments, the breakpoints will not necessarily correspond in dates or in number to the parent long series.
DocMartyn,
Indeed. But this is the important point: if there was an average warming of 0.2 C at the field station last year, the was almost certainly also an average warming of around 0.2 C at the lake station over the same period, assuming the stations were otherwise undisturbed. Changes in temperature are highly spatially correlated, and the longer the period you are looking at the higher the spatial correlation. Absolute temperatures are not. By converting absolute temperatures to anomalies you can get a reasonably good estimate of the average climate changes over time, even if some stations are retired and new stations are created. If you simply average absolute temperatures, however, adding a new high-elevation station to the network would throw off the average quite a bit (but not impact the anomalies).
Now, anomalies only work well IF the station records are not subject to localized changes due to non-climatic factors. In practice, at least over time spans of decades, this is rarely the case. So additional work (e.g. homogenization) must be done to remove any local perturbations that are not reflected in the regional climatology. Again, because longer-term climate changes occur regionally (not locally), and perturbation of a local record not reflected in other nearby stations is likely a non-climatic factor and should be removed if your goal is to calculate an unbiased estimate of regional climate changes over time.
Zeke, sounds like a nice paper. Somehow I missed that one in the weekly mails with new papers send out by JGR.
Did you simply remove the urban stations from your dataset? Should it not be okay to use urban stations for the detection of breaks, isn’t the only potential for biases in the correction? That way, the lack of stations in the early period might be lessened a little.
This is probably just me, but I see that a lot of phantom issues raised here and at other places and times about temperature series and the adjustment of those series that do not really address the real potential problems, and as a matter of fact subtract from a discussion of the real problems.
Victor Venema,
Its still in press (proofs are being approved), so its not really out yet. We only had time to do basic urban-only and rural-only. Your suggestion of using all stations for breakpoints but only rural for correction is a good one, however.
Its also worth noting that the early period issues are significantly ameliorated in USNCH v2.5, which is quite a bit more sensitive in its breakpoint detection process.
Zeke, I must admit that I find this ‘changes in temperature are highly spatially correlated’ completely unexpected. Living near the great lakes, both above and below the US border, it runs counter to my personal experience.
Lakes drop the diurnal range and the wind pattern and cities raise both min and max temperatures. I could be completely wrong, as I have never looked at a row of stations surround a lake, but that would be my a prior guess.
In the winter I would expect to be a huge change in temperature patterns near freezing point in damp vs. dry habitats.
“If you simply average absolute temperatures, however, adding a new high-elevation station to the network would throw off the average quite a bit (but not impact the anomalies).”
Anomalies certainly help but still the correlation of station temperatures should take varying elevation into account just as it should proximity to large bodies of water and latitude and even perhaps population in some areas of the world.
It is also of interest to note that while closely spaced stations can correlate well with temperature anomalies, the trends resulting from closely spaced stations can vary quite a bit when compared to an average regional trend. It is that old bug a boo that temperature reconstructions face with the difference between high and low frequency correlations.
Kenneth Fritsch, may I ask, did you use a reference series and perform the detection on a difference time series? If you did, I am wondering which homogenization algorithm you used.
Statistician like absolute homogenization algorithms and such algorithms sometimes see gradual changes as okay and will only homogenize discontinuities. In climatology absolute methods should only be used as method of last resort and personally I would prefer if people did not use them at all and would simply say, sorry we do not know, there is no reliable data.
If it is a normal relative homogenization method, I do not understand why it does not see a trend as inhomogeneity, clearly the difference time series in not noise around a constant level, which is the null hypothesis.
If there are temporal correlations in the difference time series this will increase the false alarm rate of the statistical detection test. In a difference time series the correlations from year to year are typically very small, these correlations (and the correlation length) are much smaller as the correlations in the climatic time series themselves, which include regional climatic variations.
The numerical experiment in your last paragraph, I do not understand.
DocMartyn,
They key is that they are spatially correlated over longer timeframes. E.g. the change between temperatures of December of last year to December of this year will be similar for both, even if the Field stations drops more from November to December than the lake station does.
Here is the classic Hansen and Lebedeff paper from 1987: http://goo.gl/EDD9R
And a more recent one for Australia: http://goo.gl/i2Hmu
http://en.wikipedia.org/wiki/1936_North_American_heat_wave
“The 1936 heat wave followed one of the coldest winters on record.”
Did the extreme heat cause the extreme cold, or was it the other way round?
Was the summer of 1936 hotter than the summer of 2012?
They thought it was hot prior to the CO2 era, but they didn’t know what hot is, like we do.
http://en.wikipedia.org/wiki/U.S._state_temperature_extremes
Kenneth Fritsch,
Anomalies aren’t perfect, but they are considerably less biased than trying to do a reconstruction with averaged absolute temperatures. Do you know of any approaches off-hand that explicitly use elevation or other factors in their analysis? Based on work I’ve seen, apart from extreme cases (mountaintops and such), long-term trends are pretty insensitive to elevation differences, at least in the U.S.
Zeke, so what happens if I plant grass for hay, then 20 years later soy and finally in the twilight of my farming life I plant corn?
Here is proof that the thermometers back in the 30s were running hot. Must have been due to the Depression.
http://wattsupwiththat.com/2012/10/24/climate-and-state-high-temperature-records-wheres-the-beef/
DocMartyn,
Well, let say changing the crop to soy from hay creates a jump in temperatures of 0.2 C relative to the average temperature before changing crops. If that jump does not show up in other nearby station records, the homogenization process will flag it as a breakpoint and adjust it away.
If all the stations nearby are located on farms, and they all switch crops at the same time (with similar temperature impacts), then homogenization would likely not be able to pick it up. In practice, these approaches tend to look at a lot of nearby stations, so if there were a few stations with a jump that was not shown in most others it would still be corrected.
The general idea is that any local climate changes (at least over periods of time; we aren’t talking about hour to hour fluctuations) that are seen at an individual location but not more broadly in a region are assumed to be artifacts of that station’s location and not a true climate signal.
DocMartin
I don’t know why you find it surprising that temperature is spatially correlated. If you took the data and computed spatial correlations you would find that it simply is so. It’s an empirical fact.
It’s even a rather obvious one: I live relatively near Lake Michigan– one of the great lakes. But I’m in the western suburbs roughly 30 miles from the lake shore. When Chicago is having a heat wave, so are we. When it’s having a cold snap, so are we. Heck, you could practically say the same thing for Chicago vs. Des Moines, IA, Minneapolis, Minm and even Ann Arbor, Mich. Meanwhile, knowing there is a heat wave in Chicago give little predictive value for knowing whether there is a heat wave in Sydney Australia, Lyons France or some other far away location.
Generally speaking the closer two cities (or just points on the globe) are, the more likely they will experience heat waves and cold waves at similar times. That’s the strong spatial correlation Zeke is talking about.
You can get a strong impression of this effect by watching national weather reports and predictions on television.
The strong spatial correlation in anomalies holds true even though absolute temperature in Minneapolis is generally colder than in Chicago– but the anomalies — that is temperature above or below the “normal” for that day have large spatial correlations. Holds true whether or not suburbs on the lake tend to be a bit cooler during the summer than suburbs off the lake. It holds true even if the lake affects the diurnal variation.
Those are differences in the means of the absolute temperature and are removed by using the anomaly method.
I’m not sure what your point is. The area around Great Lakes regions tends toward “damp” to “not very dry” as far as land goes. Nevertheless, when the pretty damp area called Volo bog in Ingleside is having a heat wave (or cold snap), the non-boggie fields in nearby Gurnee or Libertyville are generally also having a heat wave (or cold snap) and the region over Lake Michigan is also generally having a heat wave (or cold snap). That is: all three regions will have hotter (or colder) than normal temperatures for the time of year at similar times. (See http://dnr.state.il.us/Lands/landmgt/parks/R2/VOLOBOG.HTM for bog. https://maps.google.com/maps?oe=utf-8&client=firefox-a&q=ingleside&ie=UTF-8&hq=&hnear=0x880f9d492523a95f:0xb71889f01efb0cde,Ingleside,+Long+Lake,+IL&gl=us&ei=8t8BUc3MNeXkygGBw4DADw&ved=0CKgBELYD for map with towns. Scroll out to see Lake Michigan.) Meanwhile, knowing whether this geographical area is having a heat wave (or cold snap) gives little predictive value about whether Paris France is warmer or colder for the time of year.
I for one hope Anthony does not apologize. He did not ask jail time for anyone, he simply pointed out his opinion on the adjustments to temperature in a very “clear” manner. I would like to see a little more outrage against those calling directly for murder of skeptics as well as the policy-creating lies regarding climate change damage.
Just recently Berkeley published a temperature series with an inaccurately calculated CI, has been told about it, and has failed to make any reply at all to the problem. They also published a very-likely faulty paper on UHI.
Anthony has a ton of history in the field of temperature measurement, he is just a little pissed because with UHI and poor quality adjustments, it is unlikely that we know if this was a record year for the US. Blame him for not selling the message as well as you would like but nobody was hurt so there is no need to apologize.
“Lucia, I don’t know why you find it surprising that temperature is spatially correlated”
I would have guessed that areas with the same type of ecology and along the same latitude would have been more closely related than two places with different terrain and separated North-South.
I would have guessed coasts would be quite different from inland, like the Chile Pacific coast
Lucia, Temperature is spatially correlated, but not on all boundaries.
Even at nation level, like Canada for example, the west is cooling (probably negative PDO) and the East is warming (AMO still positive).
But along the boundary, one side is NOT correlated with the other side.
http://sunshinehours.wordpress.com/2012/12/09/canada-grid-square-choices-5×5-warming-and-1×1-cooling/
And I know the same thing happens at much smaller distances.
“They also published a very-likely faulty paper on UHI. ”
huh? where, that’s news to me.
Doc–
With respect to spatial correlation in anomalies the issue is large scale weather systems that move and settle over areas. You will see differences in absolute temperature within these areas, but there is a very strong correlation in anomalies.
Think about the area covered by a hurricane at any given time. All regions covered by the hurricane tend to be getting lots of rain, wind etc. This is just as true of the regions on the north, south, east or west edges of the hurricane. The regions over water are getting rain and the regions over land are getting rain. Ok.. right in the eye, there is calm. But still, that hurricane is a very large feature embedded in an even larger “weather system”.
For example: Some years ago a hurricane hit the east coast of central america, tore over Guatemala and exited over the pacific by way of El Salvador. As it was passing, there was lots of excess rain in the mountains on the coast and everywhere. They had mudslides in El Salvador.
So: Big correlated weather system.
I think part of the problem is you are thinking about absolute tempeartures. So, for example, absolute (non-anomaly) temperatures will be lower at the tops of mountains relatives to coasts. This happens because you exchange potential energy (elevation) for thermal energy (temperature) was air moves up and down. Temperatures will tend to be warmer and climate dryer on the downwind side of mountains (because the water precipitated out as it cooled while traveling up to the peak.)
But this very obvious feature has nothing to do with the anomaly. The anomalies can still be correlated. The reason is that if the air is relatively cold (say 0C) over the pacific before the wind pushes it up the Chilean peaks, an amount related to the elevation. (Let’s just pick a number– say 10C). So, at the top it’s (0C-10C = -10C).
But if the air were warmer over the pacific– say 15 C, it’s temperature will still drop roughly 10 C from the bottom of the top. So… now the top of the mountains will be (15C-10C=5C). (This is rough– in reality, the temperature drop will be affected by moisture. But I want the concept here.)
Whatever the anomalies related to that weather system are, they will tend to be correlated. In both cases, the top of the mountain and the bottom of the mountain — near the coast– will have highly correlated anomalies even though everyone knows the top of the mountain tend to be cooler than the coast (In this example, I made the difference in absolute 10C– just to have a number.)
Bruce–
Thanks. The graph you show is a good example to prove Zekes contention that weather patterns are spatially correlated.
I don’t know what you mean about “along the boundary”. Weather being correlated merely means we’ll see clusters of blue and clusters of red in a graph such as yours. That’s what we we see in your graph.
Zeke (Comment #108815)
“Anomalies aren’t perfect, but they are considerably less biased than trying to do a reconstruction with averaged absolute temperatures. Do you know of any approaches off-hand that explicitly use elevation or other factors in their analysis? Based on work I’ve seen, apart from extreme cases (mountaintops and such), long-term trends are pretty insensitive to elevation differences, at least in the U.S.”
Surely you did not think I was suggesting using absolute temperatures with consideration to other factors that can effect correlations like elevation. I was pointing out that yes it is required to use anomalies in these comparisons but that you need to go a step further with consideration to factors like elevation which can affect the correlation of anomalies.
Jeff Condon (Comment #108820)
Jeff, those kinds of statements like Watts made are counterproductive and cause much wasted effort in side tracked discussions that never get to the real potential problems.
Jeff
I agree their behavior is outrageous– and more so. Calling for people to be murdered is worse than describing behavior and then alluding to jail time. Heck, if you said some people say very bad things about Anthony himself– worse things than Antony said– I’d agree with that too. I agree Anthony is pissed at NCDC and I even sympathize to some extent.
But I still think it would have been better if Anthony had not alluded to jail time and I think so even if there are people out there who say even worse things. Heck– I like Anthony. I don’t want to hurt his feelings, or alienate him. But I still think he should avoid unnecessary polarization by alluding to “jail time” in context of discussing temperature reconstructions — especially if he’s talking to people at Fox News!
Carnac predicts he won’t. Still… I do think he will avoid making direct allusions to “jail” when discussing his views about NCDC’s analytical choices when creating temperature reconstructions.
Lucia, you say, ” But I still think he should avoid unnecessary polarization by alluding to “jail time†in context of discussing temperature reconstructions — especially if he’s talking to people at Fox News! Lucia, why especially Fox? Do you suppose that they are the only cable news group that might tell the whole story. Gosh Lucia, if there was something nefarious going on at NCDC, and I am not suggesting there is, do you really think it would be reported at MSNBC or CNN?
Kenneth Fritsch (Comment #108827) . Kenneth, given the dodgy-ness of quite a few climate scientists, this kind of discussion serves a very good purpose, namely keeping both sides of the debate on high alert. Nothing but good can come from that. At least they know someone has them under a microscope.
Victor Venema (Comment #108812)
January 24th, 2013 at 6:35 pm
Victor, I modeled a simulated difference series based on observed data from a difference series. That lowers the standard deviation from what it would be if I used an undifferenced series. I than added in the trend changes to that series. When you simulate series it is a little difficult to use a difference of two series unless you can also simulate a correlation between the series. Anyway adding in the trends to a single series should approximate differencing two series one without the trend and the other with it. I used the breakpoints function in R library (strucchange). I used 1000 points of data and with a minimum segment length of 36.
Victor, I think it is rather easy to see why the method does not pick up the breakpoints if you think of the extreme case where you would superimpose a trend over the entire length of the series. There is no break in the series. The method sees only what is within the series and there are no break start or end dates.
The segmenting experiment shows what I think is termed end effects in breakpoint detection, thus the difference seen in breakpoints when a long series is segmented.
Also the minimum segment parameter, h, in the breakpoint function is critical in finding breakpoints. Using a very small h can lead to finding breaks in the series noise.
.
Bob
Because they are a large widely watched television news service who is likely recording– to get quotes accurate– and who has a large large bull horn. In contrast, you don’t necessarily have to be quite as careful if you are having a casual conversation while sipping coffee with a single individual.
I’d say the same thing for many cable news groups particularly any with a reputation for liking to be a bit more on the .. uhmm… what’s the best word… theatrical(?) side. MSNBC is pretty similar to Fox in this respect. Fox happens to be the one he was talking to so I named it.
I have no idea why you are asking me this. But I would suggest that Anthony avoid making allusions to “jail time” when discussing analytical treatments of temperature reconstructions during discussions with MSNBC and CNN also. Of course, if they don’t write any stories, what he said to them would have no more consequence than what he might say over dinner to his wife.
But… still.. if any cable news agency is interviewing you, there is the potential for your words to be broadcast on cable. It’s worth avoiding making statements that can be interpreted as suggesting people with whom you disagree are engaging in behaviors that might be somehow deserving of jail time.
Lucia, you say, ” Fox happens to be the one he was talking to so I named it.
do you really think it would be reported at MSNBC or CNN?”
With due respect Lucia, that is not true. You said, especially Fox. I think Zeke and you are much too sensitive on this topic. I know you are a Luke, but Lucia, there is a ongoing war for the economic future of the world. You do understand this, right!
Lucia, boy do I respect you math abilities and your homespun demeanor. To clarify, in some defense of Anthony, that with billions of dollars being thrown towards the ” AGW meme in the form of multi-institutional grants (NSF, NOAA, EPA, DOE, -and now even the military, the state department, DOI, etc.), Anthony throws a spitball and you and Zeke cry foul and seek to disarm him. Sound silly to you?
Carrick,
I agree and thatw as my point. Trumpeting the results without talking about uncertainities and error bars is cheating. That’s what NOAA/NCDC did.
And Zeke, yes, you prove that Anthony was absolutely spot on with his comments as for the stand you take, such comments are fully deseved. Notice that Anthony’s comments were against a taxpayer funded Government Organisaion exhibiting deliberate malfeasance. So if they feel it libellious let them sue. Why are yu hjot under the collare and being their mouthpiece? Since when do you get to decide that stating ” unethical behaviour ” about what NOAA/NCDC did is fine and what Anthony state was not fine? Since when do you get to be a arbiter of what language Anthony can use when expressing his opinions about a Government Organisation?
And how about answering the balance questions about your non-posts and non heard howls of outrage for the language used against sceptics in the same article by the pro-AGW camp. You have exhibited deafening silence. That is hypocritical.
And where were you when Trenberth of NOAA/NCDC, Hansen of GISS and the pro-AGW crowd were sing far much worser language against skeptics and calling coal producers merchants of death? How many posts did you write condemning them?
And you of spirit of civility after all the language these guys used against skeptics and Anthony? That’s the height of hypocrisy.
He’s not accusing them of fraud, he’s just saying that they would go to jail if they were businessmen and traders rather than climate scientists. Because that’s what happens in the real world when known deficiences in historical data are addressed with published methods. Certainly, every time Fama and French revise their historical rate of return, they spend time in the big house, as they should. Filthy data manipulators.
http://mba.tuck.dartmouth.edu/pages/faculty/ken.french/data_library.html
From JoNova on Monckton’s planned visit down under:
“He’s dangerous. During his last Australian tour he debated at the National Press Club, and a phenomenal 9% of the polled audience changed their mind in an hour. Fifty university academics (including Lewandowsky) tried to get Monckton banned from speaking at a university. Activists were so scared they intimidated a few venue operators into canceling his speeches at the last minute (but the show always went on bigger and better somewhere else.
Monckton was escorted right out of Doha after speaking the bleeding obvious from the floor, he leapt from a plane in Durban, and he convinced the prof who wanted to execute skeptics to withdraw it with an apology.
GetUp are so afraid Australians might hear more of Monckton and people like him, they panicked and ran a whole ad campaign packed with conspiracy theories at the mere hint that libertarians might like to set up a Fox news equivalent in Australia. The travesty!”
Imagine, 50 academics trying to prevent him from speaking. That is war Lucia – please allow Anthony his occasional peashooter.
lucia, my point is that the boundary between red and blue on my graph changes over time and on the boundary one grid square quite often has the opposite trend from an adjoining grid square.
Yes there is correlation, but there is also negative correlations along the border between the warming arctic and cooling west and between the warming east and the cooling west.
Just because square 1 and 2 are both blue in say .. September, doesn’t mean they will be both blue in October.
Try this animated gif of how uncorrelated most of the time trends on the west coast are:
https://sunshinehours.files.wordpress.com/2012/03/westcoast-usa-canada.gif
from:
http://sunshinehours.wordpress.com/2012/03/22/westcoast-cooling-overlayed-on-google-maps/
Bob–
Disarm him? No one suggested we should cut off his arms!
Also: No one said he should stop blogging, speaking, organizing weather station projects, writing papers, defunded, jailed, lashed with a wet noodle. But I do think it’s regretable he alluded to jail time.
enter
Our libel laws may be different from those in Bangalore. NDCD is a US government entity and it can’t sue for libel in the US, period. Someone could falsely allege that NCDC employs axe-murdering sheep-lovers and NCDC wouldn’t be allowed to sue.
Reply to Steven Mosher (Comment #108786)
Frank wrote: We know there are some stations whose trend is biased by a large UHI. Until one finds them, we could be looking in the “wrong placeâ€; which is the best place to look when you don’t want to find something.)
Steve wrote: Do we really know this?
Frank replies: I think so, but I’m interested in why you (with your experience) might believe my assumption is incorrect. Here are some reasons why one could assume that the TREND at some stations is biased by UHI:
The introductory paragraphs of the BEST paper on UHI (http://berkeleyearth.org/pdf/uhi-revised-june-26.pdf) make a case for why UHI might bias temperature trends. Tokyo is cited as a station whose trend is believed to be biased by UHI. If all of the “Tokyos” in the world have been eliminated from BEST’s collection of very rural stations, then BEST has produced a definitive answer – but how to they prove that they have done so? Has anyone looked at the “rural” stations with the largest trends and tried to demonstrate that few, if any, are logical candidates to have been biased by UHI? (Anecdotes – certainly not the best evidence – suggest that it is pretty easy to find good candidates for UHI bias by looking at stations with the highest trends. However, first eliminate stations at high latitudes whose trends may have been inflated by polar amplification and changing sea ice.)
You know from your work what features tend to be associated UHI. Don’t you think the density of those features around stations has probably increased with time – over long time periods? I can see discounting the role UHI may have played during the rapid warming of the US in the late 20th century – it was already fairly urban by mid-century. However, BEST covers 1850-2010, a period that has seen dramatic land use changes in the vicinity of many stations. Unfortunately, by creating separate records at breakpoints, the Trend analysis in Table 1 is based on records of >30 years in length.
BEST demonstrates that UHI is unimportant by comparing “very rural” to “all” stations. Are there other differences/biases between “very rural stations” and “all” stations? Higher latitude? Further from the oceans? I’d prefer to see how the “very urban” stations, which are the most likely to contain UHI, compare with “all”.
phi (Comment #108787) January 24th, 2013 at 3:41 pm
Frank wrote: “It is totally absurd to discuss the US trend without removing TOB.â€
Phi wrote: US TObs corrections are quite singular (see eg Menne 2009, fig. 3). They are so unlikely (statistically speaking) that it is not absurd to regard them with some suspicion.
Frank responds: Get your hands on some real hourly temperature data and see how much the time of observation changes calculated Tmax and Tmin. Then read Karl’s paper: http://journals.ametsoc.org/doi/pdf/10.1175/1520-0450%281986%29025%3C0145%3AAMTETT%3E2.0.CO%3B2
Fine Lucia, I stand corrected on the suing part. Let them come out with their own howls of dismay. Did they appoint Zeke as their mouthpiece?
And if Zeke feels so strongly about Anthony’s comment about NCDC and invokes the spirit of civility with a long blog post chastising Anthony, let Zeke explain his deafening silence about UCS’ comment in the same article highlighted by Don Montfort in this thread [ #108741 ]. Or about his complete lack of any howls of outrage till date on the pro-AGW crowd’s language against the skeptics. Not a peep from him till date on any such issues.
So it’s got nothing to do with the spirit of civility or fairness. Zeke’s outraged that Anthony challenged his pet area of surface temperatures, that’s it. He took that as a personal afront. And he made it a pseudo outrage about Anthony’s language and semantics. An act of hypocrisy.
Zeke (if I may)
I am a regular reader of Anthony’s site and have very little (no) technical background, so a lot of what I read goes over my head. I have not even finished reading the comments to the thread that you were involved in, but I would like to commend you for jumping right in and participating. I find myself on the skeptical side of the argument (sorry), and I’m sure that hundreds of the posters over there wanted to try to give you a bit of a kicking, but I salute you for haveing the “testicular fortitude” to have at it.
Tom Riordan.
It is my first post and if it doesn’t make it, just pass along my kudos to Zeke.
Thanks.
Venter– I know the post does start by chastising Anthony for the “jail” issue but the length of the post isn’t mostly “about” Anthony. But I think if you read the post you’ll see that most of it is about the thermometer record and differences arising from various analytical choices.
As for your suggestion that it is hypocrisy for Zeke to limit his posts to discussions of areas which he has been studying and refraining from posting on things he hasn’t looked into: that suggestion is absolute nonesense. It is not remotely hypocritical for Zeke to decide to discuss a subjects he thinks he has looked into and knows something about and say nothing about those which he has not looked into in detail and so thinks he knows less about.
Bruce
All that means is the positive correlation is not exactly equal to 1. But no one claimed it was. Anyway, if you really want compute correlation, it would be better to compute the spatial correlation based on the definition instead of using an animated gif technique which will tend to mask all but the most blindingly obvious strong spatial correlations.
It’s true your first static graph shows the correlation exists and is strong– but that’s because the correlation is so freaking strong it would be difficult to find a technique to make it invisible!
lucia:”NCDC employs axe-murdering sheep-lovers and NCDC wouldn’t be allowed to sue.”
We had no idea it was that bad over there, lucia. But what they do in their spare time doesn’t concern us. It’s the data manipulation that they do while we are paying them that pisses us off:)
Lucia you say
” As for your suggestion that it is hypocrisy for Zeke to limit his posts to discussions of areas which he has been studying and refraining from posting on things he hasn’t looked into: that suggestion is absolute nonesense. It is not remotely hypocritical for Zeke to decide to discuss a subjects he thinks he has looked into and knows something about and say nothing about those which he has not looked into in detail and so thinks he knows less about.”
Let me be very specific. I’m referring to Anthony being chastised by Zeke. It is hypocritical of Zeke to chastise Anthony for his comment upon NOAA/NCDC specifically and ignoring the insult hurled at skeptics by Union of Concerned Scientists in the very same article.
Do you mean to say he looked into only Anthony’s quote with specific tunnel vision and did not look at any other quote in that FOX article?
It is also hypocritical of Zeke to chastise Anthony’s quote referring it to a cancer on blogging and civility when he never said any such thing about ” Team ” blogsites like Real Climate, Tamino, Skeptical Science, etc. and a multitude of such pro-AGW sites at any time.
So don’t tell me that those blogs are also not ” subjects he has not looked into “.
Frank.
The number of stations that have tokyo type characteristics is tiny.
I’ll run the numbers again but I around 40% of the stations had no urban influence, and near zero population.
I think in the UHI study zeke and I did, I constrained the definition of rural even more tightly and we did manage to see a small effect.
The magnitude of UHI is grossly overestimated in the literature because the literature is biased toward recording UHImax.
Lets take a simple example. Oke’s famous UHI = log of population.
right? wrong. Its UHI max that he was working on. Later he would drop this whole idea and the whole notion that there was a simple rural/urban distinction. see local climate zones.
The other thing folks should note is that urban areas can be cooler than rural areas. The effect depends upon the specific area you pick in the city and the area you pick in the rural surroundings.
@BS
A better term than “the proper way” would be “the scientific way”. It is an inherent part of the incredibly successful scientific method that has been developed over many years. Sites like WUWT trash science.
Dear Kenneth Fritsch, Strucchange is not appropriate for climate applications. In strucchange the null hypothesis is that the linear trend stays the same. That is a typical assumption in absolute homogenization. Funny in respect to the discussion about the pure business world that have to abid by the law versus the bad scientist is that absolute homogenization is used in the analysis of financial data. Also in financial data you have inhomogeneities, for example because the way the inflation or unemployment is computed has changed.
http://cran.r-project.org/web/packages/strucchange/vignettes/strucchange-intro.pdf
In relative homogenization as typically used climate studies the null hypothesis for a difference time series is that the normal noise has a constant level.
The homogenization packages HOMER and PRODIGE are coded in R, so they may be easy for you to use instead. See:
http://www.homogenisation.org/v_02_15/
“the proper way to respond is to create your own approach and demonstrate that it is superior.â€
This is the most successful way. If you want to change the way people work, it helps if you can show them a better alternative otherwise they may ignore you.
For an important topic such as AGW, it is more than sufficient to show that the theory is wrong. But you do need solid proof, the misinformation campaign seen on WUWT will not do to change science. Every single post at WUWT on a topic where I am knowledgeable had serious factual mistakes or important missing information that the reader would need to put the post into perspective.
Victor Venema (Comment #108851) , you say, ” Every single post at WUWT on a topic where I am knowledgeable had serious factual mistakes or important missing information that the reader would need to put the post into perspective.”
Well, Victor, you have spoken from on high. Guess I will never visit WUWT again. Do you have any clue how arrogant you sound. Get a grip man.
Lucia, you say ” Bob–
Anthony throws a spitball and you and Zeke cry foul and seek to disarm him. Sound silly to you?
Disarm him? No one suggested we should cut off his arms! ”
I can’t believe you wasted keystrokes thinking I meant that literally.
Also, Lucia, you say, ” Lucia, you say, †Fox happens to be the one he was talking to so I named it.”
With due respect Lucia, that is not true. You said, especially Fox. Do you care to correct your statement?
Steven Mosher,
“The magnitude of UHI is grossly overestimated in the literature because the literature is biased toward recording UHImax.”
The only way to make it clear in my opinion is to use proxies. Several different types of proxies well intercorrelated at high frequencies.
If these proxies have comparable secular trends, then any divergence with regional temperature curves can be considered as an evaluation of the UHI effect.
@BS
It doesn’t say that at all. In science, you have to provide evidence for your claim when you publish a paper. No evidence, no paper. It’s not ‘any answer’. Science is not also about having the final answer, science is a progression. What we have is the best answer we can get at the present.
Bob, I am sorry, but do not see the arrogance, unfortunately it does not require much effort to see the factual errors on WUWT. On a topic where I am knowledgeable, such as the quality of surface stations, noting the misinformation does not take much skill.
Do you know how arrogant is sounds if a climate “sceptic” thinks to know everything better? From the quality of surface, ocean, radiosonde and satellite data, to paleo-climatology, to its processing, to the physics of the climate, to climate modeling and every physical process in it, to radiative transfer modeling, clouds, exchange processes, solar physics, atmospheric chemistry, to every type of impact study whether hydrological, ecological or public health, to mitigation studies and their costs, to economics and technological development. Climate “sceptics” would work a lot less arrogant and would be more believable if every “sceptic” would take up one of these topics and not several or all.
And on every of these topics a true climate “sceptic” is so sure he is right and that the experts are wrong, that they cry fraud and now even “jail time”. Now that is arrogant.
Don Montfort,
Spare time? Spare time? You know that in their spare time, they volunteer for the IPCC.
bugs,
You are making nonsensical claims that in part rely on an either/or fallacy. There is no one “scientific way”. There are tons of “scientific ways” to respond to papers one thinks is poor.
These range from ignoring it, commenting that you think the methods are weak and coming up with a whole new method. No one is forbidden from doing either of the first two and they aren’t seen as “not scientific”. If they were, everyone would have to constantly instantly drop their own work to spend time ‘rebutting’ papers they consider nonesense or sub-par. In reality, many people simply ignore a paper (many are never cited and so forth) or just discuss it among themselves saying they think the methods are weak. Someone might eventually write a paper with improved methods. But in the meantime, everyone can comment on previous ones; those comments can be negative and that behavior is perfectly “scientific”.
Oddly enough, the “saying you think the methods subpar” has great prominence in science. It’s a method used by peer reviewers during a peer review. They are not required to write a whole paper showing better methods when rejecting a paper.
Victor Venema
Sure. I know how anyone who does this sounds. He sounds like Gavin. 😉
Lucie, I am also often wondering why such scientists do not simply answer the press: sorry that is not my topic, ask someone knowledgeable about this.
But I do feel there is a slight asymmetry. You expect Gavin to understand the details of climate modeling, but you do not expect him to know the details of every other aspect of climate science. If he talks about these parts, you expect that he speaks as a representative of science and explains the mainstream view.
If you hold a fringe opinion, I feel it is not unreasonable to expect that you have a reason for that and know the details. If you hold a fringe opinion about almost every aspect of climate change, you must be a super-Gavin.
Victor:
You’d expect that, but he doesn’t limit himself to that.
Thinking specifically of what he writes on his blog, so this is with time to prepare not off-the-cuff remarks, I’m guessing Lucia was alluding to the fact that Gavin is known to give knuckle-headed explanations, and to do so with a bit of shall we a share of alacrity. That just comes off looking silly of the “and that’s why we know the Earth is shaped like a banana” variety.
Not sure this thread should turn into “our favorite Gavin stories”, otherwise I’d say more.
Victor–
I’m sure many do. After which, they aren’t quoted. Space constraints being what they are, the reporter doesn’t tack on a list of person he spoke to while researching the story.
In other words: You think it’s ok for Gavin to discuss all aspects of science even those he doesn’t work on specifically, but you think it’s not ok for Anthony to do so. But it seems to me that your real objection is you don’t like the specific positions Anthony takes but you do like the positions Gavin takes. But it that’s the case, you should simply criticize the specific position Anthony takes rather than trying to explain that Gavin is permitted to talk and blog on every conceivable topic and Anthony is not.
If it is so easy to show how “every” topic on WUWT in your area of study is factually wrong and clearly misinformation why don’t you and other experts in what ever area you are an expert in and you are willing to judge simply demonstrate and rebut his clear violations of truth?
I will be the first to admit not everything on WUWT is perfect but they also typically caveat things pretty well and they also often say they do not know the correct answer but something about this looks “off”.
If in fact its so easy to spot teh factual errors in WUWT you could have a very successful blog of your own simply re-posting the topics of WUWT with accurate information. Granted you would need to be honest and not make up stuff and argue points that were never made like SKS. I look forward to reading your factual blog and learning something please post a link when you start it. Other wise your claims are just internet claims of expertise and trolling about the other side being riddled with lies.
My degrees are BS environmental geology with a minor in meteorology and a Masters in petroleum engineering. I spent most of my undergrad focused on global warming and remained unconvinced in the severity of Anthropogenic contributions to the warming trend or the inevitable collapse of life as we know it. The only imminent collapse I see is the economic collapse of debt ridden west as entitlements and interest payments overtake all governemt income.
lucia: ” it would be better to compute the spatial correlation based on the definition instead of using an animated gif technique which will tend to mask all but the most blindingly obvious strong spatial correlations.”
The animated gif used ALL the stations in the BEST data for the grid squares I was looking at.
The data is the trend. from year x to 2011 and I started x at 1975 and went to 2006.
Many, many side by side stations have opposite trends until right near the end.
Victor Venema (#108856),
It is clear that some climate skeptics make nonsensical claims that are easily refuted (radiative physics is wrong, the atmospheric lapse rate causes surface warming, etc.). Much of that is so silly as to be mainly humorous; it is easy to point out those things are mistaken. What is not so easy is to dismiss are more thoughtful observations made by many who fall in the “lukewarmer” category. If you read over some of the past technical posts at this blog (Lucia’s regular statistical comparison of model projections with actual temperatures is but one example) you will see nothing so simple to dismiss. There really are good reasons to think climate models are not presently able to make accurate projections of temperature change over time. There really are good reasons to think that many frightening projections made by climate scientists (1 to 2 meter sea level increases by the year 2100, warming of 5+C in 100 years, vast land areas becoming uninhabitable within 100 years, etc.) are so plainly wrong that they are laughable. Lots of experienced and technically competent people believe it would be crazy to base major public policy choices on demonstrably incorrect models and very dubious projections of the consequences of warming.
.
Will rising GHG concentrations cause future warming? Of course. And that is not disputed by most technically trained people who have looked at the subject. But global warming is a bit like poison: it is the amount you are exposed to that you have to worry about. The need for public action, both in scope and urgency, depends very much on the true magnitude of future warming. A reasoned discussion on suitable public action should be based on realistic projections… but it seems pretty clear to me that current model projections are not realistic.
.
While Anthony Watts was clearly wrong to suggest that scientists responsible for adjusting historical temperature data are dishonest, you would do well to remember that many people who do not support immediate and draconian public action to reduce CO2 emissions act honestly and in good faith. One does not have to look very far to find many worse accusations routinely made against anyone who opposes draconian public action to reduce CO2 emissions. If you are very concerned about future warming, and I suspect that you are, then you can facilitate a reasoned public discussion about policy if you don’t just criticize people like Anthony: also publicly criticize those who routinely say all opposed to draconian public action on CO2 emissions are, as Zeke noted, “lying, stupid, or in the pay of someone nefarious.”
I’m really enjoying this discussion. Kudos for Zeke for plunging into it. My two cents worth – as an outsider who knows some math, but not enough: Anthony, this kind of thing is a big mistake. You may make the partisans happy, but you lose people like me. And the partisans will support you anyhow. People like me, we don’t know much about the science, can’t follow all the technical discussion, but we can tell people who are trying to do science from people who are trying to win a war. Steve McIntyre was an important revelation to me: there are people on the skeptic side seriously interested in getting the details of the science right, and not very interested in fighting. Judith Curry, Hans von Storch. Lucia and Zeke, and Steve Mosher, though he gets pretty snarky sometimes. Even Roy Spencer, who very clearly has a side, but still, his website is focused on explaining his point of view. That’s fine with me. As Judith Curry said, the other side makes a big mistake when they don’t acknowledge that the really important and effective skeptics are a few amateurs working seriously in their spare time.
A very big mistake, where people like me are involved. When I see someone on either side involved in sneering and snarking, in impugning the other side’s integrity, calling fraud, claiming the other side is driven by Big Money – well, I cross them off the list. And my list isn’t that long any more. There are zillions of partisans on both side, and I pay zero attention to what they say. Anthony, you have had some very interesting input about UHIs and other things. Don’t get yourself crossed off the list; stick to the science.
PS – don’t sue that clown either, the one who said stupid stuff about you on his blog. I’ll cross you off my list. Why would you get involved? One glance at his blog, and I know he would never get on my list to begin with. Stick to the science.
Bruce–
The idea I am trying to get across is it doesn’t matter which data you use to create your animated gifs. The “method of animated gifs” is a suboptimal way to determine the magnitude of the spatial correlation. It is better to (a) look up the definition of spatial corraletion and (b) compute the spatial correlation function. You would use the same data. Then compute:
(a) the magnitude of E[T'(x,t)T'(x+dx,t)] = ET’T’(dx,x,t) where
T'(x,t) is the anomaly of of temperature at point x, and time t. (So you need to find the mean at (x and t) first– you would do that by finding the climate normals for that point.)
and E[ Y ] is the “expected value of Y”. You estimate it by computimg the sample mean of whatever “Y” inside the E[] is.
Then after you find your estimate for ET’T’(x,dx, t) for each dx, integrate over all ‘x’ and all ‘t’. ET’T’(dx) which is a function of dx only. Normalize that by ET’T’(0) to get the spatial autocorrelation R(dx), which has a value of 1 at dx=0 and should decay as the absolutely value of dx increases. (It should be symmetric in dx. )
Now plot R(dx). It’s a very plain looking graph. Not sexy like the animated gifs. But this ordinary looking graph is the one that actually reveals whether spatial autocorrelation exists. If it does not exist, R(dx)=1 at dx=0, but drops to 0 when dx≠0. If it does exist, R(dx) will remain positive for a region of dx≠0. (It’s possible for R(dx) to go negative too.)
It happens that in the case of your first graph, the fact that R(dx) ≠0 when dx≠0 is blindingly obvious. But that doesn’t mean gifs are the most effective way to detect the autocorrelation.
Carrick,
Which is one of the reasons why I consider RealClimate as a primarily an advocacy blog, not a blog about science. Advocacy also explains the constant efforts to “debunk” almost any published analysis which does not fully support the main-stream climate science POV of a) high climate sensitivity and b) horrible consequences of future warming. Knuckle-headed explanations are OK for these purposes.
Lucie, what gave you this idea about my real objection?
Ben, could you simply google for my name on WUWT. The first comment is typically the one that explains the factual problems.
Actually, the most read post on my blog is about the errors in the infamous manuscript Watts et al. 2012. But I am mainly blogging to clear my thoughts and to communicate with colleagues.
A “beautiful” example of selectively citing from articles.
An example of not being able to distinguish power point slides from a peer-reviewed article.
SkS has a bias, but I have not yet seen any obvious factual errors.
I am also not sure that life as we know it will inevitable collapse. 🙂
‘a difference time series is that the normal noise has a constant level.
The homogenization packages HOMER and PRODIGE are coded in R, so they may be easy for you to use instead. See:
#############
Thanks Victor.
Victor, I don’t see any benefit continuing this discussion. Sorry, but you seem to be so deep in the CO2 tank you are giddy from the anoxia.
“Fine Lucia, I stand corrected on the suing part. Let them come out with their own howls of dismay. Did they appoint Zeke as their mouthpiece?”
Zeke is concerned because he sees first hand what these types of charges do. He works with the scientists at NOAA. No, let me be clearer. He works a 9-5 job. Then he volunteers his time to work with the guys at NOAA ( as have I ). He volunteers his time for love of this topic. He volunteers his time sharing his work with the rest of you ( and for few thanks I might add ). When Anthony drops the fraud bomb it has real consequences inside of NOAA. I can tell you having done FOIA to NOAA that they are a profession organization. So, those fraud bombs mean that scientists, the guys that zeke work with, are pulled off their science and have to do a bunch of work to justify what they have already published about.
The other day a blogger suggested that Anthony was stupid to post something about life forms in a metorite. God forbid somebody post something negative about Anthony.Lawyers were called. Why, well because it put Anthony in a bad light. Now, the shoe is on the other foot. I objected to the stuff said about Anthony and I object to the stuff he said about people who go out of their way to work with the public. People need to quit justifying it. You sound like the bozos who tried to justify climategate. Wrong is wrong. Apologize and get on with it.
phi:
‘The only way to make it clear in my opinion is to use proxies. Several different types of proxies well intercorrelated at high frequencies.
If these proxies have comparable secular trends, then any divergence with regional temperature curves can be considered as an evaluation of the UHI effect”
ha. sounds like the attribution argugument for C02. Most skeptics never see that their argument for UHI is an exact parallel for the attribution argument for C02.
So, yes tokyo has warmed more than its rural neighbors. But in other cases, rural warms more than urban. ( kinda like the arctic ice versus antartic ice ) therefore, UHI cannot cause warming.
Or, cities are warming no more than usual. Look at the paleo record, places warmed with no cities. therefore urbanization doesnt cause warming. Its natural variation.
Funny, when you abstract arguments and find the similarity in form that you will find the same person accepting an argument on one matter ( it could be something other than C02 ) and rejecting that same argument on another topic ( it could be something other than UHI ).
of course I thnk UHI has an effect as does C02. The question is how much. My point is that most people who look at UHI come with a bias that UHI is large. That bias is produced by skimming a bunch of articles that focus on UHI max. 9C 5C 3C blah blah blah
on average its much lower and the actual magnitude depends on the exact spot in the city you are measuring and the exact spot in the rural enviroment. Give me a rural site in bare land or closed shrubland and a green area in the city.. well, you’ll scratch your head until you realize that “urban” is ill defined and “rural” is ill defined.
SteveF, WUWT regularly writes about the quality of climate data, that is where I am knowledgeable and thus where I prefer to comment. I do have The Blackboard on my reading list, but have no special expertise in global climate modeling. When I refer to climate “sceptics”, I am mainly thinking of Anthony Watts and most of his angry mob. Or in Germany EIKE. Or in The Netherlands ClimateGate.nl. I am not referring to Lucie and I am not referring to scientists making interesting contributions such as the recent interesting McNider et al. and Solomon et al. papers.
I fully agree. And there are even more reasons to hold climate change impact studies to be unreliable. To quantify most impacts you need projections that are accurate on very small temporal and spatial scales. I do not think that our models are that accurate, even with statistical or dynamical downscaling.
Personally, I see this as a good argument for mitigation over adaptation (or facing the consequences). It is difficult and even more costly to adapt if you do not know what will happen where. What estranges me is that “sceptics” seem to assume that uncertainty means that nothing will happen or at least that the best possible scenario will come true.
Yes, these things will likely not happen. I would not call them laughable, they have a low probability, similar to the low probability that almost nothing will happen.
It would be nice to be able to have a civil discussion with these people about uncertainties and the most likely costs of various scenarios without being distracted by the WUWT noise and misinformation.
Why do you think I am? I am commenting here as a professional and I try to comment mainly on misinformation and on the quality of the surface network.
But yes, as a private person I am concerned about climate change and am apparently much less concerned about the effects of reducing CO2 emissions, especially if we start early and can thus avoid draconian action. As I am not knowledgeable here, it would be better is some else would facilitate such a public discussion.
Lucia, I think neighboring stations can have similar temperatures until you get to stations where there is a climactic boundary like there is in Canada now between East and West and North and South.
But the boundarys move.
Steven Mosher (Comment #108871)
You’ve got to be kidding. You know better than most that this is not a science debate. It is a debate about the economic future of the world using so called science to justify policy prescriptions. And stop the whining, you volunteered your time from your free will – do you have anything to gain Steve, or are your efforts some grand magnanimous gesture? You and your team have the full force of the institutions of most of the world’s governments and you get all huffy when shoots back with a peashooter. This battle will be waged on the terms that are necessary to protect the unalienable rights of all those that cherish true freedom. You went from a lukewarm 110 F to supernova temps and yet you pine for civility, especially since you are well aware of the tactics of your fellow warmers. Stop coaxing an apology from Anthony and continue to try to justify your own position.
Victor Venema (Comment #108850)
I will certainly look at those R packages you recommend, but I do not think you have explained why I would expect a different answer using them in the example that I presented to you. It is rather a straight forward issue. I also do not follow what you claim about using absolute and difference series. I use difference series and that is not an issue.
You would appear not to be totally forthcoming on the limitations of breakpoint methods finding non climate changes in temperature series. Most individuals applying them are very much aware of these limitations.
Zeke
Re: ” . . .people go to jail for such manipulations of data.
I’m sorry, but accusing people that you disagree with of fraud,”
Both incompetence and fraud can appear self serving.
Both can land one in jail (but not insanity).
However, to infer Anthony claimed fraud over incompetence requires investigation into motives.
On those who made the changes, it would require evidence into people’s previous knowledge, not just evidence of self serving data.
e.g. See: Invoicing Fraud or Incompetence? How to Distinguish Between the Two When Faced with a Questionable Case
So please do not accuse Anthony of claiming fraud, when incompetence could equally fit the evidence and statements.
Anthony has highlighted the potential for homogenization using poor class 3-5 stations to raise the temperatures of good class 1-2 stations.
That could both cause a serious (“systematic”) Type B uncertainty error
AND
it could have been incompetence and unintended.
Contrast the legal profession and tenured faculty or civil servants.
By contrast, tenured faculty or civil servants have little financial incentive over incompetence.
It is remarkable that most of the “adjustments” have the impact of making the temperature trend hotter.
AND
Most adjustments are made by those warning of anthropogenic global warming.
Some adjustments have caused rather dramatic “warming.”
e.g. Darwin Zero
That could be incompetence.
It could be fraud.
(It might even be insanity.)
We need to discover all the factors affecting BOTH Type A and Type B uncertainty errors.
Distinguishing between incompetence and fraud will be much more difficult and require investigating Who/Why/When the changes were made and what evidence of intentionality or not.
Bruce–
You are discussing features that are practically irrelevant to the determination of “spatial correlation of temperature anomalies”. That said: If you bothered to calculate the correlation coefficient first, afterwards you could test to see whether the magnitude is invariant to position ‘x’ in or time ‘t’. But the stuff you are showing is not particularly useful to determining whether the spatial correlation is high at short separations, whether it is isotropic (i.e. the same in the North-South axis as the East-West) and do some other tests. But the stuff you are showing is not a test of any sort.
I strongly suspect you are going to continue telling me something about what you can see in your gif, or how you calculated them or so on. But those gifs don’t tell us much about spatial correlation. You need to do the proper type of analysis.
lucia:
Thank you. I didn’t think there was anything controversial about what I said. Zeke said something that was silly and wrong. It didn’t really affect his post, and he has since indicated (or at least suggested) he hadn’t meant to say what he said. No big deal.
Or rather, it shouldn’t be a big deal. The responses I’ve gotten when pointing it out seem to suggest it might be one. I have no idea why, but a number of people take issue with it.
Steven Mosher,
“ha. sounds like the attribution argugument for C02.”
It is not so much a question of attribution but of representativeness of stations temperatures. If a divergence arise under the conditions I described, then there is a problem. The attribution to UHI is secondary.
“The question is how much.”
“well, you’ll scratch your head until you realize that “urban†is ill defined and “rural†is ill defined.”
The advantage of a comparison with proxies is precisely to obtain a quantitative evaluation without being hindered by a problem of definition. We focuses on representativity and the question of attribution can be treated in a second time.
Zeke, now could you explain how GISS warmer the 90s and 00s by a few points while cooling the 20s and 30s?
New numbers vs old numbers
2008 23 31 69 48 46 42 55 41 56 60 62 51
2008 17 26 66 44 41 35 54 37 53 56 58 49
2009 56 48 49 56 58 61 66 61 65 59 70 57
2009 55 46 48 49 54 62 67 56 66 60 66 60
2010 66 74 86 81 70 59 57 59 55 64 75 45
2010 69 75 85 77 66 57 51 55 54 63 72 45
2011 46 44 58 60 47 53 69 69 53 59 50 45
2011 46 44 57 56 43 51 66 66 50 55 47 43
2012 36 39 49 60 70 59 51 57 66 70 68 44
2012 32 37 45 55 67 56 46 58 61 69*****
Kenneth Fritsch:
Let’s try to explain it clearer. If you have only one time series, as you have in finance or genetics and sometimes also in climatology for very old data or data from developing countries, you can only use absolute homogenization. In this case, you have to decide rather arbitrarily, which part of the variability is real and which part is artificial. A doubling of gross national product or a temperature jump of 5 degrees in one year are likely artificial. But smaller jumps or more gradual changes could be real economic growth or climate variability and should thus not be removed.
Thus in absolute homogenization, you typically want to keep a gradual variability and trends, because you do not want to remove true economic growth and climate change. Therefore, the structural change algorithm your used written in R, has as null hypothesis that the time series has a linear trend. You as an expert will have to decide over which period this is a reasonable assumption for your data. In general trends will be nonlinear, in case of climate due to natural climate variability.
In relative homogenization, you use a difference time series, the difference of a candidate station (the one you want to homogenize) and its neighbours as reference stations. By computing this difference time series, you remove the complicated nonlinear climate signal. What is left after removing the regional climate signal should be just weather noise, random differences because high, lows, showers, etc. did not affect both stations equally. Thus in case of relative homogenization, your null-hypothesis is that the (difference) time series is flat noise, typically white normally distributed noise. (This null-hypothesis you could not use in absolute homogenization.)
If one of your stations contains an (additional) trend due to urbanization, even if this trend is visible during the entire period, its difference time series will show a trend. This does not fit with the null-hypothesis of a constant level and white noise. Thus the homogenization algorithm would remove this trend.
Didn’t I write above that homogenization algorithm are limited? They will not find all inhomogeneities. Small inhomogeneities will remain; what is small depends on the correlations of the candidate with its neighbours. Thus will I do claim that homogenization improves the data and does not create artificial trends as claimed by the “sceptics”, some of the trend bias from the raw data will remain in the homogenized data.
I thought this thread might be the best forum for comments on comparing the GHCN and BEST temperature adjusting methods. The advantages of attempting to produce an independently constructed temperature data set such as exampled by the BEST effort has already been shown in that it has highlighted the use of a benchmarking performance test, and against the differently constructed GHCN data set. It further showed that the results can produce rather immediate modifications to methods and with improved results. I do have a question about that addressed to Zeke: Have the changes made to improve the BEST performance as you noted in another thread been applied to the most recent version of BEST or is a revision planned for the near future?
To this layperson, the BEST use of kriging and scalpelling would at first glance appear to be legitimate providing the assumptions on which these methods are based hold for the data being manipulated. When and if I have the time, it is testing those assumptions where I would start my analyses.
When comparing algorithms used by GHCN and BEST for purposes of cross validation it is important to understand how independent the methods actually are in application. If I have correctly interpreted the results of the performance evaluation test the differences in the results were attributed primarily to a difference in how GHCN and BEST apply the breakpoint methods and not to scapelling or kriging. That leads directly to the question of how different would the GHCN/BEST benchmark performance results and global and regional temperature series be if all the peripheral differences surrounding the scalpelling and kriging methods were accounted for. I think that future and improved performance tests and comparison of the resulting temperature series from performance test initiated changes to the methodology of both GHCN and BEST will provide the best opportunity to test how much difference/improvement scalpelling and kriging actually provide. The fact that recent developments in both of these data sets show that something to do with climate science as basic as adjusting temperatures is a work in progress can belie some of the consensus complacency.
Below I will attempt to outline a comparison of the BEST and GHCN adjustment methods in hopes that any of my misinterpretations will be pointed out and corrected.
Both BEST and GHCN attempt to find the “weak links” in those parts of station series that are providing less than a “best” estimate of temperature at that location and replacing it directly or indirectly by a better estimate. Both use breakpoints algorithms and documented station changes to find the weak links by using difference series with neighboring stations. GHCN makes the adjustments directly in replacing the weak links with the best estimate by using the nearest neighbor data. BEST uses a weighting system as an alternative the GHCN direct replacement and that weighting system, in my understanding, uses the kriging method as would typically be applied and additionally by a weight arising from the observed station series result versus that derived from kriging. Both of these weighting processes are merged into one modified kriging process that is applied to all the scalpelled series segments. It is also my understanding that the scalpelled segments contain all of the existing temperature series data in the entire data set and that the all these segments are weighted regardless of any estimated quality of that segment. The weighted segments are then used to determine mean temperatures for regional and global areas. I am not at all sure whether you can extract individual station data from this process in the same form as would result from the GHCN methods.
One can see where the results of the both the GHCN and BEST methods might converge under a given set of circumstances. One might even be able to construct toy models to show this, but determining how independent the methods are when applied to a real and extensive set of data is probably better determined with the tests as I noted above.
Victor Venema (Comment #108873),
Because you work in climate science, and most who work in climate science are concerned. (Which is cause and which is effect is a different discussion, and possibly a very interesting one.)
.
What? I don’t follow you. If you are not knowledgeable, then upon what do you base your opinions?
.
As for “starting early”, I also don’t follow you. The trajectory of CO2 emissions growth in China, India, and other developing countries is not going to suddenly reverse; all those coal fired generating plants that are currently being constructed are not going to suddenly be closed. If those plants (plus European, North American, Japanese, etc.) are going to close, then it will take a very, very long time, and the power they produce will have to be replaced. Lots more power is needed for the ~2 billion poor who currently have no electricity, if those people are ever going to live reasonably well.
.
Now, I don’t know you at all, but let me make a few other guesses: I suspect you are strongly opposed to nuclear power generation, support the German government’s decision to close all nuclear plants, oppose the development and use of genetically modified crops and animals, and would like large tracts of developed land to be “returned to their natural state”. Why do I guess those things? Because you work in climate science. Please tell me if I am mistaken.
Victor Venema:
I clicked on your link out of curiosity, and the first thing I saw was your figure. I read its caption, pulled up the Watts figures and looked for Figure 17. I couldn’t find what you showed. After a minute, I realized you were showing Figure 16 not Figure 17. Amused, I decided to read the whole post. I quickly saw:
For someone accusing others of factual errors and distortions, this is a remarkable comment. First off, the press release said:
If well-sited stations are adjusted to warm faster, the slower warming Watts found must be in the raw data. This means your criticism is that Watts didn’t explicitly say something he made abundantly clear. What you portray as a distortion is actually nothing more than expecting people to understand simple sentences. You then create a distortion of your own:
Claiming this is “what he found” grossly distorts the paper’s findings. Not only is your depiction of that finding inaccurate to the point of deception, it overlooks several other finding Watts explicitly referred to in his press release.
But you’re so much better than Watts. After all, you say:
This is a fascinating argument. Watts suggested mean temperatures are higher than they should be because well-sited stations were warmed when poorly-sited stations should have been cooled. You respond by saying there’s no problem because after adjustments the data matches. A major point of the paper was that stations are forced to match at an incorrect value, and your “rebuttal” is that the stations wind up matching…
If the “factual errors” that are so easy for you to find are of a similar nature to the “errors” you pointed out in that paper, that says a lot more about you than WUWT.
Zeke,
You make use of the good correlation UAH-homogenized USHCN to support the adjustments. This is, in my opinion, not a good idea because then you must explain why the divergence is significant at the global level:
http://img215.imageshack.us/img215/5149/plusuah.png
(It is your own chart that I completed with UAH)
Adjustments are correct in the U.S. but completely wrong on the overall plan?
You must choose.
SteveF,
Be careful of gross generalizations. I, for example, support nuclear power (assuming its economically viable), think Germany shuttering its nuclear plants and increasing coal is idiotic, generally support GMOs (though not all applications; terminator seeds and round-up ready crops have issues, for example), and think natural gas fracking is one of the best things to ever happen for climate mitigation in the U.S. I also generally consider myself a liberal (though more in the classic European sense) and voted for Obama twice.
But lets not get too distracted on non-science issues :-p
phi,
The global divergence is a large and unresolved issue, though some groups have found greater correspondence by correcting for differing ENSO effects on surface and satellite records (e.g. Foster and Rahmstorf).
There is also the Zho et al paper that finds quite good correspondence between surface and satellite records based on a slightly different approach for dealing with inter-satellite calibrations: http://onlinelibrary.wiley.com/doi/10.1029/2005JD006798/abstract
“Steven Mosher
ha. sounds like the attribution argugument for C02. Most skeptics never see that their argument for UHI is an exact parallel for the attribution argument for C02. ”
That’s a bit unfair. Personally I like very simple models, based on very simple physic’s as a starting point before going on to making more complex models. So starting at the beginning:-
1) Given that we know the historic, asymmetrical, line-shape of surface temperature during the diurnal cycle, what should a photon-recycling gas do to this line-shape?
2) It is trivial to place a group of weather stations in a field with different sorts of human built structures; then see the line-shape of surface temperature during the diurnal cycle.
3) Compare (Tmax plus Tmin)/2 vs. (Tmax minus Tmin) in different UHI environments, during the seasons.
haha. Zeke and I agree on everything but politics. So guess what, we never talk about politics and working together is a joy.
it might come as a shock to folks but there are both liberals and conservatives in berkeley earth. trying to find common ground as opposed to proving that your opponent is :stupid, wrong, evil, biased, niave, hypocritical, or smells of eldeberries…
Brandon–
In defense of Zeke: incontext, I think that the best way for Anthony to criticize a method that has been published, described, include documented code and so on, and which has achieved a sufficient level of acceptance to be disseminated by a government agency is to examine what you get if you fix the method. I don’t say this out of particular respect for government agencies– but merely note that as a practical matter, lots of people are going to hear of the results and method and so the critcisms are best when they correct a widely used method.
But I do still stand by the notion that it’s ok to simply dispute the methods. But if you are going to criticize a method, it is best to state what’s wrong rather specifically and also try to quantify how much difference the methodological ‘issue’ makes. (Sometimes the problem is purely hypothetical.)
Otherwise if you are non-specific and don’t quantify– and quite obviously– people have a right to simply ignore your criticism. In fact, they may be forced to ignore it because it’s too vague to criticize, understand or apply.
And to some extent– at least in the FOX news interview, Anthony doesn’t really provide details– though of course it was a interview— dare I say it on FOX news1— and so the story was likely to be a collection of “soundbites”.
Mind you: To Anthony’s credit he has aired many of his criticism publicly. Some have had some merit. My understanding is NCDC is concerned about improving individual sites and so forth. Others have had little merit– for example the notion that the trends are biased by something that I think was referred to as “the march of the thermometers” (to warmer locations) has little to no merit.
(1 For ‘Bob’: NB [in caveat voice similar t those heard on pharmaceutical commercials]: The mention of FOX, the specific media outlet that carried Anthony’s quote, should not be taken to imply that stories on other cable channels aren’t also collections of soundbites or that FOX is any better or worse than others in this regard. Nor is it to be taken to suggest broadcast stations or “news” shows like FRONTLINE are any less likely to be little more than collections of soundbites.)
Victor Venema (Comment #108882)
Sorry, Victor but you seem to be lecturing me on the issues of which I am already aware and not addressing in details of the example I gave. I did my simualtions by applying a trend for the entire length of the series that was simulated using actual observed difference series data.
Now, if I have a trend in one absolute series and another absolute series without a trend and the series are correlated as neighboring stations will be and further both of the series contain no other breakpoints or added breaks and then I difference these series, I will obtain a difference series that has the noise that I would see in my simualted case above and with an trend in the series over its entire length. Now the question is very simple: can your breakpoint algorithm find a break in this series? Certainly you could determine that the difference series has a trend by other means and over the entire series but I do not see that being detected by a breakpoint function or being able to determine the start and the end of the trend.
But in more realistic cases of breakpoint detection where the breaks are introduced randomly in a series, I point to the benchmarking test that Zeke H. and Menne used to showed that a number of small changes added to a synthetic series can result in homogenizing algorithms failure to estimate the true trends by significant amounts. I have found similar limitations with simulations of my own.
It has been my contention that simulations with added changes should be devised that most severely test the capabilities of these homogenizing algorithms and then analyze the results and determine how realistically those added changes could occur in the real world. I applauded the reporting of Zeke and Menne of “bad” results from their tests.
I do understand your comments on the differences in the null hypotheses you presented. I am curious how your suggested R packages handle that difference. A breakpoint as derived in and under the null hypothesis of the breakpoints function in R will find breakdates with CIs. I am not sure how the alternative hypothesis you suggests would accomplish that determination.
SteveF:
This is a similar point to one I’ve made in the past. The main threat of future global warming comes from future industrialization, not from existing industrialized countries.
You can bomb (literally or figuratively) the existing industrialized countries back to the stone age, but if you let the industrializing nations continue to develop, you’ll get more that 5/6 of the warming that would have occurred without the industrialized nations continuing to exist and produce CO2
Worse than that even (the actual fraction may be greater than 1!), because the industrialized nations have resources to develop alternative energy sources, if you remove their capacity to innovate, expect it to be actually worse than if you hadn’t damaged or destroyed their economics.
My big complaint about “greenies” is they don’t even reason. It’s just assumed that first we restrict CO2 production in industrialized nations, and then a miracle occurs.
Brandon Shollenberger:
Thank you for finding this mistake, has been updated. And it shows the importance of conventions to avoid mistakes. The manuscript put the captions above the figure, not below the figure as is usual.
Brandon Shollenberger:
“Suggested” is a good choice of words. And that suggestion came out of nothing, is not based on his analysis. Such a conclusions would need a study of the homogenization method and the manuscript only studied the differences in the temperatures between the 5 quality classes.
In August Anthony Watts promised an update of his manuscript within two days. It is now almost half a year later.
Zeke,
Are you sorry now that you got all confrontational and made Anthony the personification/poster boy and your sole example for the cancer that you say is growing in the climate blogging world? A cancer that you were not outraged about enough to hyperventilate over, until Anthony’s alleged transgression. Do you think that your diatribe has fostered communication or promoted civility? Aren’t you calling Anthony a cancer on the blogging world? Will you withdraw that cancer crap?
If you sincerely wanted Anthony to withdraw his comment, you could have first contacted him privately and expressed your concerns, man-to-man. He may well have agreed. You know him, right? But you have an axe to grind.
Victor:
Now you’re just being petty.
He should update it when he’s sure the problems are fixed and no sooner.
Zeke,
“Be careful of gross generalizations.”
Yes, everyone should be careful of gross generalizations; people may not really think what you suspect. (And I am happy you like nuclear power! 😉 ) However, I don’t see anything wrong with noting that most basketball players are very tall. Accurate observations are usually informative, even if they may not be well received for one reason or another. We can’t easily stop drawing Bayesian inferences. Nor should we, or we are going to end up believing things like Danial Patrick Moynihan’s (playful) conclusion that US student performance is controlled by distance to the Canadian border. 😮
.
“But lets not get too distracted on non-science issues.”
Fair enough, it’s your post. I’ll drop it.
phi:
I’m not sure there’s any value in putting satellite measurements (nominally at 8km up) on the same curve as temperatures that are on the surface, unless you know how to correct for surface boundary layer effects and for differences in elevations beyond that.
Dear Kenneth Fritsch, I did not want to lecture you, you wrote that you did not understand my short explanation, from which I assumed you were unaware of the difference between absolute and relative homogenization. Which is would have been possible as absolute homogenization is hardly used in climatology.
So your real question is how an homogenization algorithm (not break points algorithm) handles trends. If there is a trend in the difference series, some homogenization algorithms will detect and correct this as a trend. For example the newest version SNHT and the previous version of PHA. You can also correct such a trend by inserting a number of small breaks in the same direction. In the European validation study, we had one algorithm (PRODIGE) that tried both versions and we found no difference between these two version. As far as I know, also the PHA nowadays simply corrects trends again by inserting a number of breaks.
If you like bad results: the homogenization of precipitation data is very difficult and only the best algorithms achieve small improvements in the homogeneity.
Carrick (Comment #108893),
And one of my concerns about climate scientists is that they are very often “greenies”.
(Sorry Zeke, I am just replying to Carrick..)
SteveF:
🙂 Aren’t prejudice fun? And often not completely wrong. You had just one miss, but you also made it a bit easy on yourself: most Germans agree with your 4 thesis.
The average meteorologist or climatologist is surely an outdoor progressive person. I have worked most of my professional life on meteorological questions and have avoided climatology as I was afraid of being biased. This can go both ways, trying to avoid your known bias as much as possible, you may develop a bias in the other direction.
Anyway, I have noticed, that bias is not a serious problem. Science works by dividing problems into smaller and smaller subproblems and when the problem is small enough, there is a clear answer to it. There is not much room for bias there.
The main bias problem is likely in your selection of problems to work on. There “sceptics” somehow assume that every researcher wants to confirm the old results. In reality you make a career by showing that you understood the problem better than the old guard. It would be weird to stop doing that when it comes to the big questions. Especially as this is fun part of the profession. Why would you else become a scientist? I would love to proof that CO2 is not as important as previously thought or more realistically that the temperature record is biased. In fact, I am just trying to see if there is proof for the latter, wish me luck. My handicap over Watts is that I do need solid proof.
lucia,
Zeke has not indicated that he checked with Anthony to get an explanation/clarification of the quote in the Fox article. Do you know if he did so? I would think that you would ask that question, before you allowed Zeke to post this inflammatory accusation against a fellow blogger here. I know Zeke won’t man up and answer, so I am asking you.
Victor Venema,
“Thus will I do claim that homogenization improves the data and does not create artificial trends as claimed by the “scepticsâ€,…”
You will be believed when you will show that homogenization correct as effectively trends than sudden jumps. In the absence of proof, it is likely that adjustments reinforce the artificial warming instead of correcting it.
Zeke,
For the moment, satellite data are rather unfavorable to adjustments.
Carrick,
“… to correct for surface boundary layer effects …”
Possible, but it applies equally to the U.S. as globally. That was the point of my message to Zeke.
Don Monfort,
I gave Anthony a heads-up when I published the article. While he has argued that he didn’t explicitly claim fraud, he hasn’t backed away from his statement that the data was manipulated to show warming, or that it would be jailable behavior in the business or financial world. Whether this statement is tantamount to accusing NCDC of fraud is somewhat subjective, though I believe that it rather clearly is.
.
phi,
Thats why John Christy was looking at max temps over the U.S.; fewer boundary-layer issues.
Victor Venema,
Humm… I have worked in science for a very long time, and I find bias is a very real problem, and one that delays progress, even if reality will ultimately prevail over bias in the long term. But if people stop actively working in the field, incorrect paradigms can continue to be believed indefinitely. The speed at which reality prevails over bias varies quite a lot, but is usually faster in experimental sciences than in observational sciences.
Victor
I and many regulars here have always said we didn’t expect the existing records were heavily biased. Of course better methods can be applied, the record can be extended back in time– and so Zeke and Mosher work on that– as do a number of other bloggers.
Oh… Breaking things into smaller problems doesn’t necessarily reduce bias in larger problems. There is still plenty of space for confirmation bias to creep in. Heck, I suspect there is feedback bias between what is thought in “larger” and “smaller” problems. And like it or not, the time frame for weeding out bias is fairly long.
For example: I don’t think the fact that one might break many problems into smaller ones precludes the possibility of predictions from models being biased relative to what actually happens on earth. No matter how “small” you break up the problem, modelers share ideas, methods, parameterizations. They also share scenarios (this has good and bad points.) And like it or not, if you want to publish, you need to get your model up and running, and when writing papers, it’s easier to only tweak one or two “novel” things about your code and not include every possible different “small” thing all at once.
This means that the entire collection of models are likely to share many ideas on “small” things. In fact, they will often share the most “conventional” ones and wait a long time before sliding in some non-conventional new “small” idea. The end result can be biased.
One of the thing happening now is that no one can speed up or slow down the experiment of watching temperature trends after predictions are made. One can quibble over the correct word, but right now the increase in global surface temperatures has stalled for pretty much a decade. The stall was talked about way back in 2008. I was one of those discussing it.
At which time– let me assure you– people were insisting that it’s just weather noise and the stall would end quite soon. And by soon, I mean people were telling me that the trends might suddenly be higher than the model mean in 2009 or at the latest the next El Nino. As the failure of temperature to increase much at all has persisted, people have been “discovering” reasons why the stall is not inconsistent with predictions of rapid warming and specifically not inconsistent with levels as high or higher than 0.2C/dec over the longer term– specifically over 30 years. But many of these reasons are really grasping at straws and tortured. But they are pretty well embraced.
Well… its not absolutely certain we can’t get 0.2C/dec over the next 30 years. It’s possible: (a) if aerosols matter a lot and the level is and/or will change soon and/or if (b) the sun matters more than ‘we’ think and it finally manages to start pumping out the juice.
But right now, it’s looking fairly improbable. I think it much more likely that the rate of warming will be lower than that.
phi:
Not just possibly…. definitely.
One of the things we get taught in science is to control for confounding variables *before* making the comparison of interesting. This sometimes falls under the rubric of critical thinking, but it’s necessary to prevent us from running down blind alleys.
Victor Venema (Comment #108899)
“If there is a trend in the difference series, some homogenization algorithms will detect and correct this as a trend.”
Just to be clear: The homogenization process will correct for a trend (or series of trends in the same direction and not individually detectable) that runs the entire length of the series and is not detected as a breakpoint and further will evidently correct over the entire series length.
Zeke, Carrick,
Comparison of Tmax is interesting. Unfortunately, the comparison of Tavg gives a similar result for the U.S..
http://tamino.wordpress.com/2012/04/15/roy-spencer-man-of-mystery/
The problem is thus not there.
phi: “You will be believed when you will show that homogenization correct as effectively trends than sudden jumps. In the absence of proof, it is likely that adjustments reinforce the artificial warming instead of correcting it.”
What matters to an automatic homogenization algorithm, such as the PHA, is how much variance is explained by the inhomogeneity. I do find your question interesting, however, because when people homogenize data manually, they often use metadata (information on the station history). And if the metadata confirms a break, they are more likely to implement it as when they cannot find any information.
The problem is that the metadata is more complete for breaks (moves, new instruments are documented) as for trends (urbanization and vegetation growth are often not noticed). Thus this may introduce a small bias in manual results.
lucia: “I and many regulars here have always said we didn’t expect the existing records were heavily biased. Of course better methods can be applied, the record can be extended back in time– and so Zeke and Mosher work on that– as do a number of other bloggers.”
Also some scientist work on that. 🙂 Watts typically claims that half is of the trend is wrong.
Lucia, I was thinking of my own “ideological” bias. I do not think that that influences the articles I write.
It is surely possible that all models are wrong in a similar way and that the spread of a multi-model ensemble does not reproduce the full uncertainty. I think almost any modeller would agree with that. (And again that does not mean that the bias is in the “upward” direction; such a bias can go in both directions.)
Carrick (Comment #108896)
January 25th, 2013 at 12:36 pm
“Victor:
In August Anthony Watts promised an update of his manuscript within two days. It is now almost half a year later.
Now you’re just being petty.
He should update it when he’s sure the problems are fixed and no sooner.”
Carrick and Victor:
When I first read the Watts manuscript I could see by the way it was vaguely worded that some confusion about the TOB adjustment and what was included in the Adjusted and Unadjusted series could be a major potential problem for a misinterpretation of his results. Unfortunately Steve McIntyre put his name on the manuscript under the assumption that Watts understood what was in those series. As I recall Watts appeared to me to have put that paper draft out as some kind of symbolic jester to someone else putting out a paper. In other words, he did it in a not very well composed scientific manner.
Watts and his team put in a valiant effort in collecting field data on USHCN stations and he does provide a professionally appearing blog that can provide background stories on climate science, but in my estimation Watts is not particularly well attuned to the science of climate and not even as an informed layperson. That makes it a bit surprising that people would take him and/or his blog as a representative of an informed source of so called skepticism on climate science.
Zeke,
You haven’t answered any of my questions. But you know that.
Por ejemplo: Did you contact Anthony and give him a chance to explain/clarify/retract, BEFORE you posted this attack on him? Do you understand the question? That is different than giving him a heads-up, WHEN you published the crap.
This just looks disingenuous:
“I gave Anthony a heads-up when I published the article. While he has argued that he didn’t explicitly claim fraud, he hasn’t backed away from his statement that the data was manipulated to show warming, or that it would be jailable behavior in the business or financial world.”
This looks like some weasel worded stuff, Zeke. Unless Anthony argued what you say he argued, BEFORE you ambushed him with this crap, then it looks like you are pretending that you gave him a chance to recant that he rebuffed, BEFORE you attacked him. Aren’t you just giving us your characterization of what Anthony said on his blog, AFTER you ambushed him here on lucia’s blog? The reality is that Anthony said he didn’t say “fraud’, and a reasonable interpretation is that he is saying he wasn’t accusing anybody of fraud. Are you calling him a liar, as well as a growing cancer? Anthony has declined to defend himself in detail, and he asked you a series of simple direct questions, that apparently you can’t or won’t answer. Answering questions directly seems to be a big problem for you, and your buddy Mosher too.
“Whether this statement is tantamount to accusing NCDC of fraud is somewhat subjective, though I believe that it rather clearly is.”
No, it is very subjective. And those who were embarrassed by Anthony’s giggling over the BEST-JGR-G&G fiasco might take his words in the Fox article not as hyperbole or a loose analogy, but as an opportunity to grind an axe. Did you see what that spokesman for the Concerned Scientist crowd said about the non-believers? Is that cancer too?
lucia,
Will you please answer: Don Monfort (Comment #108902)
Victor Venema,
“What matters to an automatic homogenization algorithm, such as the PHA, is how much variance is explained by the inhomogeneity.”
I’m sorry but this does not prove anything.
“Thus this may introduce a small bias in manual results.”
Not so small that that and not only in manual processing.
For practical, you certainly know that virtually no trend is corrected in the main global temperature curves. You certainly know also that BEST has never claimed to correct trends.
Phi, yes I know that the correction for increasing urbanization is very small and that the people who studied this think that it should be a small correction on average because it only affects a small part of the data. That is about all I know, I have not studied it myself.
lucia:
I agree. I wouldn’t have looked twice if Zeke has said that. The problem is I’ve seen the exact argument Zeke made time and time again in debates over global warming. I could find tons of examples on Real Climate and Skeptical Science where skeptics are mocked for not “doing their own work.” And not only is it a common problem, it’s eerily similar to what Zeke was talking about:
That fits what Zeke said perfectly. How do you condemn one approach because “it stymie[s] any possibility of constructive scientific discourse” while promoting another approach that has the same effect? It creates the image of calling Anthony out for certain behavior while engaging in equitable behavior.
As though that’s not messed up enough, people like Mosher then come along and promote Zeke’s comment as right. It’s even more awkward when you realize the two vocal members of the BEST team both wound up promoting a position that shuts down critics right after BEST published a paper.
(On a somewhat personal note, I saw both Zeke and Mosher’s comments shortly after I raised multiple issues with BEST’s record. In effect, both told me I should shut up and stop examining their work!)
Lucia, by the way, where I expect the climate models to be most biased is in the strength of the natural climate variability. There are likely many physical processes not implemented as they expected not to or have been shown not to influence the trend, cause feedbacks. The natural variability of these processes will be missing in climate runs. Does anyone know if the climate models have been validated for the magnitude of their natural variability?
Victor Venema:
It is indisputable the paper found well-sited stations had lower trends than poorly-sited stations in the raw data. It is also indisputable the well-sited stations showed notably higher trends after being adjusted (while poorly-sited stations did not have a similar, inverted pattern). It is also indisputable that “bad” data is expected to need more adjustment than “good” data.
The effect of the adjustments is known. This means the only question is whether or not the adjustments are what they “should be.” Good data being adjusted more than bad data is unexpected and suspicious. That doesn’t prove prove anything, but you have to be incredibly obtuse to say it doesn’t suggest anything. And it requires a lot more than obtuseness to say:
Not only is that a petty comment, it’s completely untrue. Watts didn’t promise anything of the sort. He said:
For all your talk of factual errors at WUWT, you do a terrible job of getting even the most basic things right. Criticizing people while making things up makes you at least as bad as you say WUWT is.
Victor– I think short scale variability is almost certainly wrong in many models– and that’s testable. I keep promising to blog more on that… but I’ve let myself get distracted in January. (The short scale variability in models is generally *too high*. For some models it is ‘insanely-farmers couldn’t grow crops because they don’t know whether to plant oranges/olives or cabbages/cold tolerate wheat to high”. In others it might be about right– or even possibly low. But on the balance I think short term– as in time scales less than about… oh…. 75 months or maybe 150 months–is too high in models. This is based by comparing residuals to fits for earth and for models.)
Long scale is variability is virtually untestable because we don’t have enough earth data. But if the short scale is wrong there is no particularly good reason to jump to the idea that there is a magic-correcting mechanism that causes the untestable things to be right. I’m not sure that one can say that if short-scale variability in models is too high that it follows long scale will also be too high. But that particular factoid wouldn’t be evidence that long scale variability is to low.
Don–
Zeke and everyone who is granted author privileges can post when they want to do so. Some send me an email in advance… some don’t. They all know it’s not a problem and I think they all know that I would “take away their keys” if they did something I felt was against my informal “what authors can do” policy. I will also say I disagree if something falls in the camp of acceptable post– but something I disagree with.
Oddly enough, I often don’t know co-bloggers post until I either visit the blog myself (which is frequent) or when I see a comment requiring moderation. The latter is the way I learned this one was posted. This is SOP and has been for years.
I did not check if Zeke asked Anthony before he posted. I didn’t check afterwards. I don’t babysit Zeke (of SteveF or PaulK or anyone who is permitted to post a blog post.)
If you want to check up on Zeke, why don’t you ask the one person who could confirm or deny this: Anthony?
Victor Venema,
“Phi, yes I know that the correction for increasing urbanization is very small and that the people who studied this think that it should be a small correction on average because it only affects a small part of the data. That is about all I know, I have not studied it myself.”
Yet you are often categorical. But, perhaps you know that Böhm can justify most ALPCLIM adjustments (about 0.5 ° C in the twentieth century) only by a progressive decrease in the influence of urbanization (0.5 ° C at the end of the nineteenth century and nothing in 2000)? It is curious, it is’nt? I mean, 0.5 ° C on average, it is much and we know that the sources of perturbations have increased tenfold over this period, it is still strange that we find no trace of this progression in temperatures records. Because, not corrected trends, this is it, it is not ? to admit that the explosion of energy consumption and urban drainage have no influence on temperatures? Strange, strange, because as I pointed out above, energy consumption and urban drainage doubles heat production of urban-type surfaces in temperate climate.
Brandon
I don’t interpret what they wrote as meaning that.
I’m not sure which thing you think Zeke did is similar to what he is criticizing Anthony for. Zeke criticized Anthony for insinuating that NCDC’s data processing amounts to jail-able offensesn. I don’t think Zeke’s criticism of Anthony in anyway implies that Anthony should be sent to jail. So: Zeke is not doing what he criticize Anthony of doing.
And like it or not the way Anthony’s words are organized does imply that something people at NCDC are doing with the thermometer record deserves jail time. I know there are people who are trying to defend it as somehow not accusing anyone of “fraud” (while, in the same comments blog, others are defending Anthony’s words based on their opinion NCDC is committing fraud and scientists maybe should be sent to jail.)
As for your suggestion that Mosh and Zeke are somehow suggesting people cant discuss BEST methods: I think nothing could be further from the truth. I don’t think Mosher and Zeke suggesting that Anthony’s implying that people at NCDC should go to jail communicates the idea that BEST results or methods cannot be criticized or discussed on their own merits. Zeke and Mosher are just saying that criticisms that amount to suggestions someone should be sent to jail for their research should be discouraged– and they are right about that.
Thanks for your reply, lucia. I was not familiar with your practice regarding post authors. I was wondering if you would have extended Anthony the courtesy of explaining/retracting his comment, before the attack. Since, you did not see the post before it went out to the world, I guess that’s moot. Or should I say mute? I won’t need to ask Anthony. I already have Zeke’s answer, which tells me all I need to know about Zeke. I need not make any further comment on the matter, unless Zeke decides to be more responsive to the questions.
Lucia, this is an image from Chiefo’s site, which puts things in perspective
http://chiefio.files.wordpress.com/2013/01/dbstealeyco2vst.png
note the variation of Tmin compare to Tmax
Phi, you should cite Reinhard Böhm completely. He explains the corrections with a decreasing urbanization *of the network*. Single stations may have been affected by urbanization, but the percentage of stations in cities has declined.
If I remember correctly, he does not explain the reasons in more detail in that article and unfortunately we cannot ask him any more. One reason could be that many meteorological offices were relocated from cities to airports. While airports are not always rural, they likely have less UHI effect as the city they belong to. Also cities are typically located in valleys and when airports were build there was only space for them higher up.
Doc
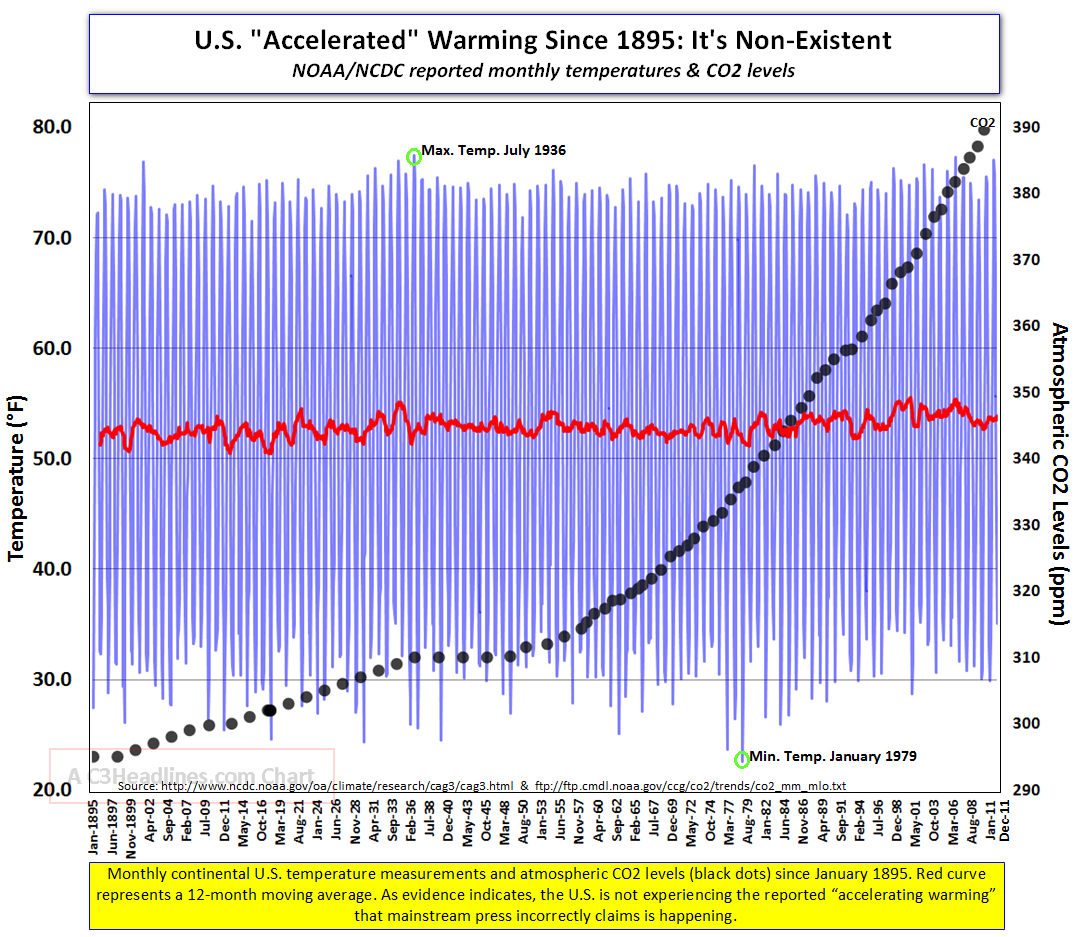
Your going to have to use words to tell me what perspective you think this puts things in. ‘Cuz… I see text to point out the coldest day in january is still colder than the hottest day july. Yes. Of course.
So… other than things everyone agrees on, what do you think that graph is “saying”.
Doc

Your going to have to use words to tell me what perspective you think this puts things in. ‘Cuz… I see text to point out the coldest day in january is still colder than the hottest day july. Yes. Of course.
So… other than things everyone agrees on, what do you think that graph is “saying”.
I take that back about not commenting. I just noticed this:
“And like it or not the way Anthony’s words are organized does imply that something people at NCDC are doing with the thermometer record deserves jail time.”
Do you seriously believe that Anthony believes or is advocating that people at NCDC should go to jail for the data “adjustments”? Do you think he is an idiot? Do you think that Anthony knows of some law against dodgy data adjustments by government bureaucrats that includes jail time for offenders? What is the crime that you people think that Anthony is accusing the govt workers of? Statute #, please? The point that it appears to me that he is making-with a little hyperbole analogy metaphor whatever-is that standards for people in business are more strict and demanding than they are for government bureaucrats, who are rarely held to account for the shoddy work they do while suckling at the public teat.
If a hockey fan makes the observation that if people outside the arena engaged in brawls they would go to jail, that doesn’t mean he is accusing the players of criminal behavior. Maybe it means that he thinks the players should clean up their act.
This is much ado about nothing, compared to the death trains, the holocaust crap, exploding schoolchildren, etc. Has Zeke ever pointed out that crap as deserving of condemnation?
Oh, now I am on moderation. Just stick it lucia
Victor Venema,
Your details contradict what I said? No. 0.5 ° C is not a small bias and it is a mean, a mean! And, what is more, a minimum average of perturbations by urbanization in the nineteenth century while urban drainage was in its infancy and energy consumption ridicule. In addition, where increased urbanization was stronger than near 50s airports?
Where then are the indispensables corrections of trends?
DocMartyn (Comment #108930),
Carrick, I, and others have kicked this around before in some detail. The largest contributor to short term global temperature variability is from the northern hemisphere winter months (November to March) where huge deviations, both warm and cold, from the historical monthly averages are quite common. It is not uncommon to encounter very “unusual” warmth or cold in the winter northern hemisphere. The southern hemisphere has much less wintertime variability. The explanation appears to be a combination of 1) much more low heat capacity land area in the norther hemisphere, allowing larger/faster temperature swings, and 2) less thermal isolation of the Arctic from lower latitudes than the Antarctic (which is surrounded by the cold southern ocean).
Also cities are typically located in valleys and when airports were build (sic) there was only space for them higher up.
This is easy to check, at least for the U.S.:
St Louis: 219m (city), 176m (airport)
Phoenix: 337m, 339m
Chicago: 205m, 187m
Amarillo: 1117m, 1095m
Anchorage: 40m, 43m
Memphis: 96m, 86m
Helena: 1263m, 1188m
Phi: “In addition, where increased urbanization was stronger than near 50s airports?”
You are the guys who are claiming that the UHI causes large biases in the temperature. Then you will also have to conclude that moving stations out of the UHI will first lead to large cooling effects, after which a trend due to urbanization may start again, depending on conditions.
JR, do you also have the numbers for the Alps? Europe looks a bit different and the Alpine countries certainly will.
Steven Mosher may be able to explain this better than I can.
Sorry Lucia, the point was how little the average of (Tmax plus Tmin)/2 describes changes in the blue line
There is far more variability of Tmin than in Tmax; as SteveF points out, those winter months in the northern landmass introduce a lot more variability than the stagnant south.
The spikiness of the actual min’s and max’s is rather overlooked.
@SteveF (Comment #108900)
You are confusing cause and effect. Their research leads them to conclusions that align with some of the causes of ‘greenies’, that is, reducing CO2 pollution.
Naturalists looking at the mass extinction now occurring could be accused of the same thing.
DonMontfort
Are you seriously trying to argue by asking rhetorical questions? I already said what I think about Anthony’s statement. It’s not difficult to understand what I wrote.
You are not intentionally moderated. Akismet or the “bad word” filter moderates people from time to time, I’m not always sure why. I’d have to read carefully to figure out why. Obviously your comment has been deleted. (I’m on my way to have fish at the Moose for dinner. So… if Akismet moderates you again, it could take a few hours to be released. Sorry about that, but your name is not in any moderation list.)
He should update it when he’s sure the problems are fixed and no sooner.
###########
carrick the issue was not using TOBS. That is just a switch of databases and re run the data. Folks like Zeke and I who suggested that are kinda wondering what the results were. hint, I know more than Im letting on and dont walk too far out on the plank
don: “Oh, now I am on moderation. Just stick it lucia
hey don, did we really land on the moon?
Brandon:
‘It is indisputable the paper found well-sited stations had lower trends than poorly-sited stations in the raw data. It is also indisputable the well-sited stations showed notably higher trends after being adjusted (while poorly-sited stations did not have a similar, inverted pattern). It is also indisputable that “bad†data is expected to need more adjustment than “good†data.
it is very disputable that the study found that.
A) the methodology for categorizing stations is not peer reviewed and there is no published data on any field experiments. You should recall the conversation we had with Christophe about that.
B) Anthony has not released his list of sites for anyone to check.
recall he did a new categorization based on A
C) I’ve ask how they averaged their data. No answer.
So, put your skeptic hat on. everything is disputable. The question is : it is a good dispute. Without the data, without a methods description, then you got nothing. I’m more than willing to use Leroys system ( since its official) but it would be nice some day to get the categories actually tested. One guy I know in fact ask for this data from the original researchers.. crickets ( maybe just a language thing.. )
You are the guys who are claiming that the UHI causes large biases in the temperature. Then you will also have to conclude that moving stations out of the UHI will first lead to large cooling effects, after which a trend due to urbanization may start again, depending on conditions.
I think that that scenario is very plausible. Here is a comparison between Amarillo and Phoenix. Both have upward-trending temperatures at the old city sites. After the moves to the airports, the trend goes flat. Then you can see where urbanization around Phoenix’s airport begins to have an effect. You don’t see the same at Amarillo, probably because the airport, unlike Phoenix, remains outside of the main urban area.
Bugs,
Nah, both are probably cause and both also probably effect, with no simple way to separate one from the other. The truth is that different fields attract different kinds of people. People want to do things they think are good, worthy, important, etc. So the environmentally concerned are naturally attracted to fields like climate science.
Of course, I don’t expect you can imagine that presents any potential problems, but lots of folks can.
Zeke, I am curious about the changes that were made to improve BEST improvement against GHCN in the benchmarking test and whether the changes are part of the current BEST version or sheduled for a future version. This is third time I have asked that question and it was most recently asked at this thread in a much longer post. I am also curious whether those changes would affect the BEST series match to GHCN.
“I do have a question about that addressed to Zeke: Have the changes made to improve the BEST performance as you noted in another thread been applied to the most recent version of BEST or is a revision planned for the near future?”
Kenneth,
As far as I know, the changes are scheduled for release with the next data update (right now data only goes through 7/2012; I think they will update the web site soon to go through 12/2012). Not sure of the timeline though, as I’m somewhat out of the loop on Berkeley stuff at the moment.
Thanks, Zeke for the reply. I think my wife’s methods do work. I will not name the method but it starts with an n and ends with g and is three letters long.
Kenneth,
No worries. I’m sorry I don’t always respond to every comment in a timely manner; my day job isn’t science communication, unfortunately 😉
WRT to UHI, urban population densities declined from their peaks (~1900). Moreover weather stations moved out to the edge of cities in the same period. Where densities have increased is the suburban (periurban) areas.
Eli, population density is a rather poor metric in any case. look at actual sites using historical 1km us census data if you are interested in testing your speculation. You can bug me for a copy and I think Zeke may have used it in his recent paper
Population only directly effect one aspect of the TEB, so dont hang your hat on it.
at some point I’m going to finish the work on ‘depopulation’ kinda interesting
” After the moves to the airports, the trend goes flat. Then you can see where urbanization around Phoenix’s airport begins to have an effect. You don’t see the same at Amarillo, probably because the airport, unlike Phoenix, remains outside of the main urban area.
####################
Interesting around 50% of urban/rural studies use an airport location for rural.
Whwn you consider the factors that UHI in a city you can see why some airports would be cooler than the city.
1. Sky view factor / height width ratio. In cities with taller buildings you have restricted sky view. This leads to radiative caynons in cities.
2. roughness: airports tend to have lower roughness than cities
and long fetches. One of Oke early critics argued that UHI was fundamentally a function of fetch.. not true but it does play a role.
3. Anthro heating. depending on the air trafficc and the urban site, the anthro heating at airports could be lower.
4. Albedo and emissitivy. I’ll have to look at it but gut says higher albedos and lower emissitivity at airports than in “most” urban areas.
This does not mean airports are as good as rural, but most of the physics suggests they should not be as bad as the worst city location. its a continuum.
True enough, but population density is an indicator and pretty much scales with building density, etc. To pick extreme examples, was the UHI effect higher in Newark in 1950 or 2010, same for Detroit.
From direct experience, everyone knows that moving short distances in urban areas can have drastic effects on temperature (e.g. walking into a park).
”
True enough, but population density is an indicator and pretty much scales with building density, etc.
Actually it scales with building height. You can see this plainly by looking at census data which captures both population and number of residences. When you see the ratio of people to residences increase it is because of multi story buildings . Then you can pull up GE and have a look.. BTW the average building in US cities is something like 12 meters ( for big cities, LA, phoenix )
Mosher # 1088771 “,
This is what Zeke said on 23rd at WUWT referring to Anthony’s comment on NOAA/NCDC
QUOTE
As far as the fraud question goes, while you didn’t use that word, accusations of data manipulation and remarks that folks would be jailed if they engaged in the same behavior in the business or financial realms amounts to effectively the same thing in my reading at least. Perhaps I should have used the term unethical behavior instead of fraud, and I apologize if I put words in your mouth.
UNQUOTE
So before you spout off next time, do your homework instead of looking foolish.
So basically Zeke says ” fraud ” is a wrong word but it is OK in his opinion to use the word ” unethical “. OK? So much for all your nonsense in your post of what Zeke knows about NCDC/NOAA and how he values their work and so stands up for them etc. etc. blah blah..
He seems to know enough about their statement in press to state that he should have used the word ” unethical ” instead of ” fraud “. Get it? So it’s nothing but word parsing on describing an unethical act by a taxpayer funded Government Organisation.
He’s condoning their act and deciding what Anthony should say about what their statement meant to Anthony. He says that it can be termed as an †unethical ” act but not in terms Anthony used. Bloody hypocritical of him to do so.
To hell with it. Who’s Zeke to decide what language Anthony should use to express his personal opinion about the behaviour of a taxpayer funded Government Organisation, especially when they indulge in deliberate malfeasance? Who’s Zeke to decide that †unethical †is a good word and other words are not. What kind of a weird world do you all inhibit?
And Mosher, the irony is that Anthony never used the word fraud. It was Zeke who interpreted Anthony’s post as accusing NOAA/NCDC of fraud and then proceeded to word parse stating that he would have used the term unethical. So Zeke creates a strawman, decides the word what he felt Anthony intended and then decides what word he would have used instead of that and then goes into huff with a blog post about it, for a comment that was not aimed at Zeke at all and did not contain the word fraud.
Absolutely ludicrous!
Looks like Zeke has too much time in his hand to make a hue and cry over his self created strawman.
And you have the gall to ask me to apologise without even knowing what the hell you were writing about in the first place. Absolutely moronic!
Mosher points out an important issue:
I said “it is indisputable” the Watts paper found certain things. I misspoke. What I meant to say is it is indisputable the paper claimed to find certain things. I wasn’t meaning to say the paper was right. I was merely trying to emphasize the fact the paper was clear on what it said (at least in regard to certain basic points).
The reason for it is Victor Venema misrepresented basic facts about Watts, his press release and his paper. Given the level of distortion being practiced, I wanted to emphasize which points of interpretation were beyond dispute.
In other words, I meant to say the paper is clear on what it says about those issues, not that it is right on them. Sorry for the mistake!
Victor Venema,
“Then you will also have to conclude that moving stations out of the UHI will first lead to large cooling effects,…”
Exactly. The proved cooling effect of stations moves is one of the best proof of the importance of the UHI effect on the network.
“JR, do you also have the numbers for the Alps? Europe looks a bit different and the Alpine countries certainly will.”
For my part, I only have two examples in mind: Geneva +15m, Sion -54m. In a mountainous region, it is difficult to implant an airport elsewhere than in the valley.
Brandon:
Back to the words parsimonious and charity again.
I didn’t interpret your statement literally.
Troy_C pointed to this link on another thread.
Venter doth protest too much, methinks.
lucia:
It is an accurate portrayal of what their comments meant. If a person who raised criticisms is told what they did was not “proper” or “scientific,” they’re effectively told nobody (working on the topic) should listen to them. Requiring a completely redone analysis before any criticisms are allowed to be spoken creates such a huge obstacle for most individuals it effectively tells them to shut up.
When Zeke criticized Anthony’s behavior, he focused on the effects of that sort of behavior. If a reason the remarks by Watts are wrong is the effects those remarks had, anything that has the same effects should also be wrong. That is what is similar. It doesn’t matter if you cause an effect in one of a thousand different ways. If causing that effect is wrong, all of the thousand ways are similarly wrong.
In other words, the similarity is in the effects the action has, not the nature of the action itself.
I agree, and I agree Watts was out of line. I also agree Zeke didn’t say anything remotely as in inappropriate. However, I say Zeke’s comment is of a sort that causes (at least many of) the same negative effects as Anthony’s.
While that may be all Zeke was meaning to say, it is not all he did say. And it is certainly not all Mosher said. When I posted a comment repeating the point made in my first comment on this page, Mosher’s responses consisted of things like:
That isn’t merely saying Watts was out of line (which he was). It’s saying if you can’t provide a better answer, you aren’t doing “your job.” You aren’t doing “science.” Comments like that allow the speaker to dismiss practically any criticism out of hand. It’s like when folks at RealClimate argued skeptics shouldn’t criticize temperature reconstructions if they didn’t offer alternative ones of their own. Replace “temperature reconstructions” with “modern temperature records” and you have exactly what I described: People saying others can’t criticize BEST without doing a better job than BEST.
Carrick,
I’m exactly naming what Zeke and Mosher did. If you find what I said is factually wrong, let me know.
It seems that naming the act is a bigger sin than the act itself.
Venter:
You are using terms like “moronic” which were clearly meant figuratively rather than literally, so this is more like name-calling than naming.
Just saying.
Brandon
Again.
The way science works and progresses is by people replacing wrong theories with less wrong theories.
You are welcomed to just do the critical half of science, but dont expect to get anywhere doing that. Its more like debate than science. so, go do science and forget debate, cause you suck at it, debate that is. Your ability to do science, I remain open minded.
Carrick:
I highly approve of the principle of charity, and I try to follow it myself. If I had read someone else say what I said, I’d never assume the most literal interpretation. There is always a possibility a paper is wrong when people say a paper “finds” something. That doesn’t change the form of my remark. At the very most, it means I should add the parenthetical “perhaps inaccurately” to some sentences.
By the way, props on bringing the principle of charity up on this page. It is pretty much the standard Zeke (seems to) promote.
It was moronic specifically because
a.] Mosher did not even read what Zeke had said about Anthony’s comment in Anthony’s own thread and came wading into the conversation aggressively, calling me a bozo. It was a moronic act.
2.] Mosher then deliberately misrepresented Anthony’s post in WUWT where Anthony asked his readers if he should sue Greg Laden for misrepresentation.
QUOTE
The other day a blogger suggested that Anthony was stupid to post something about life forms in a meteorite. God forbid somebody post something negative about Anthony.Lawyers were called. Why, well because it put Anthony in a bad light.
UNQUOTE
This was a misrepresentation of the truth. Read the story behind that incident at below link. You can see for yourself that what Mosher stated was a misrepresentation or not
http://wattsupwiththat.com/2013/01/16/greg-laden-liar/
You and I and all of us know that Mosher is no intellectual slouch. What he did in both cases I listed above was moronic. That’s exactly what I stated. I named the act.
Carrick,
I named the act. Reasons are
1.] Mosher did not bother to read what Zeke had said at WUWT about Anthony’s interview with FOX. He waded in aggressively with a post calling e a bozo without having done his homework and understanding what was being discussed. That was a moronic act.
2.] Mosher made the following statement in that post
QUOTE
The other day a blogger suggested that Anthony was stupid to post something about life forms in a metorite. God forbid somebody post something negative about Anthony.Lawyers were called. Why, well because it put Anthony in a bad light.
UNQUOTE
That was a misrepresentation of why Anthony wanted to look at options for suing. Read the below article and see.
http://wattsupwiththat.com/2013/01/16/greg-laden-liar/
Mosher is no intellectual slouch. So again this post was moronic for misrepresenting the actual situation.
@BS
If there is one person who has studiously refrained from negative comments about anyone, it is Zeke. I am amazed at his restraint.
>This means that the entire collection of models are likely to share many ideas on “small†things. In fact, they will often share the most “conventional†ones and wait a long time before sliding in some non-conventional new “small†idea. The end result can be biased.
The papers published about the models tend to compare themselves to other models and treat the agreement among them as evidence of correctness.
“I highly approve of the principle of charity, and I try to follow it myself.”
ya right chewbacca
Brandon,
“I highly approve of the principle of charity, and I try to follow it myself.”
With a lot of emphasis on ‘try’, since there seems to be very little charity in most of your comments. Sorry, but that’s my honest assessment my friend.
Zeke,
I wanted to respond to your earlier comment about ‘Terminator Seeds’, but simply forgot. A dark and nefarious picture can be painted of this possibility, of course, but it is important to remember that there is a long relevant history of something similar: hybrid seed varieties can’t be “saved” by farmers either, since the gene mix in the subsequent generations will be scrambled and the crop will produce poorly. (see for example: http://aggie-horticulture.tamu.edu/archives/parsons/vegetables/seed.html).
.
So seed companies have been doing effectively the same thing for decades by selling (very desirable) hybrid seeds. The problem the seed companies face with genetically modified crops is identical to the pirating problems faced by authors and the entertainment industry: the cost to produce the first copy is high (potentially astronomical), but all later copies can be made essentially for free. So genetically modified crops which are not also hybrid (and getting away from hybrid seed can save a lot of money) generate little or no economic gain if they are not somehow protected from unauthorized “copying”.
.
Just as with pirated music and films, this is a knotty problem, and there are no simple and obvious solutions. The potential benefits for humanity from genetically modified crops are large (imagine being able to grow rice or wheat with salt water!), but there is no easy way to fairly compensate a company for its development efforts… absent “terminator” technology. It is a subject where international agreement on how to proceed might make sense. I don’t know what production/compensation model would work, but the free saving of genetically modified seeds by farmers destroys the incentives needed to advance this important technology. Perhaps wealthy countries could jointly “buy-out” the patents on desirable genetically modified varieties and make them freely available to all. Alternatively, governments could allow terminator technology during the term of a patent, but legally require deposition of an equivalent non-terminator version of the same variety for free release upon patent expiration.
Zeke (Comment #108953)
Zeke, on putting all the 7 world simulations descriptions into the link you sent showing the improvement of the BEST algorithm without meta data, I noticed that I did not see the “true” trend in the table. The raw data is there but not the truth. Obviously a good performance would put the adjusted trend further away from the raw and closer to the truth, but knowing the truth helps refine the analysis.
Ok. I’m mystified why you would wish to make this point. The blue trace is the max/min for the day? Are any of the traces (Tmax plus Tmin)/2 for the day? Seems to me none are. The red is a 12 month moving average. Of course it doesn’t look like max/min for the individual days. As far as I can tell, the point you are making is somthing equivalent to: “Despite the increase in both the minimum and maximum temperatures for the time of year, current Januaries are still colder than past Julys.” No one disputes that January is still colder than July and that in the midlatitudes and polar regions the annual cycles are are much larger than the magntude of warming.
So, if the purpose of the graph is to make this point… I don’t disagree. No one will But I know why you bother to make it. Are you trying to make some other point? If you are, elaborate and state in words your larger point.
Sure. When SteveF mentions this, it’s generally part of some broader point. Are you trying to make some broader point?
Overlooked by whom? You’ve noted SteveF points it out. It seems to me all of the following have been discussed at blogs, and in peer reviewed literatures: The diurnal variation, Annual variations, Noisiness– or random nature– of weather. Any of these might be what you are collectively describing as “the spikiness of the actual min’s and max’s”, but I’m not sure which one really is.
Kenneth,
The numbers in that table were trend error relative to truth, so 0 would be no trend error (e.g. identical trend to truth).
.
Venter,
If you really think that my remark was an accusation that NCDC was acting unethically (hint: they aren’t), I don’t know what to say. Try reading again, and perhaps in context.
Dear lucia,
I apologize sincerely for the last line of my previous post. I thought I was being picked on. Silly me 🙂 You are one of the good people in the climate science soap opera and I should have known better.
However, those are not rhetorical questions I asked. I think this summarizes your comments on Anthony’s alleged abuse of the NCDC:
” So I have to agree with Zeke that it’s regrettable Anthony made any allusion to “jailâ€.”
He didn’t make an allusion to “jail”. He actually used the word “jail”. Do you mean that it is your opinion that Anthony was advocating that someone should literally go to jail? I was asking you about Anthony’s actual motivation, what he actually meant by his comment. That he was alluding that someone should actually go to jail is a guess. Does that seem like something that Anthony would do? Has he ever said anything like it before? Guessing that Anthony literally meant to advocate that someone at NCDC should go to jail, seems like a stretch to me. Maybe that doesn’t matter. OK.
I think this is much ado, about nothing much. If Zeke were really interested in a retraction, he is smart enough to know that ambushing Anthony and using him as a poster boy for climate science cancer was not the non-confrontational, civil way to get it. I am not surprised that Anthony didn’t roll over for Zeke, and neither is Zeke.
Anthony would have been better off not causing the perception that he was alluding to somebody going to jail. He should receive a smack upside the head. Zeke should not have ambushed Anthony, while failing to fully develop his story about the cancer. He couldn’t think of any of the other tumors? Anthony has been very restrained in his reaction to Zeke’s ambush. I think Zeke should be run out of town on a rail, or crucified, followed by burning in oil. And if my moms knew about my disrespectful comment to lucia, it would be like her to say that I need to be beat within an inch of my life. I never took her to mean that literally. Of course in these more sensitive times, I would call CPS on her.
Don
My only opinion about what Anthony was literally advocating is that what he was literally advocating that is irrelevant to my thinking considering it regrettable that Anthony brought up “jail” when discussing NCDC’s methods, choices and history for developing the thermometer reconstruction. I think what he said was regrettable either way. If you want to know Anthony’s actual motivation, you’ll have to ask him.
Sure. And I haven’t tried to make any guess about that.
Beats me.
Maybe. But you seem to be guessing that people who criticized Anthony for what he said were themselves guessing that Anthony meant something or other. As I said: I made absolutely no guess about that. Why would I bother to guess the answer to a question when that answer is utterly irrelevant to my opinion about what he said? He said what he said. In an interview with a major cable news network and it was published. I think that’s regrettable.
Uhmm… this is what I said in the first place. It’s regrettable that he alluded to the whole “jail” thing.
Uhmm…. Oddly, while you seemed to start out objecting to what I said, you now have not only agreed with what I said but seem to be suggesting Anthony should be (presumably figuratively) smacked.
So.. what Zeke did isn’t figuratively “smacking [Anthony] upside the head”? I would have thought it was. Is your objection that Zeke should have chosen “pimple” or “acne” for his metaphor instead of “cancer”? Because pimples are more benign? Because you are really losing me here.
I know Anthony might be grumpy with me. Obviously, some of Anthony’s supporters are. But really, I don’t think Zeke ambushed Anthony. I think he criticized him. I think Anthony responded to the criticism like a man– and I think Anthony disagrees with Zeke. That happens sometimes. But I don’t think that makes public criticism an “ambush”. Not literally; not figuratively.
Zeke (Comment #108986)
Gotcha. Trend error not trend. Thanks much.
Yes lucia, figuratively smacked. Now you get it. It’s a figure of speech. Like “they outta be jailed for that”. Big deal. Is making Anthony the poster boy for the alleged cancer growing on whatever justified? Mountain out of a molehill, and a prima facie case of selective self-righteous indignation.
Zeke defined his cancer metaphor/figure of speech:
“It is a cancer of bad faith, a default assumption that the other side must be lying, stupid, or in the pay of someone nefarious. It manifests itself in one-sided discourses, and personal attacks, and in the blind rejection of results that do not conform to a specific world view.”
He is singling Anthony out making him the poster boy for all that bad stuff, based on a single ambiguous alleged allusion. That is some pretty thin justification. And why was it that little ole Anthony triggered this sudden outpouring of outrage with an ambiguous comment, when there are much better and glaring examples of all that crap that should readily come to the mind of the character who is so upset about it? And if Zeke wanted to get Anthony to explain or retract what he said, he should have run that by Anthony, BEFORE ambushing him from behind the curtains in your house. Anthony’s misstep may well have been inadvertent. Zeke planned his ambush and perhaps went though several drafts until he thought he had gotten it sufficiently nasty. I am pretty sure that if you wanted to make a similar admonition, you wouldn’t have pulled out that cancer crap.
And I wonder why Zeke thinks that he doesn’t owe Anthony the courtesy of answering the very simple questions that Anthony politely asked him at WUWT. Maybe Anthony has recently hurt Zeke’s feelings. Anyway, in the silly soap opera that climate science has become, this is not an interesting episode. FIN
lucia (Comment #108991)
“I think Anthony responded to the criticism like a man– and I think Anthony disagrees with Zeke. That happens sometimes. But I don’t think that makes public criticism an “ambushâ€. Not literally; not figuratively.”
I think these personal discussions go nowhere fast – unless those discussions might be legitimate criticism of how an individual is handling technical matters. Anthony was wrong in my view because his comment was not meant to promote discussion of the technical aspects of the matter at hand.
I suspect Anthony overreacted because he continues to be upset with the GHCN people because they used his CRN findings to publish a paper and paper that concluded something that perhaps Anthony was not expecting. The GHCN authors did nothing wrong and I do not recall if they gave Watts and his team a proper acknowledgment for the work done. When Anthony found some technical support to allow a publication of the more complete work of CRN ratings the general conclusions were little different than those of the original GHCN authored paper. I have stated problems I have had with how the analyses was carried out in both of these papers but that is neither here nor there in this discussion.
What perhaps Anthony could do for penance here, if he already has not, is to man up to his problems in prematurely issuing that ill fated draft several months ago where the conclusions were based on TOB confused data. A technical apology if you will.
PS: I have had some questions into GHCN for several days now and I usually receive prompt replies. I hope this incident is not affecting the reply.
Victor Venema (Comment #108850)
I have been looking at the manuals that are used for some of the temperature homogenization algorithms (starting with Climatol and the function homogen in R) and I have not found a part of the process that would look at a trend that spanned the entire difference series by super imposing a single trend or a series of undetectable small ones all in the same direction. Obviously that determination/detection would have to be part of the process that would look at the overall trend in a difference series – and perhaps after the standard homogenization of the difference series. That process, however, would be difficult to threshold, since we already know that a reference station and near neighbor stations can have different overall trends and even when those stations have a good correlation and their differences are free of breakpoints.
If I could impose upon you as an expert in this area, could you please provide me with reference to a homogenization algorithm that describes how this matter is handled – or not? I would prefer a link, but at this point I’ll settle for a pasted comment in a reply post.
And by the way I felt a bit better about how I did my simulated breaks when I read in the Climatol manual that they did theirs with a 600 point simulation from rnorm in R and with a reasonable sd I assume and placed the known single breaks squarely in the middle of the series. Obviously they were not benchmarking, but note that they did the simulation with a single series that was assumed already differenced – as I did.
Zeke,
As you well know, LTL trends and surface trends are not supposed to match–LTL should be higher. Citing the correspondence of LTL and adjusted surface trends is not a good argument. In fact, it cuts directly against your claim. The adjusted surface trend is either too high or the LTL trend is too low.
Lets see if you have the guts to post an honest update to your posting acknowledging that it is not generally agreed that LTL and surface trends should match.
Dear Kenneth Fritsch, as far as I know CLIMATOL does not use trends in its homogenization, only breaks. Thus if you give it a difference time series with a trend, it will insert multiple breaks to remove the trend. Just try it.
I am not sure what kind of reference you are looking for. The updated version of SNHT includes trends and breaks.
Alexandersson, H. and Moberg, A.: homogenization of Swedish
temperature data.1, Homogeneity test for linear trends, Int. J. Climatol., 17, 25–34, 1997.
Victor Venema (Comment #109015)
“I am not sure what kind of reference you are looking for. The updated version of SNHT includes trends and breaks.”
Victor, I need something specific with regards to a trend that runs the length of the difference series. I know that all these algorithms deal with trends and mean changes within the series.
It would be something in addition to finding trends and breaks within the series. Would you agree?
12 m, maybe in the core and Manhattan.
Kenneth Fritsch, no I do not agree. A trend over the full series is just a special case of a local trend, where the beginning of the trend is at t=1 and the end at t=n.
I think one blogger has made a case that NOAA/NCDC are being deceptive.
http://notalotofpeopleknowthat.wordpress.com/2013/01/26/noaa-deception-over-2012-heatwave/
A differenced non-linear trend may still be non-linear. See the whole discussion on unit roots.
SteveF:
Are you sure you mean to refer to “most” of my comments? I’m sure you could find comments of mine which don’t show charity, but I can’t imagine it’d make up a substantial percentage. I’d be shocked to find out it’s greater than 50%. As in, shocked to the point of needing serious self-reflection. I’d probably agree with Mosher (effectively) calling me a liar if it were true
How many of the dozen or so comments I’ve made on this page do you think were uncharitable?
Victor Venema (Comment #109029)
I do not think you can detect the trend superimposed over the entire length of the series with a breakpoint algorithm. I think you need to do a regression over the entire difference series and then you have the problem that trends in difference series with nearest neighbors can occur “naturally”. I am willing to change my mind if you can show me a reference to details on how this is handled in a homogenization algorithm.
Zeke, could I suggest that in future you do not write blog posts when riled. This post was unworthy of you.
Brandon. I did not use the word liar. In fact i don’t think Ive ever seen you say anything that I would construe as a lie. I’ve seen misunderstandings. I’ve seen mistakes. I’ve seen differences in perception. You are fooling yourself if you think you practice charity.
here is a hint. every time you say X makes no sense, you are not practicing charity.
When you say you practice charity, and I say ‘right chewbacca” I do not mean you are lying. I mean that you don’t understand what it means ( philosophicaly ) to practice charity.
Now, you can say ” Oh, I thought you were accusing me of a lie” and then I say ‘No I was observing that you dont understand charity, practice charity, or perhaps you mis percieve yourself”
Finally, I’m not sure practicing charity is always a good thing. So, dont that a criticism.
Laura S,
I you read the post more carefully, you will notice that your objection had already been addressed.
.
Alex,
Sorry that you dislike it. However, the folks at NCDC are outstanding scientists and the stuff they have had to go through due to blog-driven misconceptions is regrettable.
Steven Mosher:
Of course you didn’t use the word liar. I never said you did. I said you effectively called me a liar. I said I try to do something. You said, “ya right chewbacca.” Ya right was used to indicate you disagree. If I say I try to do something and I don’t actually try to do it, I must be lying. The most you can say is:
I’m lying to myself. That still makes me a liar.
This is nonsense. The principle of charity requires us maximize the coherency/truth of what we read. That maximum may well be zero. In cases where it is, there is no lack of charity shown by saying the material makes no sense.
As a demonstration, people often use non-sequiturs to “prove” a point. One of the most common forms is represented as P→Q, Q∴P. That is, “P implies Q. Q is true therefore P is true.” Or for an easy example, “Chickens have feathers. This thing has feathers therefore it is a chicken.” There is no way to maximize the truth of that. The principle of charity is not violated by saying it makes no sense.
Every time I say something makes no sense, I explain why it makes no sense. As long as my explanation is correct, my conclusion must be correct as well. If it is, I am being perfectly charitable.
Seems like every where I look in climate blogdom, there is one certain individual who is always engaged in a interminible, pointless argument with somebody. The arguments are with people whose opinions are variously all over the spectrum; pro-anti-left-right-middle. If they say up, this guy says down and there is no meeting in the middle. No it isn’t Willis. I am pretty sure it isn’t me. Mosher doesn’t even come close. I ain’t going to mention any names, but everybody but the person I am talking about knows who it is. If you suspect that I am talking about you, please show your numerous arguments on various blogs in the recent past to a competent psychotherapist. I am just trying to help. And I am not going to argue about it.
(Hint; if this really makes you angry, it’s you.)
Zeke,
“Laura S,
I you read the post more carefully, you will notice that your objection had already been addressed.”
There is much talk of good faith on this thread. it would be even better if it were more generously applied. This issue of TLT has not at all been resolved. I remind you especially these posts # 108886 and # 108912.
Zeke, I understand and respect your reasons for writing. I just think it could have been a much better post had you taken time to cool down before writing it.
I will add to go in the direction of Laura S that, until proven otherwise, the tropospheric amplification is also expected over land at less than 60 ° of latitude. This effect is related to the change in the absolute humidity of the atmosphere and has no reason not to also appear on the continents albeit at a slightly lower rate.
One last point, the reference given by Zeke (http://rogerpielkejr.blogspot.ch/2009/08/exchange-with-gavin-schmidt-on.html) is about global values. It can not be used to argue on U.S. alone (env. 30° à 50° Lat N).
DeWitt Payne:
In the general mathematical case, certainly. In case of two neighbouring stations, you would expect that they experience about the same regional climate. The assumption is not perfect, if one station is next to a lake and the other on the top of a hill, also the long-term changes may be somewhat different. On the other hand, what you want to see in most studies is also the large-scale climatic changes. More subtile questions on the influence of local conditions may not be answerable.
.
Kenneth Fritsch:
Then do not call it a break point algorith, but a homogenization algorithm that in relative homogenization has as null hypothesis a constant difference time series with white noise. If there is a trend in the series, it is not white noise and the algorithm would start inserting breaks to make the difference series more constant.
I do not have a reference for you. Maybe you can have a look at the mathematical literature. I am sure they that have a proof somewhere that most of the natural numbers are not zero.
Well Zeke clearly you believe that no scientist would ever think of adjusting data to suit their agenda.
Beyond that no scientist would ever write to the holder and producer of such data and point out a problem and how great it would be if the data could be adjusted to make that problem go away.
I mean that would be unethical wouldn’t it. No credible scientist would ever write such a thing, just in case it became public and people might actually believe he was actually trying to influence the holder of such data.
“tux:mail> cat 1254108338.txt
From: Tom Wigley
To: Phil Jones
Subject: 1940s
Date: Sun, 27 Sep 2009 23:25:38 -0600
Cc: Ben Santer
Phil,
Here are some speculations on correcting SSTs to partly
explain the 1940s warming blip.
If you look at the attached plot you will see that the
land also shows the 1940s blip (as I’m sure you know).
So, if we could reduce the ocean blip by, say, 0.15 degC,
then this would be significant for the global mean — but
we’d still have to explain the land blip.
I’ve chosen 0.15 here deliberately. This still leaves an
ocean blip, and i think one needs to have some form of
ocean blip to explain the land blip (via either some common
forcing, or ocean forcing land, or vice versa, or all of
these). When you look at other blips, the land blips are
1.5 to 2 times (roughly) the ocean blips — higher sensitivity
plus thermal inertia effects. My 0.15 adjustment leaves things
consistent with this, so you can see where I am coming from.”
Yeah I can see where you are coming from Tom!
Can you Zeke?
Alan
Well Zeke clearly you believe that no scientist would ever think of adjusting data to suit their agenda.
Beyond that no scientist would ever write to the holder and producer of such data and point out a problem and how great it would be if the data could be adjusted to make that problem go away.
I mean that would be unethical wouldn’t it. No credible scientist would ever write such a thing, just in case it became public and people might actually believe he was trying to influence the holder of such data.
“tux:mail> cat 1254108338.txt
From: Tom Wigley
To: Phil Jones
Subject: 1940s
Date: Sun, 27 Sep 2009 23:25:38 -0600
Cc: Ben Santer
Phil,
Here are some speculations on correcting SSTs to partly
explain the 1940s warming blip.
If you look at the attached plot you will see that the
land also shows the 1940s blip (as I’m sure you know).
So, if we could reduce the ocean blip by, say, 0.15 degC,
then this would be significant for the global mean — but
we’d still have to explain the land blip.
I’ve chosen 0.15 here deliberately. This still leaves an
ocean blip, and i think one needs to have some form of
ocean blip to explain the land blip (via either some common
forcing, or ocean forcing land, or vice versa, or all of
these). When you look at other blips, the land blips are
1.5 to 2 times (roughly) the ocean blips — higher sensitivity
plus thermal inertia effects. My 0.15 adjustment leaves things
consistent with this, so you can see where I am coming from.”
Yeah I can see where you are coming from Tom!
Can you Zeke?
Alan
“Alan Millar (Comment #109070)
January 27th, 2013 at 9:37 am
Well Zeke clearly you believe that no scientist would ever think of adjusting data to suit their agenda.”
###########
clearly you are good at constructing a strawman argument.
This argument is not about zeke. Zeke is my friend. Anthony is my friend. Anthony crossed the line. plain and simple.
Alan,
Zeke is very creative. He should be able to think up an innocent interpretation of Wig’s conspiratorial email. More likely, he will ignore your question, or answer a question that you didn’t ask.
And I see that Mosher has chimed in. Hi, Steve. Did Anthony having a laugh over your embarrassing BEST-JGR-G&G fiasco sting a little bit? Is Zeke Anthony’s friend?
Brandon.
I believe you have outdone yourself. You are not lying when you say you practice charity. you do not practice it. You are mistaken when you say you practice it. The people who are suppose to recieve this charity have told you so. yet you persist. un fool yourself.
Telling you to un fool yourself is not saying you are lying. You are not lying. You truely believe things about yourself that are wrong. Others have told you this, but you wont listen. One of these is true
1. you dont understand charity
2. you dont see yourself as others see you.
I dont know how to make it any more clear to you. How is this. When i accuse you of lying you will know because i will call you a liar. And everybody else will know, and I will agree with you when you point it out. However for you to persist in construing my statement as meaning “brandon is a liar” when no one else thinks that and when I have told you that is not the meaning of my words.. kinda shows folks that maybe don is on to something
Phi,
If global land amplification is slightly less than 1, why would your default assumption be that the amplification specifically over the U.S. is greater than 1? While I don’t know what the specific amplification over the U.S. is expected to be (I’d have to ask, gasp, a climate modeler since this number usually comes from GCMs), I think my defense of a value of 1 is reasonable given the evidence presented so far. If you have information to the contrary, please share it.
.
Alan,
Again, it behooves us to assume good faith. The 1940s blip in ocean heating was always suspicious (especially at the time that email was written). They thought it was an anomaly in the data (say, due to the use of buckets). They even published a paper on it:
http://icoads.noaa.gov/Boulder/Boulder.Jones.pdf
SST data is a mess pre-1950s (especially around WW2). If there is a large anomaly relative to what you expect, it is worth investigating. Wigley wasn’t proposing arbitrarily decreasing the value by 0.15, but rather suggesting that there might be a bias of around 0.15 due to the divergence between land and ocean records at the time. To actually justify a correction one would need to identify a source of bias (e.g. buckets) and test its effect (e.g. compare ships who used the old and new method concurrently, or those see if other measurements like sea air temperature whose instrumentation didn’t change showed a similar perturbation or not).
Victor Venema (Comment #109060)
DeWitt, I did not know if your comment above was directed to my exchanges with Victor, but what we are discussing is a difference series determined by subtracting one series from another and not a first differencing of a given series.
Victor, what you were saying belies the very definition of a breakpoint which is an abrupt change in the series. A trend extending the length of a series does not produce an abrupt change.
If homogenization algorithms are finding and removing trends based on a trend running the entire length of a difference series, when I look for trends in difference series between a reference station and its nearest neighbors stations that have all been homogenized (adjusted), it should be a rare occurrence to find trends in these multiple difference series for a given reference series running in the same direction.
When doing this calculation for GHCN monthly adjusted series (for maximum, minimum and mean temperatures) with the longest series lengths, I found a large number of stations where multiple difference series with its nearest neighbors had significant trends and in the same direction.
Zeke (Comment #109050)
“Sorry that you dislike it. However, the folks at NCDC are outstanding scientists and the stuff they have had to go through due to blog-driven misconceptions is regrettable.”
Zeke, you have alluded to this problem before and it seems to me to be your major reason for producing this thread. Could you elaborate without getting into any organizational politics on this issue? It sounds like it is important and further I have selfish reasons for inquiring. I have had timely responses to my questions from GHCN people in the past, but a recent email has gone unacknowledged for almost a week. When you say individuals had to “go though stuff” that reads like they had to go through it because of some organizational reaction and/or some pressure from government officials and politicians.
It behooves us to assume good faith, except when we feel it is more appropriate to assume bad faith. For example, when someone makes an ambiguous allusion to jail.
Zeke, have you read Crutape Letters? You and Mosh should get together with some brandy and popcorn and read aloud to each other. The book is discounted on Amazon now for about 13 bucks, if I recall correctly.
Zeke,
If you read my comment more closely you’ll see that I asked you to acknowledge that it is not generally agreed that the trends should match. You claimed that trends should agree over land. So you have not done this.
So in the interest of fair debate, let’s see an acknowledgement from you that it is not generally accepted as true that the trends should match over land or water, although some claim as you cite that the former is true.
Don.
Zeke and I have talked about climategate on our drives over to berkeley. I would not disagree about anything he has said in his comments.
For me climategate was about SELECT individuals and I refuse to generalize to ‘all scientists’. Those individuals are Jones, Briffa and mann.
I find the wigly mail inconclusive for just the reasons zeke cites. What I aim at is trying to bring out the episodes that should be clear to folks on both sides.
Laura S.,
Climate models are used to assess expected warming differentials between surface and tropospheric temperatures. Indeed, models like NASA’s ModelE show about 25% more tropospheric warming than surface warming worldwide. However, as the link I provided in the post shows, these models show significant amplification over water (~40%), but no (or even slightly negative) amplification over land. As Gavin explained:
“Amplification factors (MSU/SAT) (linear reg./ann data/ 95%conf)
global ocean land
run_a 1.25+/-0.07 1.44+/-0.11 0.95+/-0.07
run_f 1.27+/-0.09 1.49+/-0.10 0.96+/-0.08
run_g 1.28+/-0.08 1.45+/-0.10 0.99+/-0.07
run_h 1.24+/-0.07 1.47+/-0.11 0.92+/-0.07
run_i 1.26+/-0.09 1.49+/-0.12 0.95+/-0.07
The global average amplification is indeed near 1.25, but the value over
ocean is significantly higher, and the value of land significantly less.
Indeed, there is no expected amplification at all!”
I’ve provided evidence from a reputable source that significant amplification of tropospheric temperatures is not expected to occur over land areas. The ball is now in your court to find evidence otherwise to continue the debate.
Kenneth
“Zeke, you have alluded to this problem before and it seems to me to be your major reason for producing this thread. Could you elaborate without getting into any organizational politics on this issue?”
I’ve hinted to you some of the problems that Anthony’s charges raise. That is all you need to know. NOAA is a professional organization ( Ive dealt with their FOIA department, superb!)
Imagine you are the boss of the guys that do adjustments.
Imagine you start getting calls from fox news.
Imagine fox news calls other departments in NOAA.
What would you do as the boss?
Now imagine your boss gets a call from congressman X.
what would you do?
Personally, if I were a guy working on adjustments I would stop answering your mails. Not cause your a bad guy. Its just a risk I would not take. Where is the upside in answering your mails?
if I mail you will it end up twisted by your blog friends, will you post it? can I trust you? Like zeke said.. its a cancer.
I too have to re evaluate the mails I answer for Berkely earth.
I have two now from people I dont know asking for help. Do I run background checks on these guys, it makes you leary of answering any questions when your words are used against you in uncharitable ways.
“And I see that Mosher has chimed in. Hi, Steve. Did Anthony having a laugh over your embarrassing BEST-JGR-G&G fiasco sting a little bit? Is Zeke Anthony’s friend?”
Sting? no. I’m pretty much immune to the reactions of others. Folks who wanted to use the data and need a ‘cite’ are happy. I’m happy.
If I worked to make skeptics happy, I would quit. But I work to make the lives of people who actually do science a bit easier. It’s not that hard to understand.
Is Zeke Anthony’s friend? probably not. in fact, i will say that some people had weird conspiritorial thoughts about zeke and I. Go figure.
Some people had the same weird conspiritorial thoughts about Nick stokes and me, you know we disagree on blogs and then we work together.. and god forbid we hung out together in Lisbon and were actually seen having breakfast at the same table!
Wanna hear the real shocker.. I would work with Mann. And hansen. And I would work with Anthony. Gimme a pile of data and I could care less about your politics, funding, angle, or whatever.
data pig.
Steven Mosher:
I gave a direct explanation for what I said. Logic dictates if my explanation is right, what I said is right. This means all you have to do to convince me is show my explanation is wrong. You didn’t even try. All you had to do to make me “listen” was address what I said. You chose not to. You chose to ignore what I said, and now you say I don’t “listen” to you.
If people want to convince me I’m uncharitable, it’d be easy to do. They could just give me examples. Nobody has. The only time I remember anyone even trying was when you claimed I am uncharitable “every time [I] say X makes no sense.” I promptly explained why that claim is false. You ignored my explanation.
It doesn’t matter how often an accusation is repeated. It doesn’t matter how many people level the accusation. If no evidence is provided for the accusation, the accusation shouldn’t be believed. If some evidence is provided but then discredited, the accusation shouldn’t be believed. It’s that simple.
If I’m as uncharitable as people say, I want to know. I’d consider it a serious failing on my part, both for the behavior and for my failure to recognize it. As such, I would spend as much time and effort as necessary to examine my behavior. Heck, I can even provide hundreds of my comments in a single file ready for examination. That should make it be easy to examine claims about my charity or lack thereof.
If things are going to just continue as they have, there’s no point in continuing. It’ll just waste everyone’s time and devalue this page. However, if someone wants to engage in an actual conversation about the topic, I’ll happily participate (here, or as I’m sure lucia would prefer, in private correspondence/another forum).
Kenneth, exactly, homogenization is more than just searching for breakpoints. In absolute homogenization that would be all you could do. In case of the surface network, we have option to homogenize relatively and then you use as null-hypothesis that the difference time series is white noise.
A trend over the full period is just a special case of a trend over a partial period. Thus method that are able to handle a partial trend can also handle a trend over the full period. That does not work the other way around.
Did you look at the annual or at the monthly GHCN data? The PHA algorithm only corrects the annual data. If there is thus an annual cycle in the inhomogeneity, which is common, you can still see inhomogeneities, including trends, in the monthly time series. If you see a clear trend in an annual difference time series, please contact NOAA. That would point to a bug.
Kenneth,
As I mentioned in the original post, NCDC has gone through two different major investigations, congressional hearings, and institutional pressure to respond to media furores like this Fox News thing. All of these distract from their ability to actually work on the science. One estimate I got is that about 30% of their time over the past two years was having to deal with this type of stuff. The real tragedy is that the vast majority of the folks involved are non-political, non-activist folks who before the blogs castigated their work were mostly laboring away in obscurity, and have been pulled into the public arena largely against their will.
Don Monfort (Comment #109052)
January 27th, 2013 at 1:16 am
” I ain’t going to mention any names, but everybody but the person I am talking about knows who it is. If you suspect that I am talking about you, please show your numerous arguments on various blogs in the recent past to a competent psychotherapist. I am just trying to help. And I am not going to argue about it.
(Hint; if this really makes you angry, it’s you.)”
Don, I guess you found me out. My psychotherapist says I have a guilt complex and now I have something to add to an already long list to discuss with her. Thanks much for the help and by the way I feel more guilty than angry. Should I be angry?
Zeke (Comment #109091)
Zeke, I think it would be more effective to provide details of what these people have gone through. Do you have links to hearings and investigations that have been made public? How much of this would be caused by overly senstive organizational management? Would future funding be involved. How much of the hearings and investigations had to do with ethical considerations of the scientists?
I would hope on the other side of the coin that the reaction is not to shut down legitimate discussion by way of blogs or emails or an excuse to do so. Or to say that the only way we will have a conversation is through published papers.
Kenneth Fritsch,
I’ll ask about some specific examples, though NOAA is finicky about letting folks speak publicly. I’m in no way suggesting that we shouldn’t have a legitimate discussion or avoid criticism of methods or approaches. Its when accusations of fraud start (e.g. manipulating the data) that you end up with onerous investigations. All I want is an assumption of good faith from all parties, until shown otherwise.
Zeke,
“If global land amplification is slightly less than 1, why would your default assumption be that the amplification specifically over the U.S. is greater than 1?”
For the physical and geographical grounds I have given. An increase of absolute humidity produce inevitably an amplification of the tropospheric warming. According to the models, this does not verify anymore at high latitudes for reasons of meridional circulation but this can not be invoked for the U.S. latitudes.
That said, I did not need the tropospheric amplification to demonstrate that your TLT argument in defense of adjustments is invalid. However, you can use it to defend US temperaures, but then you are forced to recognize that global temperatures are dramatically overestimated (http://img215.imageshack.us/img215/5149/plusuah.png). I remind you that I also showed that the boundary layer argument was not valid.
Brandon.
You provided your own example of being uncharitable when you think that I accuse you of being a liar. I corrected you about your interpretation of my comment.
Brandon: I’m charitable.
Mosher; ya right.
Brandon: Mosher accused me of lying.
Mosher: No brandon, you either dont understand charity or dont see yourself as others do. You believe that you are charitable, so you are not lying when you say that, you are just mistaken.
Brandon: You are accusing me of lying again.
Mosher: no, there is a difference between saying you are mistaken and saying you are lying.
##########
You see brandon, you show us all that you dont know how to practice charity as you try to claim to you.In fact, your defenses are the epitome of uncharitability. Which is ironic and funny.
Lets try it again.
Brandon; I practice charity.
Mosher: ya right.
Brandon: You think I dont?
Mosher: yes I think you dont.
Brandon: give me examples.
###
you see how thats different. As opposed to claiming that I called you a liar, you seek to understand what I meant. now why would you seek to understand what I meant
”
The other uses words in the ordinary way;
The other makes true statements;
The other makes valid arguments;
The other says something interesting.
”
So, can you see that I can disgree that you practice charity without implying you are a liar. A liar says X, when he knows that not X is the case. A mistaken person believes X, says X, but X is wrong. You are mistaken, not lying. the best example of you not practicing charity is your interpretation of my words as calling you a liar. Persisting in that, just illustrates my point and should provide you with the evidence you asked for.
Your best line now would be.
Oh, I took that to mean, you were calling me a liar. Sorry, i over reacted.
Kenneth,
There were two GAO investigations in the last two years. Here is one that was triggered by the whole station siting thing at the request of Inhofe: http://www.gao.gov/products/GAO-11-800
Kenneth,
I find your questioning of Zeke really weird. You’ve been told it impacts their work. do you doubt it? When the exact details are revealed to you will you quibble? will you stand up and write a blog post criticizing what Anthony said. Or is this just another time waster. Assume Zeke is speaking in good faith. Assume that he says something true and interesting.
Unfool thyself, Steven 🙂 You are not pretty much immune to the reactions of others. Take my word for it. I know about these things. If you were subjected to the right kind of interrogation, you would admit it, even to yourself. There are methods that would make our very stubbornly argumentative friend confess that he got some issues, and he would be the better for it.
You may not recall, but for a few years I have occasionally stated that you are one of a handful of people on these blogs that could be trusted to provide well-informed and honest opinions. I have given you much of the credit for educating me on the so-called climate science. But lately you seem to have slid from the higher ground, into the camp of the publicity seeking alarmists.
I am not shocked that you would work with anybody, who dropped a pile of data on you. That is one of the things I admire about you. Open mind facilitates discovery. But lately you seem to have lost some objectivity. I suspect it has something to do with your unpaid association with the BEST project. You have been taken into the tent and you seem to be identifying more with the consensus high sensitivity crowd than you used to. Stockholm syndrome. I could be wrong.
I don’t know Anthony, except from his blog. I don’t spend much time there, because I find most of the posts and comments overly biased, obviously wrong, or uninteresting. Anthony should not have made the comment about “jail”. But we could give him the benefit of the doubt and assume that he didn’t literally mean that the NCDC bureaucrats should be imprisoned; maybe just more closely scrutinized. Or we could, without trying to ascertain his intention or giving him the opportunity to recant, excoriate Anthony by exposing him as the sole example and poster boy for the growing cancer…blah…blah…blah. Do you think that your friend Anthony deserved that kind of trashing, Steven? Please don’t ask me the moon question, again.
Steven Mosher,
“I find the wigly mail inconclusive for just the reasons zeke cites.”
Inconclusive about scientific probity, perhaps. Certainly not inconclusive about the reliability of SST.
” Heck, I can even provide hundreds of my comments in a single file ready for examination.”
I wish I had thought to keep all my comments on file. I wouldn’t have thought it all that important, until my wife told me I need to see a therapist over my incessant arguing with strangers on the freaking internet. My wife is a therapist, but she won’t take me on because my insurance covers only 20% of her hourly. I refuse to pay her out of pocket. But if I had an immense file of all my arguments, I take it to therapist who would settle for insurance reimbursement.
Zeke (Comment #109098)
Thanks for that link.
The link discusses the issue of the quality of the USHCN station siting and it appears that the reply was that USHCN Stations were selected on the basis of several factors, but siting conditions played a limited role.
From this official document the oversight would appear to me to be legitimate and rather benign given the fact that subsequent papers (initiated by the concern with station quality) have shown the station quality considerations did not significantly affect the adjusted temperature measurements or at least for the period 1979-current.
Probably a lesson learned in that exercise is that, if an organization produces written quality standards, that organization should assure that the standards are measured/audited and adhered to or show that the standards are not meaningful and thus are changed.
”
There is no doubt in my mind that if one can make a case for adjusting data in a meaningful way it should be adjusted. That very need for adjustment admits to a significant uncertainty in the measurement and reporting of that data originally and of course that in turn puts the onus on the adjuster to show that his methods have made improvements.”
Indeed. Anyone using the adjusted data should be adding the adjustments so made to the measurement uncertainty too, since most (all?) of these adjustments are calculated from averages – the individual stations are NOT adjusted with an individual adjustment calculated from a known-good measurement system, but are estimated from the bulk properties of the data and meta-data. For any particular site, they could be too little, too much, or even the opposite of what is required.
It is also apparent that such adjustments should NOT be dynamic and dependent upon latter temperature measurements – what and how temperature is measured today does not affect any artifacts introduced by yesterday’s method!
Yet I can’t help pointing out out that both of the above appear to be ignored – measurement error is NOT increased and dynamic systems ARE in place.
I would personally put this down to ignorance and sloth rather than nefarious reasons – Anthony clearly feels the reasons are nefarious. He may be right, I cannot say. Given that this has been pointed out before, it becomes harder to accept the ignorance and sloth excuse with every passing day. At some point, one reaches the conclusion that it must be fraud. It may be that Anthony’s previous dealings with these people pre-disposes him to think the worst of them – this would hardly be surprising given the history.
Some people can find UHI ….
“Heat rising up from cities such as New York, Paris and Tokyo might be remotely warming up winters far away in some rural parts of Alaska, Canada, and Siberia, a surprising study theorizes.”
“The computer model showed that parts of Siberia and northwestern Canada may get, on average, an extra 1.4 degrees to 1.8 degrees Fahrenheit (0.8 to 1 degree Celsius) during the winter, which “may not be a bad thing,” Zhang said.”
http://www.theprovince.com/touch/story.html?id=7879494
Unfool thyself, Steven 🙂 You are not pretty much immune to the reactions of others. Take my word for it. I know about these things.
Sorry, you feel that way Don.
Don.
“But we could give him the benefit of the doubt and assume that he didn’t literally mean that the NCDC bureaucrats should be imprisoned; maybe just more closely scrutinized. Or we could, without trying to ascertain his intention or giving him the opportunity to recant, excoriate Anthony by exposing him as the sole example and poster boy for the growing cancer…blah…blah…blah. Do you think that your friend Anthony deserved that kind of trashing, Steven? Please don’t ask me the moon question, again.”
I don’t think that anthony literally meant they should go to jail. He drew an unfortunate analogy and doesnt realize the real world consequences of his analogy. You can see that some people thought he was being literal ( his readers ) and you can understand how people in NOAA would have to take pre cautionary measures. As for trying to ascertain his intention, that would be hard. The facts are what he said, regardless of his intention, is easily seen as a claim that NOAA engage in activity that is “jail worthy” Nothing prevents him from saying
” I didnt mean their actions were criminal” instead, he said ” I never used the word fraud” Note he did not say ” I never used the word fraud, and I dont want you to think I MEANT it was fraud”
I do not think zeke said anthony was the sole example. he used him as an example. There are other examples of the cancer. More examples on the AGW side. And Excoriate is probably a bit strong.
Do I think anthony deserved the trashing? have you stopped beating your wife?
I think I have said more critical things about Anthony than Zeke has. With friends like me you don’t need enemies, or so I have been told. Let me put it another way. I trust that Zeke, for example, would feel utterly free as my friend to call me out publically if need be. I would expect nothing less of him.That would not change my opinion of him one bit. Like everyone he gets to think what he thinks. Put another way, what people think about me is none of my business.
“It may be that Anthony’s previous dealings with these people pre-disposes him to think the worst of them – this would hardly be surprising given the history.”
you need to talk to Don who assures us that Anthony did not mean what he said in the literal sense of the word. he didnt mean that they had committed fraud, didnt imply anything close to be criminal. he just meant they should be looked at more closely, which is weird, because they already are being closely watched by skeptics.
Kneel:
That is fully right. Just to be sure: that uncertainty would be smaller than the size of the jump. And you should also take into account the uncertainty due to the inhomogeneities you did not find and the uncertainty in the data of the break, etc. (I did not read the BEST paper yet, but if I see the small uncertainty range, I am wondering whether BEST took all errors into account. Maybe the co-authors here could tell a little about this? I would be especially interested in the question, whether it is assumed that the inhomogeneities are on average zero.)
Kneel:
I do not agree with this part. As you gather more data you may be able to find new inhomogeneities at the end of your time series, which previously were not statistically significant. For example, if there was a break in 2008 in station x, it is well possible that 2 years ago this jump was not statistically significant yet, but now it is.
Furthermore, more and more data is being digitised. As the amount of available data is increasing, the correlations between the stations is increasing. This allows us to detect and correct more inhomogeneities (more accurately). Also for this reason, estimates of past temperatures can change.
Now if we found a break in 2008 of 1 degree upward, it is fully arbitrary whether we adjust the new data 1 degree down, or the data before 2008 one degree up. For the computed trends, or for statements on the difference of the temperatures in two years this does not matter.
Normally, homogenization is only performed once every few years. Then it is a good convention to assume that the last homogeneous subperiod has no bias and to correct the old data. That way you can add new data, without having to change the data. Peter Thorne explains this in more detail on the blog of the ISTI. Actually, at NOAA they would not need this convention, as their automatic homogenization method is run every night. But even in that case, old data may change as the capabilities to find inhomogeneities improves.
P.S. Kenneth, my reply to your comment has now appeared above, it was stuck in the spam filter.
Victor Venema (Comment #109090)
When you say the following, Victor, I think I am losing you here.
“Kenneth, exactly, homogenization is more than just searching for breakpoints. In absolute homogenization that would be all you could do. In case of the surface network, we have option to homogenize relatively and then you use as null-hypothesis that the difference time series is white noise.”
You have not explained how using a difference series (which is what I do) changes anything in our discussion. You refer to white noise in the difference series when in fact if you model it you will find it has red noise. My example was modeled by Arima(0,0,1). I well know that the adjusted differences series are not white noise without any trends.
“A trend over the full period is just a special case of a trend over a partial period. Thus method that are able to handle a partial trend can also handle a trend over the full period. That does not work the other way around.”
You keep saying this but you are not clear about how a trend over the entire period is detected. I say by definition it is not detected by any change point method. You can after the change points are found do a linear regression against time over the entire difference series. You will find trends as I noted above, but you have to show that these trends are related to non climate changes.
“Did you look at the annual or at the monthly GHCN data? The PHA algorithm only corrects the annual data. If there is thus an annual cycle in the inhomogeneity, which is common, you can still see inhomogeneities, including trends, in the monthly time series. If you see a clear trend in an annual difference time series, please contact NOAA. That would point to a bug.”
I looked at the monthly GHCN series as noted above and the GHCN algorithm corrects the monthly data. Any way the trends I see would be apparent in the annual data. This last statement you made is a major disconnect for me and I will go back to the GHCN algorithm and post what they do with regards to corrections
Look Steven, the real world consequences of Anthony’s analogy are virtually nil. A few of the usual suspects screamed at him for being a cancer growing on blah blah blah. Hypocrites. If Zeke were really suffering from outrage about the cancer, he didn’t need to wait for Anthony’s analogy to hyperventilate over it. And when he did make his grandstanding play to expose the cancer, he could only think of Anthony to lay the blame on. It’s BS. And I haven’t been beating my wife, and I know we landed on the moon. You people can’t man up and answer a simple direct question. Now I will turn you back over to Brandon.
What we have here are a bunch of thinly developed one-dimensional characters in the climate science comic soap opera. I am used to dealing with people who are more serious and substantive, the good and the bad.
Don Monfort entertains me:
The hostility of this is entertaining on its own, but the best part is this gives me a reason to talk about a project of mine. I’ve always thought it interesting the internet stores a great deal of information that most people will never see because of the effort needed to find it. Specifically, I’ve made a fairly large number of comments on the internet. What would happen if someone decided to research me and find all those old comments? What would they find?
Partially to examine this, and partially because of discussions with lucia, I decided to find out. I wrote a program to scrape sites and pull down comments. It’s pretty simple, but it works for (just about) any blog that uses WordPress. That means I can collect almost all of my climate related comments. It’s pretty cool to see things I discussed or examined years ago but haven’t thought about since. It also pretty cool to be able to find old references at a moment’s notice.
And while I hadn’t considered it before, I guess it’s pretty good for when people accuse you of things. I mean, look at all that hostility and mockery based on Don Monfort being foolish. And remember, this is from the guy who not long ago directed this comment at me:
Having someone call me angry while they’re hostile and I’m just amused is… amusing.
Steven Mosher shows the fruitlessness of responding to him. There is simply no charitable way to interpret a comment like:
He “corrected” me then promptly ignored my response to the “correction.” He then repeated the disputed claim as though I had never responded. There’s no way he could have missed my response to this point if he had read my comments so why would he do this? What charity could I possibly show here? Do I assume he didn’t read his comments? Do I assume he intentionally misrepresented things? Do I assume he can’t read?
I don’t think there’s any value in pursuing this, but if someone wants to convince me I’m uncharitable, this would be the perfect moment. Show a way in which Mosher is being reasonable, and you’ll convince me I’ve misjudged myself.
Victor Venema (Comment #109111)
Victor, use the links below to understand how GHCN uses monthly data to determine breaks and adjust for those breaks. If it is not sufficiently clear look under high resolution at the difference plots of GHCN data between Adjusted and Unadjusted series and you will see that these adjustments do not correspond to years but rather months.
http://www1.ncdc.noaa.gov/pub/data/ghcn/v3/techreports/Technical%20Report%20NCDC%20No12-02-3.2.0-29Aug12.pdf
“In version 3 of the GHCN-M temperature data, the apparent impacts of documented and undocumented inhomogeneities are detected and corrected through automated pairwise comparisons of mean monthly temperature series as detailed in Menne and Williams[2009].”
http://journals.ametsoc.org/doi/pdf/10.1175/2008JCLI2263.1
Brandon it is pretty simple.
Nobody can convince you that you are un charitable.
That is why you are uncharitable.
You could have said: Oh Mosh, you mean that I dont understand charitability? And I would say yes. That way, we move beyond your claim that I called you a liar.
Most people see that. they say, “oh the real dispute is brandon’s understanding of charity and moshers understanding of charity”
But because you focus on your un charitable interpretation, the conversation goes no where. Which means of course, you havent been charitable.
Specifically, as willard has pointed out to you, your prefferred response to somebody is to say
You make no sense. for reasonss x y and z
The principle of charity says we should default to a position where we try to make sense of what others say. NOT where we detail how it doesnt make sense.
Your approach. it makes no sense for reason x y and z.
Charity: I understand you to mean this, is that accurate?
One approach maximizes disagreement. the other seeks agreement or clarification of positions.
Brandon: Im charitable.
Mosh: ya right.
Brandon: are you calling me a liar?
Mosh; no I am saying you dont understand charity.
Brandon: oh what do you mean by charity?
Now earlier Don mentioned somebody who categorically maximizes disagreement where ever they go.
We all use that tactic now and again. But he alluded that one person in particular had that as an exclusive style.
Folks who practice different styles ( charitable, hostile, ditto head) recognize that they use different styles. Folks who have one style typicially dont percieve themselves as others do. And they get defensive about it.
When you encounter this person, give him a hug.
Mosher,
“Folks who have one style typicially dont percieve themselves as others do.”
Yup, that is THE issue. Someone who maximizes disagreement at every opportunity can only imagine themselves to be looking for common ground if they have a very poor understanding of their own behavior. Most people are not very good at perceiving themselves as others do; the best rule of thumb is to listen to how others describe you. In any case, constantly emphasizing whatever detail you happen to disagree with is NOT charitable.
Mosh:
He’ll have no idea why you did it.
J ferguson,
Off topic: is the Arcadian back on her mooring, or still under repair?
I only read down to the part where you talked about me being hostile, Brandon. That is how I read your posts. I quit, as soon as I see you going off the deep end. And I am not being genuinely hostile to any characters on blogs. You are not a threat to me. I reserve real hostility for dealing with real threats. I find you sadly amusing, and I am kind of shamed by that. I am telling you that you need to check yourself and lighten up, for your own good.
You are a smart, seemingly decent guy and you say some interesting and useful things, but you f’ it up by being pathologically defensive and ridiculously argumentative. There is a saying I heard in my travels about rubbing out with your elbow the good you have done with your hand. I think I heard it in Spanish, or whatever. Maybe you will get that, if it hasn’t lost something in the translation. Here is one in Jamaican English: Monkey climb too high, show him tail.
Your offer to provide hundreds of Brandon comments from your archives to prove some silly point, is a dead giveaway that you are taking yourself way too seriously. Take those comments and show them to a therapist. Let a licensed expert give you a professional, unbiased opinion.
I will be looking forward to reading some good stuff from you, Brandon.
Has anyone applied the current PHA to data from the USCRN to see how often it produces corrections in data that shouldn’t need any corrections?
Zeke wrote: (Comment #109080)
“Again, it behooves us to assume good faith. The 1940s blip in ocean heating was always suspicious (especially at the time that email was written). They thought it was an anomaly in the data (say, due to the use of buckets). They even published a paper on it:
http://icoads.noaa.gov/Boulder/Boulder.Jones.pdf
SST data is a mess pre-1950s (especially around WW2). If there is a large anomaly relative to what you expect, it is worth investigating. Wigley wasn’t proposing arbitrarily decreasing the value by 0.15, but rather suggesting that there might be a bias of around 0.15 due to the divergence between land and ocean records at the time. To actually justify a correction one would need to identify a source of bias (e.g. buckets) and test its effect (e.g. compare ships who used the old and new method concurrently, or those see if other measurements like sea air temperature whose instrumentation didn’t change showed a similar perturbation or not).”
Zeke, you are completely right. To justify a correction, one needs to run side-by-side experiments comparing different sampling methods. So why haven’t even exploratory experiments been reported? Is there a tendency for climate scientists to address such problems by computation (where subjective choices may be possible) rather than by experiment?
Frank, in the European validation study, we also computed the false alarm rate of the PHA, it is extremely low. It actually fell of the scale and was given as 0.00 (Table 9).
As in any statistical method you have to make a compromise between the probability of false alarms and your ability to detect that something is happening. I would expect that the easiest way to improve the PHA would be to allow for a much higher probability of false detection and therewith also allow the algorithm to find and correct much more inhomogeneities.
I do understand why they do so, with all the political pressure from climate “sceptics” you want to avoid someone saying that the the algorithm inserted a break and the people living near the station saying that nothing happened in that year. Then the cry: FRAUD would start again.
The USCRN is probably still too short to be able to make a sensible estimate of the false alarm rate. I am also not sure whether you can a-priory say of any station that it is homogeneous, not even of the USCRN stations. In that respect, I would have preferred, if those stations would have been founded in small groups of at least 3 stations, then you would have been able to check for inhomogeneities. The price would have been a worse coverage and a higher noise error in the yearly mean estimate of the US temperature, but on the long run that would average out and that is the main time scale of interest for these stations.
.
I am no expert for ocean measurements, but for the surface network there are hundreds such studies. And also there “sceptics” doubt that such studies have not been done, only because they don’t know about them. Thus my question to you would be: did you search for such studies, or do you just claim that they do not exist out of the blue?
Böhm, R., P.D. Jones, J. Hiebl, D. Frank, M. Brunetti,· M. Maugeri. The early instrumental warm-bias: a solution for long central European temperature series 1760–2007. Climatic Change, 101, pp. 41–67, doi: 10.1007/s10584-009-9649-4, 2010.
Brunet, M. Asin, J. Sigró, J. Bañón, M. GarcÃa, F. Aguilar, E. Palenzuela, J.E. Peterson, TC. Jones, PD. 2011. The minimisation of the “screen bias†from ancient Western Mediterranean air temperature records: an exploratory statistical analysis. Int. J. Climatol., 31: 1879-1895 DOI: 10.1002/joc.2192.
You will find many more older references on different weather shelters and their influence on the mean temperature in:
Parker, D.E. Effects of changing exposure of thermometers at land stations. Int. J. Climatol., 14, pp. 1–31, 1994.
From a time before man-made climate change:
Margary, I.D., 1924. A comparison of forty years’ observations of maximum and minimum temperatures as recorded in both screens at Camden Square, London. Q.J.R. Meteorol. Soc., 50:209-226 and 363.
Marriott, W., 1879. Thermometer exposure — wall versus Stevenson screens. QJ.R. Meteorol. Soc., 5:217-221.
Or from a reliable Dutchman:
Brandsma, Theo. Parallel air temperature measurements at the KNMI-terrain in De Bilt (the Netherlands) May 2003-April 2005, Interim report, 2004. http://wap.knmi.nl/onderzk/klimscen/papers/Hisklim7.pdf
Van der Meulen, J.P. and T. Brandsma. Thermometer screen intercomparison in De Bilt (The Netherlands), Part I: Understanding the weather-dependent temperature differences) Int. J. Climatol, 28, pp. 371-387, doi: 10.1002/joc.1531, 2008.
Or from a reliable Norwegian guy:
Nordli, P. Ø. et al. The effect of radiation screens on Nordic time series of mean temperature. International Journal of Climatology 17(15), doi: 10.1002/(SICI)1097-0088(199712)17:153.0.CO;2-D, pp. 1667-1681, 1997.
Kenneth, I do not understand why, but there does not seem to be away to agree on how homogenization works in case of a trend. I give up.
I agree that in the description of the article it is only mentioned implicitly that the corrections do not have a seasonal cycle, but in the conclusions of the article you can find that this is the case. Otherwise, they did not have to write that they would like to add this in future:
Don Monfort:
First off, nobody cares what you do with your “real hostility.” Your comment had a hostile tone, I pointed it out, and that’s it. Second, your portrayal of me is amusing. I remember eight or so months ago you asked what happened to me, why I had changed. You said you liked me before but blah, blah, blah. I’d link to the comment but it got deleted for breaking the rules of the site (my comment after yours is here. As I explained then, my behavior hasn’t changed. The only thing is you stopped liking it.
If my supposed hostility were the problem you have with me, you would have had that problem with me all along. You didn’t. You were fine with me apparently until I said things you didn’t like. Then you decided something “had happened” to me.
Right… I offered to prove what people said about me is false. That’s wrong. Them saying those false things was fine though. In fact, saying false things while refusing any examination of them is fine. But I’m “taking [my]self way too seriously” because I decided to demonstrate a point by making a reasonable offer I knew nobody would accept. In case my sarcasm isn’t clear, I don’t think making an offer to examine people’s criticisms of me is a bad thing. If any of them were willing to do the same, we might actually resolve things.
Of course, close-minded lack of charity is exactly what you’d expect from people accusing others of a lack of charity. /sarc
SteveF:
First you say most of my comments are uncharitable. Now you say I maximize disagreement at every opportunity. Both of these claims are so bold they are easily tested. Am I to assume you’re going to refrain from attempting with your latest like you did with the former? If so, that seems like leveling accusations against someone while refusing to consider any defense they may have to offer. Not only is that rude, it is basically the very behavior you accuse me of.
I don’t get these sort of responses. It’s like how Steven Mosher just said:
I’ve suggested multiple ways to convince me I’m wrong. I’ve made multiple offers to examine my behavior. I’ve discussed every example provided of my behavior. I’ve explained why bold claims about how charity works were false on their face. In every case, I was ignored.
Why am I uncharitable? Because nobody can convince me I’m uncharitable by ignoring what I say and avoiding any attempt to examine their belief…
Victor Venema (Comment #109135)
“Kenneth, I do not understand why, but there does not seem to be away to agree on how homogenization works in case of a trend. I give up.”
Me too. If you cannot explain the breaks that you will see in the GHCN monthly Adjusted-Unadjusted difference series ending and starting not on years but months nor show me where the homogenization algorithm can handle a trend the length of the difference series, we are then obviously getting no where in this discussion.
I appreciate the discussion we have had and your informing me of homogenization algorithms that are available in R. I suspect with your busy schedule finding the references I requested could be a time consuming process. I know my search for an explicit explanation of the handling of a trend in the difference series has to this point come up empty.
While my questioning may seem pedantic, it is motivated by my earlier comments about devising a benchmarking test that would cause large errors in a homogenization algorithm finding the truth and then determining/estimating how realistic are the synthetically placed non climatic changes placed in simulated temperature series. I think the poster presented by Zeke Hausfather at this blog and coauthored by Matthew Menne shows that artificially adding many small changes in a simulated series puts the homogenization algorithm result much further from the truth and closer to the raw data result. That result goes along with my understanding of the weaknesses (inherent?) in a breakpoint function handling a trend that runs the entire length of a difference series and that can be produced by placing many undetectable breaks and/or trends that are for the most part in one direction and run the length of the series.
I have many options in determining how well my thinking on this issue fits with what a homogenization algorithm can handle and with regards to this specific problem. I never, however, pass up an opportunity to pick someone’s brains at these blogs on issues like this one. You can learn as much from the unanswered questions as those answered ones.
Victor, while you admit that there are limits to what a homogenizing algorithm can detect it appears to me that you are willing only to concede that those limits would produce small errors in temperature adjustments. I am not so sure this is the case if you give the liberty to present the alogorithm with some worst case (for algorithm detection that is) scenarios.
Kenneth, sometimes you answer a question the moment you are able to formulate it in the right way.
Just as Zeke Hausfather and Steven Mosher, I am mainly doing this as a hobby. I thus know a little about homogenization, but have hardly looked at the data. Thus I can say that homogenization of temperature data improves the homogeneity. And that the suggestion of “sceptics” that (a large part) of the trend is due to unwarranted homogenization is wrong. I have not studied what that means for the errors in the temperature data. Thus I would be surprised if I had written somewhere in this long threat that these errors are small.
Especially, in cases where there are not many stations, the quality of the homogenized data is probably not much better as the raw data.
.
If you want to learn how an algorithm works, it can be interesting to give it a worst case scenario. In that case, a good algorithm should at least not make the data worse.
However, if you want an honest estimate of the error in real climate data, you should give the homogenization algorithm a realistic scenario.
Victor Venema (Comment #109140)
“If you want to learn how an algorithm works, it can be interesting to give it a worst case scenario. In that case, a good algorithm should at least not make the data worse.
However, if you want an honest estimate of the error in real climate data, you should give the homogenization algorithm a realistic scenario.”
Victor, I think your concern for “skeptics” reactions to these tests may be flavoring a bit too much your replies here. Benchmarking tests are a great idea and, yes, the results of those test currently available show that most algorithms do a reasonably good job of discovering the truth. Obviously to move forward we need to devise improved tests. The question then becomes one of when you devise a test based exclusively on potential errors already understood reasonably well you have a somewhat circular proposition. We need to think real hard on what non climate changes could enter the picture and cause large errors in estimating the truth.
SteveF,
way o/t, Arcadian back on mooring, Genset has 50 hours so far and running fine. Whew!
Victor Venema,
“Thus I can say that homogenization of temperature data improves the homogeneity.”
“And that the suggestion of “sceptics†that (a large part) of the trend is due to unwarranted homogenization is wrong.”
These are two very different points. Homogenized series are … more homogeneous. This is happy. The result is homogeneous but that does not mean that it improves the trends which are the most important for climatology.
When an operator moves an instrument to get away from increasing urbanization, he introduces an inhomogeneity but simultaneously he improves the quality of the records in terms of trends. Station moves allow to maintain a vague relationship with regional temperature at the price of repeated inhomogeneities. The suppression of these inhomogeneities deteriorates the regional representativeness of the data.
You can definitely remove the quotes at skeptics.
SteveF.
I think one of the most instructive examples when when Zeke tried to detail what the common ground was. In an exercise like that I watch for the people who fight the very notion of the exercise.
It’s amazing that Victor can make such confident statements about homogenization, when by his own admission he’s hardly looked at the data.
You only need to take a simple look at the data to see that the adjustments are wrong. This has done repeatedly in very clear posts by various people, particularly Paul Homewood (see link above from Bruce, #109030). This has largely been ignored by the NCDC and their apologists. I wrote to GHCN a year ago about these errors, and have had no reply except for “stay tuned for further updates”. Given this situation, it is hardly surprising that some people get annoyed and start using language like ‘manipulation’ and ‘deception’.
Kenneth, I did chose the term “realistic scenario” on purpose and did not write “a scenario based on our current understanding”.
I will certainly keep on trying to better understand the (statistical) properties of inhomogeneities in the climate record. Actually, I am just working on a database with parallel measurements to make it easier to study the impact of non-climatic changes (which is especially important when it comes to distortions in the distribution of daily data).
We have also, in our European validation study HOME, compared the statistical properties of the *detected* inhomogeneities in the benchmark data and in a number of read datasets homogenized with the same algorithms. The statistical properties of the detected inhomogeneities (number, size, seasonal cycle) was very similar; see Section 6.3.2. This does not preclude more subtle differences between real and benchmarking data (for instance auto- and cross-correlations) and it may also be different for different regions, but it does show that our understanding likely is not too much off
Inserting many small inhomogeneities is not a realistic scenario. We would have notice a difference in the statistical properties of the detected inhomogeneities. Maybe the homogenization algorithms would not have found them all, and the errors in the homogenized data would have been larger, but the algorithms would have found more and smaller inhomogeneities and we would have seen a difference in the inhomogeneities found in our benchmark data and the real data.
If you have ideas for difficult cases, especially if they are also realistic, do let me know. We are currently building a new global benchmark for the ISTI, which will be launched this year, thus we could include it. And also if you have ideas later, just write me, there will likely be new initiatives later on.
In the ISTI we wanted to produce some realistic datasets and some extra difficult ones. I can try to have them include a scenario with a local trend over the entire length of the time series, but the number of scenarios is limited and they may not see this as especially interesting. Let’s see.
jferguson, outstanding!
Paul Matthews, it might be more amazing that you complain about homogenization and then provide a link to a study about the number of days about 100 degrees. Because the USHCN daily data is NOT homogenized.
If it were homogenized, someone should have explained you the difference between homogenization (the process) and homogenized data (the results).
I just scanned the post at that link. Is the argumentation really that the record in the number of days above 100 degrees for all of the USA is wrong because they found one station where it was not the case?
Victor, in 2012 paper which you reference above, it says that a realistic temperature correlation structure was was used to construct the artificial data sets used for testing the methodolgy.
Does this imply that the variances of the detrended and deseasonalised monthly anomalies were assumed to be (approximately) equal from month to month in that data set?
RomanM, I used the surrogate data approach; it would have been easy to give every month its own distribution (and thus variance). Thus I had to look into the code. It looks like I did not use this option and that every month has about the same variance.
As there is also just one autocorrelation function (power spectrum) for every station, the variance from month to month will also not have a seasonal cycle.
Do you think there is a seasonal cycle in the variance from month to month? Would this be due to a seasonal cycle in the variance or because the autocorrelations change as a function of season? I would be very surprised it this made a difference for homogenization, but stochastic simulation is one of my main topics and this would be an interesting structure to generate and with the surrogate data method it is probably not too hard to do so.
If you have a pointer to the literature describing this effect, I would be very grateful.
Brandon 109137,
OK, look at Lucia’s reply to some of your earlier comments. (lucia Comment #108928). Lucia, who seems to me to be most often charitable in her comments, tried to point out that your interpretation of Zeke and Mosher’s comments was unnecessarily negative (that is, uncharitable) and almost certainly inaccurate. You ignored and/or rejected the thrust of her comments, which, I must admit, I do not find surprising.
.
After a while, most people grow tired of interacting with those who are consistently not looking for common ground, are unnecessarily negative, and yes, uncharitable. These are people who most try to avoid. You may imagine yourself none of those things, but based on my reading of your comments (both here and elsewhere) it appears to me that you are. Whatever other faults they may have, neither Zeke nor Mosher are consistently uncharitable in their comments.
No, I don’t have any references because I did not look for any. However, I can give you some visual examples of this unequal variability property.
For a while now, I have been studying daily station series and it seems quite clear that winter temperatures are more variable than summer ones and that this effect is very strongly accentuated as one moves toward the poles. Recently BEST published their newly minted temperature series and at their web page, they produced a gridded equal-area cell construction of 5498 monthly land temperature series.
I took a time-truncated subset of all of these series starting in February, 1956 (the date was chosen because it was the earliest date from which all of the cells had values for each month) and continuing to the most recent values. For each series, the standard deviation of the temperature was calculated separately for each month.
The first pair of plots gives a plot of the SD by latitude for the months of February and August. The red lines are references for the tropics.
The second pair is a plot versus longitude with point from the northern and southern hemisphere indicated by color.
Admittedly, I have not detrended the anomalies first, but the climate variation for a cell should not be large enough to create such large differences in the SDs between months.
Unequal variability would create a fairly substantial stumbling block for finding changepoints in series.
I posted a comment, but it appears to be moderated.
A temporary copy may be found here:
http://statpad.wordpress.com/2013/01/28/594/
Victor
Have you studied the issue with GHCN adjustments to the Icelandic temperature record detailed here (http://tinyurl.com/axzlwk6) and here (http://tinyurl.com/bdjfq7g).
If you had you would realise that GHCN’s algorithms have incorrectly identified an actual abrupt climate shift with station location/calibration issues and as a result made unjustified changes to historical data which increases the warming trend. Confirmation of GHCN’s error is in the public domain and confirmed by Icelandic meteorologists. As far as I’m aware GHCN have not provided any explanation which can justify these changes, in fact GHCN haven’t even acknowledged their scientific colleagues complaints!
Of course, one clear case of measured temperature data being inappropriately adjusted by programmers sitting in an office 6,000 miles from the data capture site is not evidence of systematic bias. But it at least represents a warning flag that should result in further examination of similar artificially introduced breakpoints and it certainly does not support your ‘certainty’!
SteveF:
I’m not sure “the thrust” of lucia’s comment dealt with my interpretations. The main thrust of the comment seemed to me that Anthony’s behavior was bad and Zeke’s behavior was better. I didn’t ignore or reject that as I explicitly agreed with it.
When it came to the matter of interpretations, there were two issues. On the first, lucia said she wasn’t sure which thing I was referring to when I said Zeke’s comment created the impression he was “engaging in equitable behavior.” She then explained why she felt the behavior was different. I responded by explaining the behavior is equitable because it has the same effect, and things can be different but equitable. In other words, I agreed with her point that the behaviors were different. I merely showed that doesn’t contradict what I said.
For the second issue, I didn’t ignore anything, but I did reject one thing. I rejected lucia’s claim that “Zeke and Mosher are just saying that criticisms that amount to suggestions someone should be sent to jail for their research should be discouraged.” I rejected this because she didn’t explain how one could interpret the things I’d read that way. For example, how could I possibly take that interpretation from Zeke’s remark:
That says nothing about criticisms limited to discussions of jailing people. It dictates a single type of response as the “proper” response. lucia seemed to agree with me about that remark. In fact, Zeke seemed to agree that remark was wrong too. Both of them agreed with the point I was making while neither said a word indicating my interpretation was wrong. That seemed like agreeing with my interpretation, an interpretation at odds with lucia’s later interpretation.
Based on that, I rejected lucia’s interpretation in regard to Zeke. In regard to Mosher, I rejected it because when I said it isn’t scientific to limit criticisms to people who have provided better methods, he said that “is the way science works” (multiple times). That’s clearly more than just saying comments like Anthony’s should be discouraged. As such, I rejected the idea Mosher’s comments were as limited as lucia said.
I largely agreed with lucia. I didn’t ignore anything she said, and the only thing I rejected, I rejected because I seemed untrue to me. How do you justify saying I “ignored and/or rejected the thrust of her comments”? It seems to me the only thing I didn’t accept was something that was obviously untrue.
Roman (109157),
The high variability for winter months (as you show clearly in the comment at your blog), especially in the high latitude Northern hemisphere, is a recognized issue. While that high variability could potentially make accurately finding break points for individual station histories more difficult, I note the following:
.
1) The variability is mostly very short term (usually on the order of 2 months or less), and so would not likely show up as a break point unless the the detection algorithm was based on very short term changes, rather than longer lasting (~1 year) step changes.
.
2) Regional correlation for the variability for near-by stations is probably reasonably high, so if the break point detection is based on deviation from near-neighbors, then it seems much of the short term variability will be discounted.
.
Of course, I do not know enough about the detection algorithms to be sure. Perhaps Zeke, Mosher, or Victor could comment on that.
RomanM, interesting observation. Do you know if that effect is mitigated or made worse when using a data set that includes oceans? I think it’d be interesting to see what effect the uneven distribution of water has on what you found.
SteveF:
From what I recall of looking at the process, I think it’s unlikely the increased variation would cause (many) additional breakpoints to be found. I’m less certain about how many it would obscure though. It’d be interesting to compare how many breakpoints are found per series in different parts of the globe.
RomanM, those figures look impressive, the differences in variance between summer and winter near the poles is very large. Interesting. Especially for Weather Generators used for downscaling from GCMs down to station time series. If it is “just”, it should be easy to mimic this with surrogate data.
Because you looked at daily gridded data, it may be different for station data.
I am not sure about your last conjecture, that it may be important for homogenization. Most, if not all, homogenization algorithm work either on yearly scale or homogenize all 12 month separately and then then combine the results.
Thus you work with a time series with all January values, all February values, etc. They say that this is is done because the difference time series can have a strong annual cycle as the spatial correlations (the cross-correlations between the stations) change (maybe some had also already seen your effect, but did not tell me). Thus the assumption of a constant mean and variance is not violated by the effect you show.
Brandon (Comment #109160),
I tried.
.
I did pretty much expect the kind of answer you gave. You can, and probably will, continue to tangle/argue/disagree with Mosher, Don, Zeke, me, and a host of others, at least until they tire of dealing with you; the prudent will tire faster than the imprudent. You can, and almost certainly will, continue to believe that your approach to blog commenting is 100% constructive, generous, and charitable, and most of all, that everyone else is mistaken when they tell your otherwise. In fact, I would be shocked if you ever concluded that any critique, by anyone, of your commenting style contained even a grain of truth.
.
I am old enough to know that some things are just not worth the effort. Ciao.
SteveF:
All you did was point to a comment and say I ignored/rejected the thrust of it. You didn’t even say what that thrust was. Given it only takes one sentence to say person X ignored/rejected point Y, it would seem you didn’t try very hard.
Heck, I put more effort into trying to figure out what you were referring to than you put into saying what you were referring to.
Brandon, the BEST data included the fraction of land for each grid cell. The plot for that data looks like this:
http://statpad.files.wordpress.com/2013/01/land_sds.jpeg
The effect does not seem to be particularly related to that fraction.
Victor, the gridded data plotted here is monthly. However, the daily series that I looked at were several examples of station data that I downloaded from the National Climatic Data Center at NOAA. If you wish to see extreme examples of winter variation of SDs (but little summer variation),try looking at the stations in Antarctic.
As far as this possibly impacting homogenization, even if the data are separated for part of the process, the difference in variability may well have an effect in optimally “combining” the individual results. Months with higher variability would generally have a higher weight in determining the end result.
RomanM, that fraction includes water for lakes and things like that as well as ocean water in coastal grid cells, right? If so, it’s not quite what I had in mind. My thought was oceans might uniformly increase/decrease variability in coastal regions as compared to non-coastal ones. Lakes and such might not have the same effect.
But judging from your graph, even if you just looked at coastal regions, you wouldn’t be able to see any real difference.
Dear Albert Gras, I was aware of the problem, via the interesting blog of a climatologist in Iceland.
http://icelandweather.blog.is/blog/icelandweather/
The problem likely is that GHCN has only a small number of stations in Iceland. Thus it likely compared data from Iceland with surrounding stations, which were far away and did not show this local effect. This will lead to difference time series with a break and because the change in Icelands climate was so large, these breaks were likely significant although the other stations were so far away.
After the breaks have been detected in the pairs, the PHA determines which station the break belongs to (attribution). This step is quite ad-hoc, it simply counts the number of breaks. The station that has most breaks with its neighbours is seen as the one with the break.
If there were more pairs with stations outside of Iceland as with stations inside of Iceland, the algorithm seems to have wrongly determined that the solution is that there is a break inhomogeneity in all the stations in Iceland.
I have submitted a research proposal to the German Science Foundation, that proposes to make this ad-hoc attribution step obsolete. I will test that new method on Iceland!
This is one reason why it is good that national weather services homogenize the data, they know their climate. That is what CRU does, they gather data homogenized by national weather services. Then the “sceptics” complain that the procedure is not transparent. 😉 It is good to have both and it is good when national weather services have a look at the homogenized data in the global datasets for their country.
“Mosher, Don, Zeke, me”
Leading members of the Blackboard Cool Guys Club. 😉
Andrew
RomanM (Comment #109167)
“As far as this possibly impacting homogenization, even if the data are separated for part of the process, the difference in variability may well have an effect in optimally “combining†the individual results. Months with higher variability would generally have a higher weight in determining the end result.”
Interesting point you make here, Roman on the adjusting step. I was wondering what kinds of variation you would see on a monthly basis if you had looked at difference series. Also GHCN uses anomaly data for finding breaks and adjusting series.
I have looked at difference series from GHCN unadjusted data and found that, at least for the data I looked at, an Arima model (0,0,2) was a good fit. That was a bit surprising to me since I was looking at difference series. Arima model simulated series perform differently on breakpoint testing than do white noise simulations.
Andrew_KY,
Cool guys? Maybe, but I think that list covers a pretty broad range of views on likely warming. Maybe you need to consider something other than warm/cool as a metric. 😮
Brandon, SteveF, Mosh:
As evil Willow put it in BtVS: “Bored now.”
DeWitt,
No worry, I am done on that subject.
Kenneth Fritsch (Comment #109177)
“I have looked at difference series from GHCN unadjusted data and found that, at least for the data I looked at, an Arima model (0,0,2) was a good fit. That was a bit surprising to me since I was looking at difference series. Arima model simulated series perform differently on breakpoint testing than do white noise simulations.”
I did some calculations again on a cobbled together difference series in order to avoid breaks in the series and found that this difference was best modeled as white noise. I need to do more extensive testing. It is not a simple proposition to separate a breakpoint from what could occur naturally from an autocorrelation.
Roman,
Very interesting charts. I had done some exploration with looking at variance as a function of distance from water. Generally speaking the variance within 50km of the ocean is rather muted relative to inland locations.. I didn’t get to a point of looking at it as a function of season ( winters have higher variance as Phil Jones pointed out once in a lecture on which seasons were most important ) and didnt look at it as a function of latitude. I was looking at it for different purposes and havent considered it effect on homogenization approaches..hmm.. BTW crossing my fingers we will have individual series posted with charts showing the ‘scalpel’ data. I trust the grided data was in order since you’ve used it. I meant to get around to doing an R import but since its netcdf I figured most guys could figure that out.
Zeke,
You write: “I’ve provided evidence from a reputable source that significant amplification of tropospheric temperatures is not expected to occur over land areas. The ball is now in your court to find evidence otherwise to continue the debate.”
Actually the blog post you cite was eventually followed by a correction by Klotzbach et al*. In that correction, they concluded that the amplification factor over land was 1.1x. This differs from the numbers you quote from Gavin due to math error he made. He repeated that error again in 2011, and there was a discussion at climateaudit**.
Citing the same blog as you, this sequence of back and forth was documented here: http://rogerpielkejr.blogspot.com/2009/11/response-to-gavin-schmidt-on-klotzbach.html
* http://pielkeclimatesci.files.wordpress.com/2010/03/r-345a.pdf
** http://climateaudit.org/2011/11/07/un-muddying-the-waters/
Buckets? Did somebody say buckets? Thousands of man years have been spent by the brightest minds(?) in science and $BILLION$-and-$BILLION$ have been expended on pretending to figure this crap out. How many times does data have to be homogenized? The funniest part is that Mosher, Zeke and some other hobbyists (with way too much time on their hands) are doing a better job than the characters who have had well-paid and allegedly illustrious careers adjusting-and-adjusting-and-adjusting the data.
Laura,
Read the CA thread a bit more carefully:
“For the other models, using Steve’s script we get:
get_trend(land$anom,start=1979,end=2005.99)
TAS TLT ampl
# bccr_bcm_2.0 0.157 0.164 1.045
# cccma_cgcm_3.1_T47 0.324 0.333 1.028
# cccma_cgcm_3.1_T63 0.316 0.350 1.108
# cnrm_cm3 0.270 0.246 0.911
# csiro_mk_3.0 0.128 0.158 1.234
# csiro_mk_3.5 0.282 0.260 0.922
# echam_5_mpi_om 0.206 0.172 0.835
# gfdl_cm_2.0 0.389 0.355 0.913
# gfdl_cm_2.1 0.382 0.364 0.953
# giss_aom 0.170 0.180 1.059
# giss_eh 0.235 0.259 1.102
# giss_eh2 0.235 0.256 1.089
# giss_er 0.262 0.284 1.084
# iap_fgoals_1.0g 0.161 0.114 0.708
# ingv_echam_4 0.234 0.214 0.915
# inm_cm_3.0 0.238 0.186 0.782
# ipsl_cm_4 0.358 0.313 0.874
# miroc_3.2_hires 0.340 0.346 1.018
# miroc_3.2_medres 0.249 0.262 1.052
# mri_cgcm_2.3.2a 0.183 0.204 1.115
# ncar_ccsm_3.0 0.331 0.324 0.979
# ncar_pcm_1 0.209 0.202 0.967
# ukmo_had_cm_3 0.214 0.176 0.822
# ukmo_hadgem_1 0.384 0.301 0.784
A range of [0.784,1.234]… and a mean (if you think that is sensible) of 0.9708 . Lest anyone think that volcanoes or something are affecting this, the same calculation for 2010-2100 is a range of [0.914,1.097] and a mean of 0.9897.
So, I think that this implies that an (non)-amplification factor of ~1 is pretty close to a consensus.”
Zeke, I read the 2010 paper.
Quoting Gavin’s non-denial denial does not change the matter. Steve summed this up better than you do, inline on Gavin’s remark: “As I noted in my previous comment, GISS results are in the top quartile amplification factors and other models give results more like Schmidt wanted. To the extent that GISS ER is materially wrong on this point, other models do support a lower amplification factor over land. But only to the extent that the GISS model is incorrect in this respect – which, I take it, Schmidt is now conceding.”
I await your update explaining that it is not generally agreed upon that the surface trends should match. Or do you have definitive proof that the GISS model is wrong?
I repeat: the just, even-handed thing to do is to admit there is a point of a continued controversy, and consequently the agreement between the USHCN surface trend and the UAH trend may be quite damning for one or the other or both.
The moral high-ground of calling for “basic civility” cannot stand on the heels of your refusal to qualify your remarks with appropriate caveats.
Instead you want to stick to your claim that there is no way Watts’s innuendo could be right. That’s not civility.
That Iceland example just shows how useless the GHCN adjustment algorithm is. Any intelligently designed algorithm would put a high weight on nearby stations and ignore those several hundred miles away, and then the errors in Iceland and elsewhere could easily be avoided. The GHCN method doesn’t do this (“there is no limit to the physical distance between the target and its neighbours”). This error has been pointed out many times, but the “outstanding scientists” have not corrected it, despite being alerted to it many times, and despite the introduction of a new version of their algorithm. Worse still, they have not even responded to enquiries about it.
#109200
“This error has been pointed out many times, but the “outstanding scientists†have not corrected it, despite being alerted to it many times, and despite the introduction of a new version of their algorithm.”
No, they shouldn’t correct it. It isn’t, as often said, a change to the historical record. It’s a modification for the purpose of calculating a global average, to reduce bias due to non-climatic effects. The record (GHCN unadjusted) is unchanged. There will be false positives, but the proper test is statistical. If you start hacking out bits that people agitate about (and leaving in others), you’ll increase bias rather than reduce it.
Paul Matthews, in the case of Iceland it was a problem, not to rely more on the local stations and use stations further away. In general this is what makes the algorithm more robust. Relying on a few local stations as reference is dangerous. This small number of stations may have large breaks themselves, which could then be interpreted as breaks in the candidate station.
The same jump could also have been an inhomogeneity. If Iceland changed the way they compute the mean temperature, for example.
Iceland is simply a difficult case, but luckily not very important for the global mean temperature. Homogenization improves the trend on average, but not for every single station.
Kenneth, there are typically minor auto-correlations in a difference time series after homogenization. This is partially to be expected in a climate series and partially due to not detected inhomogeneities. It does not influence the break detection algorithms much, they respond to variability at larger times scales as the interannual variability. The autocorrelations would change the significance levels a bit, but it is anyway not clear whether a 5% false alarm rate is the optimal level; that level is based on statistical convention.
Xiaolan Wang has accounted for auto-regressive correlations in her homogenization algorithm (RhTest), which is otherwise more or less like SNHT. RhTest did not perform much different from the other SNHT versions in our benchmarking. The important problems that make a difference are 1) handling inhomogeneities in the reference time series and 2) handling multiple inhomogeneities in your candidate.
Wang, X. L. L.: Accounting for autocorrelation in detecting meanshifts in climate data series using the penalized maximal t or F test, J. Appl. Meteor. Climatol., 47, 2423–2444, 2008.
Nick Stokes (#109201): “No, they shouldn’t correct it…If you start hacking out bits that people agitate about (and leaving in others), you’ll increase bias rather than reduce it.”
While I agree that a bias can be introduced by making point-changes to a process which is known to have zero mean, I don’t see any reason to infer that this algorithm is zero-mean. “Near zero-mean”, I could believe based on Zeke & Mosher’s analyses inter alia. If one can identify a case where the algorithm clearly is in error, I see no statistical objection to making a correction. Now, it may not be worth their time to do so, given its relatively low weight in a global average, but that is a different matter.
Nick, I dont think it’s true that the purpose of the adjustments is to calculate a global mean, and even if it was, the incorrect deletion of cooling in Iceland would change that mean so the error still needs correcting (Of course if you argue that it’s to compute a mean and that it cancels out, then there’s no point doing the adjustments at all!)
It’s also nonsense to claim that relying on a few local stations is ‘dangerous’. The surrounding iceland stations show a consistent picture of cooling post 1940 with a particularly sharp cooling in the mid-1960s that was widely observed at the time. In all 8 of the iceland stations used by GHCN this cooling is deleted by the algorithm.
It’s not just Iceland, it’s the same story in many other parts of the world.
This is all so obvious to anyone who bothers to look at the data, and it’s been reported so many times, it’s amazing some people are still in denial about it. Again, that’s why people like Anthony sometimes overstep the mark in their comments.
I support Anthony for the following reason:
http://www.ncdc.noaa.gov/sotc/global/2012/12
The NOAA state of the climate reports totally ignore the “pause”.
All they do is emphasize the scary claims, and they totally ignore the 16 year pause. They are alarmist. And dishonest through the omission of graphs and maps that show the change in temperature over the last 16 years.
NOAA = pure alarmist garbage.
I don’t get this exchange between Zeke and Laura S. Zeke:
Laura S.:
Zeke:
Zeke cited “evidence from a reputable source” that had been shown to be wrong (and due entirely to an obvious math error) some time back. Laura pointed out that fact about Zeke’s evidence. Zeke responded by saying Laura should read her source more carefully as it shows there’s other evidence.
There seems to be a huge thing missing here: Zeke admitting his evidence was faulty. Even if there is other evidence for his argument, the evidence he provided in his post was wrong. He should say so. He should acknowledge his post cites faulty evidence. He certainly shouldn’t just tell someone to read their source more carefully when he’s already provided a bad source.
Bruce is correct. They only talk about “warmest” “warmest” “warmest”. They obviously believe it’s their job to be “alarmist” “alarmist” “alarmist”.
And thank you, Brandon. You do get the exchange between Zeke and the very competent Laura S. She reminds me of lucia.
Zeke is in full spin mode. It can be expected you will be on weak footing when the defensible part of your post is a subjective rant. Unproved is that some scientists do not adjust past data creatively. Because we can’t know we need to remain wary of the possible hockey stickification of legacy analyses. When Mann disappeared the MWP and the LIA he opened the door for this level of skepticism and it has served us well. Who cares if feelings are hurt in the pursuit of truth? Feynman certainly didn’t pull punches in defense of science, and I can’t think of a better example of solid science and dogged determination than the work of J. Harlen Bretz. Good science, no apologies.
Victor Venema (Comment #109202)
“Kenneth, there are typically minor auto-correlations in a difference time series after homogenization. This is partially to be expected in a climate series and partially due to not detected inhomogeneities. It does not influence the break detection algorithms much, they respond to variability at larger times scales as the interannual variability. The autocorrelations would change the significance levels a bit, but it is anyway not clear whether a 5% false alarm rate is the optimal level; that level is based on statistical convention.”
Victor, I have found and noted to GHCN that their adjustments are not complete since when I do a difference series between adjusted series (reference station and nearest neighbors) I can continue to detect a few breakpoints. I asked if perhaps at least one more iteration through their process would reduce these left-over breakpoints. I was told that they were looking into this situation and that as you indicate the left-over breakpoints were related to their not wanting to generate too many false positives.
I am going to look at the difference series between GHCN adjusted reference series and nearestest neighbor adjusted series and attempt to model several of those series – and by using the longest series available.
Well, lets see if we can generate some agreement.
Question number 1.
Klotzbach and Peilke make an interesting argument regarding the consistency ( or lack of consistency ) between the Satellite record and the surface temps. So lets see if anyone disagrees
( I’ll discount disagreement from certian serial disagreers ).
Question 1. Can we compare say UHA to the surface record to determine potential biases in the surface record?
yes or no. If you say no, please explain why there are no circumstances under which such a comparison would be instructive.
Question 2. Which is more trustworthy the surface record or the Satillite record?
Bruce,
“And dishonest through the omission of graphs and maps that show the change in temperature over the last 16 years.”
.
Humm.. this graphic from the report: http://www.ncdc.noaa.gov/sotc/service/global/glob/201201-201212.gif appears to show the historical trend in temperatures, including the past 16 years. So I don’t see the omission of graphs you talk about. They don’t say much of anything about trends, recent or otherwise, but they do present the historical trend as a graphic. You might criticize the lack of discussion of trends, of course, but the trend information is presented.
Steven Mosher (Comment #109212),
I hope I am not a serial disagreer. 🙂
.
1) There is good reason to believe daytime high surface temperatures (when active convection between surface and mid troposphere is usually present), should correlate well with satellite measurements of the lower troposphere. Minimum surface temperatures ought to be less correlated with the satellite measurements because there are periods (esp. winter, esp. night, esp. over land) when convection between the surface and the mid troposphere is blocked by a boundary layer inversion. The correlation of surface daytime high temperatures with satellite lower troposphere temperatures ought to provide some insight about the true value for “tropospheric amplification”, both over land and over water, as a function of latitude and season.
.
2) In the recent past (eg since 1979), both records are probably quite reliable, although that is not a reason to not continue to consider the possibility of errors in either data set. It is encouraging that the correlation of daytime high temperatures with the satellite based TLT is strong (R^2 ~ 0.96 as Zeke noted), but we should remember that UHI effects may be more important for minimum surface temperatures. The further back in the surface temperature record you go, the more uncertain, if only because it is more difficult to reconstruct station histories in the distant past, and because there exist greater uncertainties in ocean surface temperature readings in the distant past. I mean, the temperature data was not being collected to satisfy a future need for reconstructing past temperatures, so measurements may well have been more haphazard/undocumented than measurements taken today.
SteveF, the NCDC maps and graphs are anomalies from the 1901 to 2010 average or from the 20th Century Average. (Not sure why they mix them up).
The trend for the last 16 years does not exist, yet it is the most important and most damaging argument against AGW.
Steven Mosher,
Anyone who wants to justify US adjustments using TLT can do it, but at the same time he means that adjustments for continents in their entirety are completely false. They add warming while they should remove 0.1 ° C per decade since 1980 (http://img215.imageshack.us/img215/5149/plusuah.png). And if this does not fit, do not take at least argument of TLT for the U.S. At this point, it is completely ridiculous.
SteveF,
This issue of boundary layer may have little effect on the amplification but it is far from the magnitude of the divergence TLT-T2M. The use of Tavg or Tmax does not change much.
Gosh, nobody can answer a question simply.
Question 1. Can we compare say UHA to the surface record to determine potential biases in the surface record?
yes or no. If you say no, please explain why there are no circumstances under which such a comparison would be instructive.
Question 2. Which is more trustworthy the surface record or the Satillite record?
The answer to question one comes in three varieties.
yes, no, and I dont know. Qualifications and caveats come later
SteveF has come the closest to answering simply. I will take his answer as yes.
phi has failed utterly and is looking down the road to future argument. he has assumed that I wantto talk about adjustments and I do not want to talk about adjustments. I merely want to know if he thinks that comparing the two records could reveal a bias. If he thinks that a comparison could never reveal a bias, then I’d like to hear that rational.
Question two: Which is more reliable? Possible answers are
surface. satellite, neither, can’t say, could never say.
And no SteveF you are not a serial contrarian. I read your answer as both records are equally reliable during there period of overlap.
This will be on an off today for me..
phi,
.
My personal guess is that the increase in surface temperature over land, at mid to high latitudes during the winter, probably contributes quite a lot to the more rapid land warming rate. Klotzbach et al (2009) certainly seem to think this is a reasonable explanation for the divergence. Comparing the TLT to the surface temperature trends at different latitudes, both over land and ocean would help clarify where (geographically) the divergence is taking place. There are very few big cities above 55 degrees, so if the land divergence is greatest in winter above 55 degrees, where human population is small, then that would lend support to the boundary layer explanation. If the land divergence is greatest in winter at mid latitudes (30 – 55 degrees), where there are lots of big cities, then that would lend support to a large contribution from UHI and/or other human influence on the temperature record. Since Kloztbach et al did not do this comparison, perhaps someone should.
Steven Mosher,
Logic comes before science. When you have satisfied the logic, you can do science.
You have not made the first step on this issue and you want to jump.
Bruce (109215),
I really do not understand what you mean when you say:
.
“The trend for the last 16 years does not exist, yet it is the most important and most damaging argument against AGW.”
.
The graph I linked to does appear to show the temperature trend history from 1880 to 2012. The baseline used (the average temperature for 1901 to 2010) does not change the scale of the trend at all, it just sets the “zero point”. You could use any baseline period you like and the graph would look exactly the same, just all shifted up or down. The total range of temperatures on the graph (maximum less minimum) would not change by selecting a different baseline. The trend for the last 16 years is not in any way hidden (the trend during that period is pretty close to flat, just by visual inspection), so I really don’t understand what about the graph you are objecting to. Can you explain exactly what you think is wrong with the graph of historical temperatures?
SteveF,
The idea is interesting. That say, this issue does not appear in the complete unknown. The divergence of TLT is only one of the recognized divergences. In addition, the non-neutral effect of homogenization on medium and long term trends is also a clue.
phi,
“The divergence of TLT is only one of the recognized divergences. In addition, the non-neutral effect of homogenization on medium and long term trends is also a clue.”.
.
What are the other recognized divergences?
.
The influence of “homogenization” on medium and long term trends needs to be considered carefully. For example, there is a pretty clear and well understood influence of time of observation (TOB) on calculated average temperature when the data came from daily minimum and maximum values only, rather than continuous temperature data. If the time of observation changes (and you know from records that change happened), then making an adjustment based on that TOB change is fair and reasonable. (My understanding is that Anthony Watts’ draft paper from last year did not consider the need for TOB adjustments, which may be why it has not yet been published.) On the other hand, other possible adjustments, like adjustments based 100% on trends at neighbor stations, may be more difficult/complex to justify, especially in the absence meta-data. I think it reasonable and prudent to question the rationals for all adjustments, but to honestly and fairly evaluate those rationals before concluding the record is badly biased.
HaroldW (and Paul),
As I see it, you have a temp record in which there are stations with sudden changes due to moves etc. You don’t know if these bias the result or not. You have a numerical process which can identify and correct these with mixed success. It will reduce the target bias (if there was any) but introduce noise of its own. However, we are much better placed to test this introduced noise for bias, as long as the algorithm is applied systematically. And they have put their argument why they believe the process statistically carries a net gain, which I do not see the Iceland worriers coming to terms with.
As I recall, the Iceland issue was that there was a sharp down and up in temps in ’62-3. The algorithm thought that the dip was bogus, but not the rise (or vice versa). Now this kind of error could go either way, and there’s a good chance that it balances out. I don’t know whether it can be expected to, but there’s a lot of data, and the NOAA folk have studied that and made their arguments. If you start correcting just the ones that people make a fuss about – well, that isn’t an unbiased selection, and you’ll lose whatever balancing there may have been.
SteveF,
I will mention first The divergence, the one of MXD, then the melting of glaciers than various authors try to explain with tinkered arguments; to limit myself to those which I am familiar with, I will add snow cover. A remarkable feature of all these divergences (with TLT) is that in the regional case I’m focused, they hold in relatively narrow margins for values ​​consistently higher than 0.1 ° C per decade.
About TOB, you are right but practically it only applies to US. Steven Mosher had given references for Japan and Canada. For Canada, I do not know but for Japan, the influence is quite low on annual averages. Elsewhere, logically, the overall effect is practically nil.
Homogenization systematically provide more warming. Interestingly, the only rational explanation for this phenomenon was given in the paper Hansen et al. 2001. As long this paper has not been refuted, scientifically speaking, we can say that the consensus is that homogenization badly bias measurements.
May I play, Steven?
1. yes
2. I go with the eyes in the skies, because of the coverage, and the data sets are not controlled by alarmistas
Did I get anything right, Steven?
Question for you: Please speculate on whether the current sat system, if in operation in 1936, would have produced data that differed significantly from data recorded at the ground stations that were then in existence? And if so, why?
My guess is that the sats would have pretty much agreed with the temps being recorded on the ground.
Also, I wonder if you would comment on this chart:
http://icecap.us/images/uploads/Science_story.jpg
If GISS 1980 and GISS 2020 are represented correctly, do you not find it strange that the red and blue lines start off very close together in around 1880, grow apart particularly during the warm times of the 20s-30s and then re-converge just in time for the satellite era? Why the big adjustments between 1920 and 1940? And how come they discovered by 2010 that it was colder in the 50s than previously believed in 1980? When the trend was warming they adjusted it colder, when the trend was cooling they made it even colder. Was there a warming bias endemic in temperature data collection for the entire period of the modern temperature record, up to 1980? And what took them so long to find it?
I forgot to mention the big cold hit that the ‘Base period for computing anomalies’ took in the 2010 version. You might think they would have noticed that in 1980. I guess there had been a big leap in human intelligence between 1980 and 2010.
Kenneth Fritsch (Comment #109211)
“I am going to look at the difference series between GHCN adjusted reference series and nearestest neighbor adjusted series and attempt to model several of those series – and by using the longest series available.”
I finished several stations in the analysis described above using ACF function and AIC to determine an acceptable fit.
I could not find a pairwise difference series (from already adjusted series) that did not have breakpoints. The difference series fit various Arima models with the AR and MA order being never greater than 2. The series analyzed all were trend stationary. Some of the series required a seasonal adjustment and some did not.
This excercise is of interest because it produces the question whether the breakpoints that remain are actually non climate related or merely what one would expect to see in an Arima modeled series. The circularity here is that if I simulate Arima series using my Arima model I know that those series will produce breakpoints with a breakpoint function where none have been added to the series, but that Arima model was determined using the series that produced breaks – even after a first breakpoint iteration.
I need some kind of independent measurement/analysis to remove the circularity here.
phi,
“A remarkable feature of all these divergences (with TLT)”
.
Tree growth and snow melt take place at the surface, not ~4 Km up in the troposphere (which is the midpoint of the satellite TLT weighting curve); glaciers, depending on their altitude, could arguably be more influenced by the TLT trend, but that would depend on what the average altitude of the glaciers you refer to.
.
So with the possible exception of high mountain glaciers, I think it is reasonable to expect these things to track the surface temperature trend, not the satellite TLT trend. Noting that these things diverge from the satellite TLT trend (like the surface temperature diverges from the satellite TLT) suggests to me the divergence between satellite TLT and surface temperature is real. I would be a little surprised if it were otherwise: warming surface temperatures and MORE snow cover would be a surprise; less snow cover is perfectly consistent with warming surface temperatures.
.
With regard to your conclusion of substantial bias in the surface temperature, I have not seen enough evidence of that to believe it is likely. Can you provide a reference to the Hansen paper that you think shows that bias?
.
Could there be some (smallish) bias in the temperature history? Sure, but the more I have looked at the data and adjustments, the less I think major bias is likely. My personal estimate is that there is a lot more (and more important) ‘bias’ in the estimation of climate sensitivity due to ignoring pseudo-cyclical surface temperature variation and adding arbitrary aerosol cooling values than in the surface temperature history.
Steven, one issue I see with comparing TLT to surface temperature record is response to ENSO. TLT seems to respond much more strongly to both La Nina and El Nino, than the surface record. Is this real? (ie TLT and ST have different responses) Or is this an indicator of bias in one or other record?
SteveF,
I’m sorry but I see that my bad English led the conffusion. The divergence I’m talking about is the one between proxies including TLT on the one hand and surface temperatures on the other hand. Snow cover, glaciers and MXD evolve as TLT.
Here is the link to Hansen et al. : http://pubs.giss.nasa.gov/docs/2001/2001_Hansen_etal.pdf
See especially chapter 4 and Figure 1 in the Appendices.
Kenneth Fritsch, I don’t see how you could hope to use your Arima model to test the nature of those breakpoints. It seems like you’ve just created a baseline. It’s good for use in comparisons, but it doesn’t get at what you’re interested in. That is, unless you can figure out why the Arima model is what it is.
Both validation studies authored by Peter Thorne and me show no sign of a bias produced by homogenization. If there is a bias in the raw data, homogenization may not fully remove this bias, but if there is no bias, none is artificially produced.
Phi has asked the Hansen (2001) question before:
My previous answer to Phi was:
Victor Venema,
I thank you for giving this link and I encourage those interested to follow our past dialogue all the way.
“Also, I wonder if you would comment on this chart:”
Well, I will. It’s bunk. It claims to show anomalies relative to 1951-1980. That means that the average over that period should be zero. The red, modern curve qualifies. But the blue curve is higher almost everywhere. It isn’t calculated on the same basis as the red curve.
Reply to Victor Venema (Comment #109133)
Thank you for the links to papers and sharing your expertise.
We need accurate temperature records to measure the total temperature change and/or the decade+ rate of temperature change. So the measure of value of any PHA lies its ability to correct inhomogeneity without BIASING the trend. The abstract to your benchmarking paper doesn’t focus on this subject.
We have stations in some areas where UHI or other land use changes have produced unusually high trends that have little to do with GHG warming. Assuming your network contains a mixture of “high trend” and “normal trend” stations (a favorite scenario of skeptics) and you introduce artificial breaks, what happens to the trends after PHA is applied? (I see Zeke has partially addressed this issue in Comment #108801.)
The latest USHCN PHA correction is finding and “correcting” breaks about every 10 years at the average station, but we presumably have no idea whether or not most of these corrections are warranted (based on meta-data). Let’s suppose a growing tree is gradually introducing a cooling bias at a station. Then, the tree is cut down, causing a detectable break in the data. By correcting the warming break, but not the gradually cooling (which is much harder to detect), one would be introducing a cool bias in the corrected overall trend. If a deteriorating shelter gradually introduces a warming bias at a station and the shelter is repaired or replaced, that could introduce a warm bias in the overall trend. Even a station move from the center of a gradually growing urban area to the suburbs might result in restoring a station to a location more typical of the location earlier in the record. So it isn’t obvious that all breakpoint corrections will improve the overall trend even if the data is made more homogeneous. If application of a PHA changes the trend because more of the adjustments are in one direction than another, we’d really like to have a good physical explanation for why a correction of this magnitude is justified.
In the US, changes in TOB provide any explanation for why large corrections in one directions are needed. Make corrections for documented TOB changes to eliminate for known reasons; then see how much PHA changes the trend – for reasons we don’t understand and therefore (IMO) can’t be confident are correct. There can be multiple changes in time of observation, but only one afternoon/morning switch can effect the long-trend.
You wrote: “In the European validation study, we also computed the false alarm rate of the PHA, it is extremely low. It actually fell of the scale and was given as 0.00.” Sure, it’s easy to put large artificial breakpoints in the data and choose parameters so that one can report a low false-positive rate. Unfortunately, Menne and Williams (2009) paint a different picture: “The false-alarm rate (FAR; the ratio of falsely detected changepoints to the total number detected) is 6.77% for the step-only scenario (only slightly higher than the expected type-I error rate at the alpha = 0.05 signiï¬cance level)”. They are correcting breakpoints which are both large and small compared with the standard deviation of the data. The latest (corrected) USHCN has about 10 adjustments per century and if 7% of them were false positives, wouldn’t about half of the station records would have a correction at a false positive breakpoint?????
Thanks, Nick. If that be the case, can you point me to a valid comparison of 1980 vs 2010 GISS?
Don,
No, I can’t. It looks like the red curve is a land/sea index. They were not available in 1980. Even the land records were sketchy. There was no GHCN.
I had some dealings with the Australian records at the time. They had only just been digitized.
Zeke: In your discussion of tests with synthetic data, why was the synthetic temperature data obtained from GCM output? Don’t the large grid cells used by a GCM produce a “synthetic US” where individual stations are excessively correlated before artificial errors are introduced? Don’t temperatures at nearby stations vary locally as wind and convection disturb the boundary layer in ways that GCMs can’t possibly simulate?
The satellite data make it appear as if the +0.2 degC/30 years correction introduced by the PHA is needed. I understand why changes in Tmin don’t correlate as well as with UAH TL. However, GHG’s are supposed to cause a larger trend in Tmin than Tmax. Mixing between surface air and the lower troposphere occurs at all times of the day, not just at Tmax. Wouldn’t it be better to show the compare the trends in average temperature before and after homogenization with the UAH TL trend?
Frank, if one station has a high trend and its neighbours have a normal trend, the station with the high trend will have the normal trend after homogenization. This is explained in more detail with some example figures on my blog.
If there would be more data with an artificially strong trend as with a normal trend, homogenization would wrongly give the strong trend to the normal data. I am no expert for the UHI, but people tell me that only a small fraction of the data is affected by urbanization. (And the fraction of data affected is smaller than the fraction of stations affected as the only periods of interest are when urbanization is increasing, a fixed bias due to the UHI is no problem to compute a trend).
One break every 10 years sounds a bit much to me. Typical values are one break per 15 to 20 years. You are right that typically for many of the breaks found using relative homogenization we do not have evidence of what happened from the metadata. For example, if there is gradual trend due to a tree or urbanization, this is typically not noted down in the metadata. If such a gradual trend is corrected with a few breaks in the same direction, these breaks will thus not fit with any metadata. How good the metadata is differs a lot per country. Especially for a global dataset, using metadata is nearly impossible, if only because it is normally written in the local language and not digitized.
If a station was affected by urbanization and relocated to the suburbs multiple times, this would give a saw tooth function inhomogeneity. You would see this saw tooth in the difference time series. (Or maybe not if the noise is too large.) You would not only correct the breaks, that would produce a strong trend in the difference time series with a rural station, which would be seen as an inhomogeneity. This is the discussion I just had above with Phi, you do not only correct the breaks (based on metadata), you also perform relative homogenization by comparison with neighbours.
Next to urbanization, there are more inhomogeneities that cause a bias. There problems typically cause the older temperatures to be too high. For example, in the 19th century thermometers were commonly installed in a metal screen at a north wall or on free standing stands. Later measurements were performed in garden screens, which initially often were open to the North and to the bottom. Since the WWII most countries use Stevenson screen, which are closed to all sides. Nowadays many temperature observations are being replaced by ventilated automatic weather stations to save labour costs. These technological changes have led to a reduction in the radiation error of the measurements, which decreases the winter and night measurements and increases the summer and day measurements. How large the heating solar error is depends on the insolation and the surface properties. The size of the cooling infra-red error depends on the humidity and cloudiness. The errors do not fully compensate and in general there is a warming bias in the earlier measurements. This has been see in many studies comparing historical measurement set-ups with (more) modern ones.
Another bias making past recording higher is that many meteorological offices and their stations have been moved from the city (inside an urban heat island) to airports (outside).
By the way, the TOB problem is not typical for the US. That it produces a gradual change may be typical, in other countries the times of observation are fixed by the national weather service and not at the discretion of the observer. However, unfortunately, the national weather services do once in a while change their minds on the best observation times.
I am at home and do not have Menne and Williams here, but I can imagine that these FAR were for the detection of one break in a difference time series. There is a second step, however, in which the breaks found in the pairs (difference time series) are attributed to a certain station. If a break is only found in one pair, you do not know which station it belongs to. Thus you need multiple pairs before you attribute a break to a certain station. The minimum would be 2, but I think NOAA has a higher limit and they require that the break be found in every pair in exactly the same year. As the date is uncertain, especially for small breaks, there can be quite some scatter in the exact date of a break. Thus many breaks that are found in the pairs do not lead to breaks in a certain station.
The size of the break is not directly important. What is important is the variance you can explain with an inhomogeneity, which means that also the length of the period is important. You may be able to find a break of just 0.1°C if it is the only one in the middle of a long time series and be unable to find a break of 0.5°C if it is close to another one or the edge of the series.
It is fun to see, how many papers you guys have read. Makes it more worthwhile for me to publish in open-access journals and more rewarding to write them. I always thought, my papers would be read by a hand full of people and then disappear in the archives for ever.
Victor Venema (Comment #109239)
“I am at home and do not have Menne and Williams here, but I can imagine that these FAR were for the detection of one break in a difference time series. There is a second step, however, in which the breaks found in the pairs (difference time series) are attributed to a certain station. If a break is only found in one pair, you do not know which station it belongs to. Thus you need multiple pairs before you attribute a break to a certain station. The minimum would be 2, but I think NOAA has a higher limit and they require that the break be found in every pair in exactly the same year. As the date is uncertain, especially for small breaks, there can be quite some scatter in the exact date of a break. Thus many breaks that are found in the pairs do not lead to breaks in a certain station.”
Victor, the GHCN publications on this point are not clear and thus I asked the GHCN people directly and as I recall 2 pairwise differences can lead to an adjustment.
While I am at it I will ask you whether a benchmarking test would look at the breakpoints found after a homogenization algorithm has made its final adjustments and if there has been any discussion of the “residual” breakpoints and perhaps using more than one iteration.
Also I found it of interest to see that at least one group was evidently aware of the issue of autocorrelation in the difference series. I’ll have to read how they determined the autocorrelation and what potential problems they thought it could cause and what their fix was.
Frank, you are right, you should better not use GCM output directly. You have to perform a downscaling of the coarse resolution data to the station scale, in other words you have to add noise to give the stations the right variability and reduce the cross correlations between stations. In the upcoming benchmarking of the ISTI we are working this way.
Kenneth, in the benchmarking we just analysed the output of the homogenization algorithms and not not start to homogenize this data second time. If only because you should always start homogenization from scratch (starting with raw data), otherwise you may introduce biases.
I think someone of NOAA once mentioned that they preferred to use only one iteration, although performing multiple iterations would probably make it possible to find additional smaller inhomogeneities. Just as with homogenizing a dataset multiple times, iterations can easily lead to biases. That needs only a minor coding problem. Such algorithms thus have to be validated very, very carefully. For example, the first version of ACMANT, a newly developed homogenization algorithm that was finished just in time to participate, was not too good when it came to trends because it uses iterations. This problem has been corrected now. Given the hostilities against NOAA, the topic of this post, I understand that they prefer to be conservative.
I think that every serious scientist working on homogenization is aware that the difference time series contains auto-correlations. I have already cited Wang above, who has developed an algorithm that takes the auto-correlations into account. She is an important person in homogenization, organizes half of all the meetings on homogenization. I would expect that everyone knows her work, but many will think that the auto-correlations are not an important problem and that white noise is a fine null-hypothesis.
Wang, X. L. L.: Accounting for autocorrelation in detecting meanshifts in climate data series using the penalized maximal t or F test, J. Appl. Meteor. Climatol., 47, 2423–2444, 2008.
Victor (January 29th, 2013 at 5:16 pm ):
It would be more convincing if the artificial data that you used in your “example figures” would be available for examination when you present such posts.
The three station example result looks pretty much trivial compared to an example with real temperature data.
Victor: In response to my possibly unwarranted complaints the CRU hadn’t addressed the buckets/engine intake controversy experimentally, your cited a number of references that were previously unknown to me. I did struggle through the first one: “The early instrumental warm-bias: a solution for long
central European temperature series 1760–2007” with Jones as a co-author. Unfortunately, these authors didn’t conduct any real experiments; they simply analyzed data from two nearby stations that had been set up several decades ago by the Austrian weather service: one in a conventional location and a second at the site where records had been collected for 250 years. The historic site was unusually high off the ground, deliberately lacked modern screens because the historic site had none, faced NNE, and the historic time of observation wasn’t discussed. Jones and company calculated correction factors from this one site and applied them to other early instrumental sites in central Europe. They did this by assuming that the need for correction was caused by morning sunlight, but apparently didn’t confirm this by comparing the correction needed on sunny vs cloudy days. The downward correction was needed mostly in the summer months, but the corrected record still has an usually large summer-winter difference from 1750-1850. But they did achieved their objective: the early instrumental record in Central Europe no longer exhibits relative warmth for 1750-1850. Is their corrected record right? Who knows? “Real” scientists (as I understand science) would have tested their correction methodology at one or two other new sites to see if their correction method worked at any location besides the one it was created to fit. That’s how science normally makes progress – by testing theories (correction methodology) in novel situations.
Victor Venema (Comment #109243)
“Kenneth, in the benchmarking we just analysed the output of the homogenization algorithms and not not start to homogenize this data second time. If only because you should always start homogenization from scratch (starting with raw data), otherwise you may introduce biases.”
Victor, the breakpoints that can be found after the homogenization of the GHCN data with their algorithm is not small in number. What I find is that these residual breaks is usually breaks that have broader CIs. My questions is whether these breaks are real or naturally arising from the autocorrelation of the series.
This is an outsider’s POV, but I think when an algorithm gets a good score in a benchmarking test, I see some lack of concern with these other considerations. That assumes, in my view, that the benchmarking tests are covering all possible non climate breaks that could occur in the data.
I should add that even relatively small autocorrelations in the difference series will lead to a number of false breakpoints being detected in the series and further that series with white noise would very rarely produce false breakpoints.
Victor: For evidence that the USHCN v3.2 has about 10 breakpoint per record, see Figure 2 at the link below. Ten is roughly correct for the US. About half as many are found outside the US. http://www1.ncdc.noaa.gov/pub/data/ghcn/v3/techreports/Technical%20Report%20NCDC%20No12-02-3.2.0-29Aug12.pdf
Victor Venema (Comment #109240),
Actually, I think the single biggest issue that holds back substantive dialog is lack of access to (pay-walled) journals. It is simple to understand: if you work for a university or government organization, then you have effectively free access to all published materials, but most individuals (not all, a few work at universities) you encounter on blogs like this one either are retired or work for an organization that does not provide that free access to journals. Most people are not willing to spend hundreds to thousands of US dollars of their own money each month in order to read relevant journal articles. I can bring myself to spend US$35 (or more!) for an article only when the subject is very important and I have no other alternative.
.
Which of course is one of the things which drives technically competent climate skeptics wild: the public in one country or another pays for the research, but nobody is permitted to read the results without paying again. Hardly seems a fair or reasonable use of public resources.
Nick,
I think you are correct that it appears the blue and red curves are not directly comparable. I tracked down the origin of the graph and it seems to be Joe D’Aleo’s handiwork:
http://icecap.us/index.php/go/joes-blog/creative_enhancement_of_global_temperature_trends1/
The 1980 to 2010 comparison was derived from three charts supposedly of Hansen/GISS origin:
http://icecap.us/images/uploads/NASA_VERSIONS.jpg
I am not sure that all that stuff makes the point that ole Joe is trying to make.
Anyway, I like this blinking stuff better. It’s works much better on us stats challenged ignorants:
http://stevengoddard.wordpress.com/data-tampering-at-ushcngiss/
The bottom line Nick, is that the continuing adjustments that net out to a cooler a past and a warmer present look suspicious to us dummies, and to a lot of people who are competent in the stats.
Steve asks:
“Question 1. Can we compare say UAH to the surface record to determine potential biases in the surface record?”
Yes but not directly, they don’t measure the same thing. We need a model of how the lower troposphere and the surface are coupled and a reason to treat one as golden.
“Question 2. Which is more trustworthy the surface record or the Satellite record?”
I don’t know.
Here is a pdf version of the Wang paper referenced by Victor Venema:-
http://journals.ametsoc.org/doi/pdf/10.1175/2008JAMC1741.1
RomanM:
The data is available at my homepage, together with a report on how it was generated and with the settings of the homogenization algorithms. Have fun analyzing the data.
It is. That is on purpose, it shows the principle.
.
Frank:
Frank, almost every sentence of your description of the beautiful paper by the late Reinhard Böhm is wrong or at least tendentious. That is a pity, I was just enjoying the calm rational discussion here so much more as the one Zeke complains about in this post at WUWT.
Reinhard Böhm was a great scientist and definitely not an alarmist. That you do not know him and only think of Jones shows where you get your misinformation from. If Böhm analyses data from an experiment by his own weather service and likely started by his initiative, I find it weird to say the least that he only analyzed the data. On of the last papers of Böhm was that the variability of the weather is not increasing and may even be decreasing for temperature. Not something you would expect an alarmist to write, wouldn’t you? Jones was just a co-author. And if Jones was not interested in such studies you would also complain. Because I already knew such petty remarks would come I had also include a paper from 1924 with comparison studies from the time before CAGW.
That the historical site was high of the ground was typical for that time and unfortunately this height was not standardized. The historical time of observation was different at every station in the early observation period, before the weather services were established, that is why the paper discusses a large range of different times of observation used at the time and also various ways to compute the mean daily temperature from it.
Any after all of your misinformation about the paper, you think you can lecture people how to do real science?
.
Kenneth Fritsch:
I would hope that their size is small and having a large CI is an indication that they are at least small relative to the noise of the difference time series.
Kenneth Fritsch:
In the benchmarking study, we found that many of the good algorithms wrt to reconstructing the trends and the decadal variability have only average detection rates, false alarm rates and further detection scores. It is important to find the large breaks and to attribute them to the right station. This is not always easy when there are multiple breaks in multiple stations in about the same period. Solving this problem right consistently is more important as finding a lot of small breaks.
The homogenization algorithms just increase the trend by 0.5C.
Or, alternatively, they say the stations moves and equipment changes artificially reduced the trend in the Raw temperature record by -0.5C.
Seems unlikely.
Frank, figure 2 in the report you linked to has an inhomogeneity in about 7% of the years. This is about one per 15 years. That is high, but still realistic. America is a dynamic country and has a dense network where you can detect inhomogeneities well.
SteveF, that is the reason why I try to publish in open-access journals as much as possible, but you have to balance that against publishing in a journal that is read by the right group of scientists or with a fitting reputation (If I have a Science or Nature paper, I would not refuse to publish there because they are still pay-walled, that would hurt my career too much).
Unfortunately, the old guard still has some problems with the concept of having to pay as an author.
By the away, also academics do not have direct access to all journals. In the end we get a paper copy almost any article as the libraries collaborate with each other, but that can take time. If you live in a university town, you can normally go the university library and print or order a copy of the articles you are interested in for a few cents per page.
“Question 2. Which is more trustworthy the surface record or the Satellite record?â€
Hard to say, but if there were a discrepancy in the trend over the entire globe, I would start searching for problems in the satellite record. Satellite data also contains inhomogeneities (new and varying number of satellites) and is difficult to homogenize as you have no reference. We have seen how long it took until UAH found the major problems in their processing. On the other hand, the metadata is relatively good, especially for the newest part.
If the results compared well where we have dense surface measurement networks and there were problems in regions were we know the surface network is not good, I would look at the surface network first.
Victor (January 30th, 2013 at 4:35 am ):
I initially looked at the page with the toy example and could not find a link to any data. You did not bother to point me to it specifically, so I looked there again (and at other places on your blog) and found no data of any type related to any of the posts I encountered.
If you have such data available for any of your examples (toy or otherwise), providing a direct link to the specific data used would be a reasonable way of preventing a further waste of my time.
RomanM, you can find a page for the paper Victor Venema wrote here. It has a link to the paper and the FTP server where you can find the data used in the benchmarking.
I found that a day or two ago when I looked at his blog. I forget exactly how I came across it, but it was convoluted. I think I had to follow a link about the IAAFT algorithm he used, go to the main page of that site (which was a site other than his blog) then click on a link to a page on homogenization. And of course, I didn’t know to do that. I only managed to because of a bit of luck and determination.
It was an annoying waste of time, but… at least I can save you it?
Victor Venema (Comment #109252)
“Solving this problem right consistently is more important as finding a lot of small breaks.”
Victor, surely you realize that a lot of small breaks that are not detected by the algorithm can add to large errors in that algorithm determining truth. I can do this in my own simulated series and it was done and published as a poster by Zeke Hausfather and Matthew Menne and other authors and posted here at the Blackboard by Zeke. The point then becomes one of are those small breaks realistic and could those breaks be symptomatic of a non climate change in a temperature series that has not been well considered.
I am reading the Wang paper you referenced with regard to autocorrelation with some interest and I thank you for the reference. I note that Wang assumes an Arima (1,0,0) model for the series and then calculates the ar coefficient for each series. Wang is using surface pressure and wind speed time series and not temperature series as I see it. With temperature series I have found that one Arima model fits all is not really the case. I have found some series were fit with (1,0,0) and others with (0,0,2) and 1,0,1) and (2,0,1). Also an additional seasonal adjustment with (1,0,0) was required for some series.
Thanks, Brandon.
I will take a look at what is there.
Thanks Brandon for pointing to the link I forgot. If you know it, it is easy to find. Go to my homepage , click on homogenization, click on monthly benchmark. 🙂
Kenneth Fritsch, surely you realize that large inhomogeneities are more important as small ones. Surely you realise that I did not write that small ones are not important. And surely you realise that a polite tone is more conductive for a productive conversation.
Wang has a lot of very similar papers (publish or perish), some of them also deal with temperature. Please, use only her relative method (PMT) and not her absolute homogenization method (PMF), or at least do not complain when absolute homogenization used automatically makes a mess of your data. We know that.
Victor Venema (Comment #109259)
“Kenneth Fritsch, surely you realize that large inhomogeneities are more important as small ones.”
If one is looking at the possibility of an algorithm missing breakpoints that can add to relatively large errors in estimating the truth then, no, small ones are more important. Large ones are relatively easy to find. Small ones not so easy.
I always use difference series as I have noted many times.
I should have added that in the Wang paper it was not clear to me on my first read how the autocorrelation was determined and whether the circular aspect had been addressed. I can detrend a series to lose that interference in modeling a series but distinguishing between legitimate breaks in a series and the natural gyrations of an Arima model series is not that easy in my view. Maybe I need to go to the satellite series.
Zeke, maybe you should talk with Gavin Schmidt. He is undermining your case and making Anthony’s.
He claims a .25C drop/divergence since 2000 between Japan’s Meterological Agency and NASA/NOAA/MET is really all four agencies in “agreement”.
http://tomnelson.blogspot.ca/2013/01/uh-oh-warmist-gavin-schmidt-points-us.html
Pure Propaganda.
Please be very polite to Victor, so that he doesn’t have to keep scolding people.
The interest in the various methods of measuring surface and troposphere temperatures obviously derives from the potential use of truly independent measures being used to cross validate the results.
At one time not so long ago before a large audience understood the data sources and methods used by the major three temperature data sets, CRU, GISS and GHCN, some in climate science were implying that these sets were independent. I think most informed parties now realize that the independence is mainly superficial. In fact the current trend with the major 3 is to collaborate as evidenced by GISS using GHCN sources and methods, I think, in total. That is not to say that the general methods by the major 3 do not change as shown by GHCN recent version changing the century long trend by 0.13 degrees C.
With the entry of the BEST temperature data set into the picture we can conjecture how independent that data set is with regards to the major three. As I noted in lengthy post above I do not think the issue of independence for BEST has been settled. One could make a case for the scalpel method not being that different than the GHCN algorithm. When the differences between BEST and GHCN in how they handle the breakpoint calculation is resolved I think a clearer picture will evolve.
That brings us to the independence of the satellite and surface measurements and then the further step of relating the two measurements. I have studied the sources that could reveal obvious dependency of satellite on surface measurements and have not found any explicit connections. I do not believe that the satellite measurements have parameters that can be tuned to the surface record, but then I am far from an expert in this area. I do realize that the satellite measurement requires adjustments and those adjustment while not tuned directly to the surface record might be “attuned” to it. It is a human characteristic to look harder for errors when you think 2 measurements might be in disagreement and then relax in that pursuit when there is agreement. I have not seen any published paper show a major dependency between satellite and surface.
If we assume satellite and surface are independent then comes the difficult task of relating how the lower troposphere should track the surface temperatures and in particular the trends. The ratio of warming in the models as indicated by Gavin Schmidt’s data presented at CA and linked in a post somewhere on this thread gives a warming ratio of as I recall for 1979 to near present time of something like 0.8 to 1.2 depending on the model. The average of those models is near 1.0 as I recall but also it has to be noted that the it varies according to that over land and ocean and even region from region on land and ocean. Is it appropriate to use an average and particularly when the range is so large?
If you happened to select a ratio that says the troposphere should warm at a rate of say 1.2 time faster than the surface you have a problem in choosing which observed temperature set is wrong – if the observed ratio differs significantly from that value.
The apparent way out of this conundrum is to note as was done by Santer et al. in producing the model and observed data (including radio sonde) and noting that model and observed results had such large uncertainty limits that you could not decide.
“With the entry of the BEST temperature data set into the picture we can conjecture how independent that data set is with regards to the major three. As I noted in lengthy post above I do not think the issue of independence for BEST has been settled. ”
Huh?
GHCN Monthly has 7280 stations. If you like you can go into the inventory and remove every last vestage of GHCN Monthly and guess what? the answer doesnt change.
In fact, the way stations are processed GHCN Monthly is one of the sources of last resort. Let me explain.
in the first stage of station de depulication we indentify which stations have multiple sources. You can see this for yourself and stop posting speculation by looking at the sources.txt file.
where you have multiple sources for a site, the data is selected according to the following protocal. unadjusted Hourly and daily sources are used first. So for every GHCN Monthly site, that has another source that is hourly or daily ( a fricking huge percentage ) we start with the daily data. Monthly data is used as a last resort only. I can tell you that GHCN Daily which contains over 26000 stations contains more than enough data that is independent of the 7200 GHCN stations, meaning you can remove all the overlap between the 7200 and the 26000 and still have enough stations. Further, you should realize that there are thousands of hourly stations that go into the mix as well. These too contain enough stations to do the whole world from data that has never been used or considered by GISS or CRU.
Don.
There is no getting the questions correct. Its more of a test of openmindedness and you passed. usually when people have their minds closed they try to re frame questions or pre position for fights down the road.
My answers.
1. yes we can compare them to estimate bias.
2. over their period of record I’d assume them to be equally
reliable, noting that over the course of time both have changed their view of the past.
hehe. ever notice how nobody on the skeptical side accuses spencer of fraudulent manipulation of data when he changes the past of UHA?
#############
Now relative to your question
“My guess is that the sats would have pretty much agreed with the temps being recorded on the ground. ”
There is a sly little conflict in the skeptical view of things.
Point 1: it was hotter in the mid 30s.
You see this point raised in many contexts. In the context of the rise of temps from 1900 to 1940 ( the rate of natural variability for example) you see this point raised in connection with NOAAs stupid press releases about the hottest year evah.
Do you see the assumption? The asssumption is this record was not infect by UHI. If you are not careful and consistent in what you argue about UHI, you might just disappear the dustbowl from the record.
Point 2 ( Spenser ) the UHi effect is strongest in move from zero people to a small number of people.
Simply put. Folks need to be careful about claims made on 2 otherwise the records in 1930s look like UHI and we we can probably be reasonably certain that they are not.
Put another way. If you think that sats would agree with the ground in 1930 ( had they been there ) Then you are also forced to accept some things about the UHI effect at small populations.
When I try to put this whole picture together the one thing I am most aware of is the fact that the entire system has to hang together, that is ones system of what to believe and what is less believeable. For example, on one hand I will get a guy blathering on about UHI in small towns, when the population move from 10 people to 100.. and at the same time that person doesnt realize that if what he says is true he has just disappeared the dust bowl..
Basically there are boundaries on how bad records can be, boundaries on how much bias there can be .. But folks who never take the time to examine what they believe about various aspect of the system never struggle with these boundaries
Steven
I like your recent comments and would like to commend you on your better attitude and lack of condescension lately. In the past even when I do agree with your point I have found myself turned off by your “tone” and I see a real effort from you to be more civil/approachable and wanted to convey some praise.
I appreciate everything you can bring to the table of these discussions and doing it with less snark only makes your points stronger. I hope others can see the maturity you show and follow your example. Thanks
Kenneth Fritsch (Comment #109263)
Perhaps it is not clear to some readers that when I use the term independence here with reference to temperature data sets it is independence more in kind than in quantity. I would expect a good comparison for purposes of cross validations of methods to be based on how the methodologies differ and/or physics as in the case of satellite versus surface. In the case of surface temperatures I am not so much concerned with the differing number of stations used since those additions will probably affect more the CIs of the data than mean values derived for the all important trend calculation.
As I noted earlier in this thread it is not even clear how much the CIs change if the source of more stations were to come from areas of the globe already covered, i.e. the value of adding stations to the US versus adding stations to Antarctica or Africa. Also to be considered is the time period covered by the added stations. Stations added late in the instrumental period where coverage is already considerably better than the past are much less valuable than those that might be found measuring earlier temperatures. Also to be considered would the relative quality of the added stations and how readily and accurately those stations can be properly adjusted.
It would be informative to see a published analysis on these aspects of adding stations to a data base.
Steven Mosher,
“Folks need to be careful about claims made on 2 otherwise the records in 1930s look like UHI and we we can probably be reasonably certain that they are not.”
Be more consistent. The warming effect of adjustments has never been explained otherwise than by a strong UHI in the nineteenth century (see eg Böhm 2001, 0.5 ° C) which disappears gradually until today.
Mosher,
Hoping to appear civil, I will point out that in the absence of detailed knowledge about station locations (which I have a tiny bit and you have lots of), one doesn’t need to disappear the dustbowl to cling to the “small town” UHI. If I just think about the 2nd half of the century in the USA anyway, I think about urban sprawl. I could justify a prior hypothesis of land warming just based on that.
That said, I’ve mostly stopped caring about possible UHI contamination. In the midst of wobbling estimates of sensitivity driven by global energy budget observations, it is an interesting hobby, but only
a rhetorical weaponevidence for people in the “what warming?” camp. Something you’ve said, more or less a few times.phi
‘Be more consistent. The warming effect of adjustments has never been explained otherwise than by a strong UHI in the nineteenth century (see eg Böhm 2001, 0.5 ° C) which disappears gradually until today.
############
1. I have looked in vain for the data from their paper and the code. No luck. perhaps you can point me to it.
Absent the resources to replicate their work, I take their study with the same seriousness that I take a study from Jones.
2. Do not confuse the alps for the rest of the world.
part of being consistent is consistently demanding the same of everyone. My first example of auditing a paper on UHI ( mckitrick) found gross errors in the data. So, pardon me if I dont take papers without code and data seriously.
Question 1: can we compare the two series to find bias?
A person who is skeptical of models should probably answer no.
A) surface average temperatures are the result of a statistical model
B) satillite data is the result of physics models and sensor inputs.
C) amplification can only be estimated by a GCM.
Question: when a skeptic questions GCMS and modelling, can he write a paper that uses UHA and amplification figures from GCMs? or do you get to pick and choose when and where you like model data. For example, the other day i had a skeptic who hates models, try to use NCEP to make a point.
This is the stage where I see that a persons objections are not driven from a consistent perspective but rather from attempts to ‘win’ the argument– or simply to withhold assent.
The last I looked a the BEST data:
“warming counties grew much, much faster than the country as a whole, while cooling counties grew slower than the country as a whole”
http://sunshinehours.wordpress.com/2012/03/17/county-population-statistics-and-coolingwarming-stations-since-1900/
http://sunshinehours.wordpress.com/2012/03/17/depopulation-and-cooling-at-the-county-level/
Steven Mosher,
I have neither the data nor the code for Böhm 2001. I don’t believe however that the problem is there. From what I’ve seen, it seems that the new GHCN version give similar results, it is rougher but orders of magnitude are identical. What matters is the interpretation, why temperatures homogenization cause important warming? To date, I have not found other explanation than that of Böhm and that of Hansen (more reasonable). According to Böhm, the 1930s were still suffering from a significant UHI, if we follow Hansen, 1930 would signal the beginning of the phenomenon.
You are rather next to BEST, I just discovered with surprise that BEST for the Alpine region gives anything identical to raw data, so with a reduced warming of 0.05 ° C per decade over CRUTEM. It seems that the scalpel would blunt on the Alpine granit. That said, it’s pretty clear that BEST causes an overall warming similar to that of GHCN or national institutes. An interesting value would be the overall average trend of the absolute temperatures used by BEST. Has this value been calculated?
Steven Mosher (Comment #109271)
January 30th, 2013 at 1:52 pm
For example, the other day i had a skeptic who hates models, try to use NCEP to make a point.
—————————
Does NCEP use real measured climate data up to today.
Or does it use fantasy forcing estimates.
After 2000 there haven’t been that many changes to weather stations. Lots of station moves happened in the 1940s, time of observation changes happened in the 70s and 80s, and most of the stations were changed from liquid-in-glass thermometers to electric MMTS instruments in the last 80s and early 90s (often with associated station moves to be closer to a power source). Those three factors account for the majority of bias in the record.
Zeke pardon me if my simple question has been asked already. I was somewhat puzzled with the changeover from LIG thermometors to the MMTS instruments – surely in this changeover due diligence and attention to history, would mean that new instruments were calibrated to the LIG standard thermometor it replaced. Therefore there should be no real difference apart from the siting closer to power sources.?
Instrument calibration and maintaining standards is so important to meteorological history and data, why would this NOT be done at the time rather than later?
I took a quick look at the stations available in GHCN monthly versus daily and I tabled (see link below) the abbreviated results for both for the stations with the highest percentage of the total stations. The monthly stations in this version of GHCN should have no duplicates but I suspect there might be duplicates in the daily. I have a bigger table with all the stations if anyone is interested. For what it is worth it appears that the daily stations are concentrated, and perhaps more concentrated, in the countries that are already the better represented with stations in the monthly data base. The total countries/territories with daily stations was 180, while for monthly that number was 226.
http://imageshack.us/a/img69/4788/ghncdailymonthly.png
Steven:”hehe. ever notice how nobody on the skeptical side accuses spencer of fraudulent manipulation of data when he changes the past of UHA?”
Nobody? My guess is that stefanthedenier and others on his end of the skeptic spectrum call it fraud, or murder. Perhaps most of the skeptic herd trusts Spencer to do it right, no matter where the chips may fall. And maybe some of them actually understand the reasons for the corrections. So, do they get any credit for not accusing Spencer of fraud? Or do we have to ding them for not being consistent? How can they avoid your hehe, Steven? Accuse, or not accuse?
Steven:”Now relative to your question
“My guess is that the sats would have pretty much agreed with the temps being recorded on the ground. â€
There is a sly little conflict in the skeptical view of things.
Point 1: it was hotter in the mid 30s.”
If you are talking about me, I don’t have any sly little conflict. I am not claiming to know if it was hotter in the 30s. I suspect it was. It was pretty hot according to the people who were there. And to the record keepers too, until recently. What I am saying is that I guess the sats would have pretty much agreed with the temps recorded on the ground. Pretty much like they do now. And as far as I can tell, you did not answer my question. Here it is again:
Please speculate on whether the current sat system, if in operation in 1936, would have produced data that differed significantly from data recorded at the ground stations that were then in existence? And if so, why?
I don’t know what point you are trying to make about the UHI. I am sure that UHI existed in the 30s, but the Dust Bowl was not caused by a little UHI. It wasn’t caused by hordes of urban cowboys, but mainly by some rural okies with new tractors plowing up the prairie grasses that held down the dirt. If you are saying that there was more UHI when the population was 130 million vs. 315 million, I ain’t buying it. Even if you say Roy says so. Remember this:
http://wattsupwiththat.com/2012/03/30/spencer-shows-compelling-evidence-of-uhi-in-crutem3-data/
A function of population density at the thermometer site. That is what makes sense to me. More people and more infrastructure, more cars, boats, trains and planes, more barbecue pits, etc…more UHI.
Nobody? My guess is that stefanthedenier and others on his end of the skeptic spectrum call it fraud, or murder. Perhaps most of the skeptic herd trusts Spencer to do it right, no matter where the chips may fall. And maybe some of them actually understand the reasons for the corrections. So, do they get any credit for not accusing Spencer of fraud? Or do we have to ding them for not being consistent? How can they avoid your hehe, Steven? Accuse, or not accuse?
######################
I dont think any of them understand the reasons for the corrections the same way they dont understand the reasons for changes in GISS. For example, some still compare GISS prior to changes in the code to GISS after changes in the code and still complain.. withut ever having looked at the code. With spencer they cant even look at the code. They can avoid the “hehe” by sticking to the facts they know or have verified for themselves.
I’ll take my position on adjustments as an example. Rather than judging the peoples motives, I read the papers, did my own look at the problem and came to a conclusion. They look at old charts ( USHCNV1 ) speculate about motives and say stuff that cant be defended. My opinion on spencers changes? sure would be nice to have a look at the code.Here is the problem Don. The problem is people who object to any changes in raw data and people who object to adjustments per se. They go silent when you remind them of spensers adjustments.
Steven:â€Now relative to your question
“My guess is that the sats would have pretty much agreed with the temps being recorded on the ground. â€
There is a sly little conflict in the skeptical view of things.
Point 1: it was hotter in the mid 30s.â€
If you are talking about me, I don’t have any sly little conflict. I am not claiming to know if it was hotter in the 30s. I suspect it was. It was pretty hot according to the people who were there. And to the record keepers too, until recently. What I am saying is that I guess the sats would have pretty much agreed with the temps recorded on the ground. Pretty much like they do now. And as far as I can tell, you did not answer my question. Here it is again:
Please speculate on whether the current sat system, if in operation in 1936, would have produced data that differed significantly from data recorded at the ground stations that were then in existence? And if so, why?
###################
I dont imagine it would have differed significantly, but am open to any argument on the matter. And no you were not implicated in the sly little conflict. I don’t imagine anyone has fleshed it out yet
I don’t know what point you are trying to make about the UHI. I am sure that UHI existed in the 30s, but the Dust Bowl was not caused by a little UHI. It wasn’t caused by hordes of urban cowboys, but mainly by some rural okies with new tractors plowing up the prairie grasses that held down the dirt.
##################
The point I am making about UHI is simple.
http://www.drroyspencer.com/wp-content/uploads/ISH-station-warming-vs-pop-density.jpg
If you look at population changes for station in 1900 to 1940 you are going to be on the left hand side of this chart, where the change in temperature is going to be high for a small change in population. In short, if you believe this story ( I dont ) then it could look like the changes from 1900 to 1940 are UHI. But we know, that it was warm in the 30s. So whats that mean? That means if we want to call the warming from 1900 to 1940 NATURAL, if we want to say those stations are good with no UHI, then we have to reconcile that with the notion that small changes in population ( from 0 to 1000 ) drive large changes in UHI. I actually think that part of the curve is rather shallow. But you can see how IF you argue that part of the curve is steep, then you might be forced in accepting that some of 1900 to 1940 is UHI… AND if you do that you have a problem because of other evidence we have that tells us it was really warm ( in the US ) during that period. So it goes to the themes of boundaries on skepticism about the record.
If you are saying that there was more UHI when the population was 130 million vs. 315 million, I ain’t buying it. Even if you say Roy says so. Remember this:
http://wattsupwiththat.com/201…..tem3-data/
A function of population density at the thermometer site. That is what makes sense to me. More people and more infrastructure, more cars, boats, trains and planes, more barbecue pits, etc…more UHI.
###############
you are missing the steep part of the curve.
Going from 0 people to 500 is 1.2C ! My observation is this.
If you believe that, then you just might have defined the whole rise from 1900 to 1940 as a UHI effect. But we know thats not true.
So rather than roys logrithmic response I’d suggest ( and have seen ) something that is more like a sigmoid response. eh work in progress..
http://www.drroyspencer.com/wp-content/uploads/ISH-station-warming-vs-pop-density-with-lowest-bin-full.jpg
ok. sneak peak for you guys
http://berkeleyearth.lbl.gov/country-list/
see something new?
so you can see where the breaks are made, and why they are made.
and the quality tests that fail
http://berkeleyearth.lbl.gov/stations/35472
Mosher, I don’t know if it is new but something seems strange about the numbers here:
Denmark 3.42 ± 0.93 North America
Denmark (Europe) 2.96 ± 0.28 Europe
Greenland 3.43 ± 0.95 North America
Greenland is a part of Denmark and it is geographically situated on the north american continent. If you want to show Greenland twice (separately and as part of Denmark), why are the numbers different albeit only slightly?
I just checked Berkeley Earth’s temps against a location which I know are quality controlled.
Besides the fact that temps start about 100 years before any thermometre was within 1000 kms of this location, there is a temporal difference between the on-the-ground measurements and Berkeley’s estimates.
They have a similar looking pattern over time but there is still a substantial difference which changes through that time. I’m not comfortable with it.
http://s13.postimage.org/opkw4k9x3/Berekely_vs_A_Location.png
Niels A Nielsen (January 31st, 2013 at 3:00 am):
The area of Greenland is 50 times that of European Denmark. The area-weighted average of 2.96 and 3.43 is 3.42.
Steven Mosher,
I have neither the data nor the code for Böhm 2001. I don’t believe however that the problem is there.
#####################
how do you decide which papers to take on faith and which to challenge? To reduce confirmation bias, you might consider suspending judgement until you check.
##############
From what I’ve seen, it seems that the new GHCN version give similar results, it is rougher but orders of magnitude are identical. What matters is the interpretation, why temperatures homogenization cause important warming? To date, I have not found other explanation than that of Böhm and that of Hansen (more reasonable). ”
########
folks take note of the structure of this argument. Phi, you are accepting a conclusion because you cannot find an alternative explanation. Note that this argument is the exact same structure as the argument GCM modelers use. This is not a criticism of this argument form but just an observation that we see people use it in many places.
“You are rather next to BEST, I just discovered with surprise that BEST for the Alpine region gives anything identical to raw data, so with a reduced warming of 0.05 ° C per decade over CRUTEM. It seems that the scalpel would blunt on the Alpine granit. That said, it’s pretty clear that BEST causes an overall warming similar to that of GHCN or national institutes. An interesting value would be the overall average trend of the absolute temperatures used by BEST. Has this value been calculated?
Huh? what is the overall average trend? Looking at Bohm, I’m hard pressed to understand what your point is exactly. They use IDW to produce 1 degree gridded temperatures ( a known poor choice ) and they compare it to CRU who use a 5 degree home built averaging system ( which has been shown to be prone to bias ). So, you point me to a paper where the source data isnt identified, where the only data I can get from them is a 1 degree grid that has been produced with an ad hoc IDW approach ( they have some funky hand built rules they throw in ) and you want me to have an intelligent conversation about things that are uncheckable. Put another way what you think the paper shows and what it actually shows may be two different things.
Steven Mosher,
Böhm paper is especially interesting because it is one of the few articles that attempt to explain an important feature of ALL temperatures homogenization for the twentieth century: they cause a systematic artificial warming. If the abscence of data or code bothers you, you can take those GHCN or national institutes, the same character is observed.
Phi, you are accepting a conclusion because you cannot find an alternative explanation.
Absolutely not, exactly not. Böhm’s explanation does not hold a second, that of Hansen is incomplete. I make you just aware that adjustments are theoretically ill founded. We should not practice them as we did not understand why they cause a systematic warming.
what is the overall average trend?
I specifies: this is the easiest quantity to calculate a simple arithmetic average of the absolute temperatures of all the series used (globally or regionally). This is obviously a variable questionable but, if the spatial representativeness of stations is not too bad and if there is not too much bias in changes of altitudes, it should allow an evaluation of the BEST methodology. It is especially interesting to compare what happens when you use many short series or few long series.
Zeke: The section of your post on satellite data indicates that one needs adjustments from PHA to bring the trend of the surface Tmax record into agreement with UAH LT over the US. Some of the adjustments made by PHA cover changes due to documented changes in time of observation that can be corrected by other means. If you first correct for TOB, do you still need to add in the other PHA adjustments to bring these two records into reasonable agreement?
phi.
Steven Mosher,
Böhm paper is especially interesting because it is one of the few articles that attempt to explain an important feature of ALL temperatures homogenization for the twentieth century: they cause a systematic artificial warming. If the abscence of data or code bothers you, you can take those GHCN or national institutes, the same character is observed.”
#################
1. the Bohm paper is not what I would call science. I cannot check the results. You may trust it, I prefer to check.
2. It does not address all temperature homogenization since it only covers a small dataset and was written in 2001 before some methods were developed.
3. It is not my job to try to figure out what 97 stations he used, or if he used the data properly. I assert he has not and the burden of proof is on him to make his case and not on me to disprove a case that hasnt been made. Oh, wait, i did get the data he used and checked his results and he is wrong.. but dont ask me for that data.. see how that works. no data. no code. not worth my time.
“Absolutely not, exactly not. Böhm’s explanation does not hold a second, that of Hansen is incomplete. I make you just aware that adjustments are theoretically ill founded. We should not practice them as we did not understand why they cause a systematic warming.”
1. Homogenization must cause systematic warming or cooling. It would very odd if they balanced out. You havent made a case that they are theoretically unfounded, you have pointed to a poorly documented isolated study and drawn conclusions from it that are unwarrented.
########################
what is the overall average trend?
I specifies: this is the easiest quantity to calculate a simple arithmetic average of the absolute temperatures of all the series used (globally or regionally). This is obviously a variable questionable but, if the spatial representativeness of stations is not too bad and if there is not too much bias in changes of altitudes, it should allow an evaluation of the BEST methodology. It is especially interesting to compare what happens when you use many short series or few long series.”
Huh, if you want to calculate misleading numbers and disregard the spatial aspects, you might as well average all times together for every place. In any case if you want to do that, get my package. load the data into a mts() structure and use apply()
it will take 2 minutes
Steven Mosher,
Homogenization must cause systematic warming or cooling. It would very odd if they balanced out.
The problem is that homogenization never cause systematic cooling (or in a way not statistically significant). This is a striking proof of the existence of a misunderstood phenomenon that challenges the legitimacy of adjustments.
Do you have an explanation? If you do not have one, you should consider homogenization as scientifically unfounded.
You havent made a case that they are theoretically unfounded
Done.
Huh, if you want to calculate misleading numbers and disregard the spatial aspects, you might as well average all times together for every place.
Yet it is probably the most robust method of calculating regional trends as much as one makes the correction of altitudes. It avoids the trap of implicit adjustments.
Zeke my question at Comment #109275) seems to be explained in an earlier series of previous posts i.e. Comment #108652) with its link to a previous posting http://rankexploits.com/musing…..e-to-mmts/ and that lead to a reply you gave to Roger Caiazza
quote
Zeke (Comment #40294)
April 8th, 2010 at 6:20 pm
Roger Caiazza,
They did post-facto; hence the image at the start of the post. Doesken 2005 describes the results: http://ams.confex.com/ams/pdfpapers/91613.pdf
unquote.
It seems from the PDF that while there were concerns expressed at the time and some parallel studies set up, there was no calibration of the new instruments to reconcile with the old LIG thermometer standard, or thought to adjust the MMTS reading down to be compatible with the LIG historical records (occams razer?) as a solution. Maybe, and I say that “tongue in cheek”
this might have allayed sceptical interpretations over future media announcements. hindsight I know..but..
Zeke, Steve, Victor:
Breakpoints detected by PHAs suggest that modern temperature records contains many more unrealistic cold shifts than warm shifts that are assume to be due to changes in observation conditions. Many hypotheses could be advanced to explain these breakpoints. Some hypotheses do NOT warrant automatic adjustment or splitting of a record: a) Breakpoints introduced by equipment changes may be handled by the NWS making the changes. (If their records haven’t been homogenized, adjustments are needed.) b) Breakpoints due to documented changes in time of observation can be eliminated before splitting or using PHAs. c) If we hypothesize that more care was taken with the initial siting of a station than with its ongoing condition, some sudden changes might reflect correction of deteriorating conditions and restoration of the original observing environment: more effective ventilation, cleaner (more reflective) shelter, appropriate surrounding vegetation and surfaces. Even some station moves away from the center of urbanizing locations could reflect restoration of the original observing conditions. In all of these cases, the splitting of records by BEST or adjustment by PHAs could be inappropriate and would probably introduce a warm bias to the trend. d) Undocumented changes in time of observation certainly require adjustment or splitting, but the breakpoints associated with these can’t be identified. Multiple large breakpoints in the same direction can’t be caused by TOB.
When you correct (by algorithms or splitting) breakpoints whose cause is undocumented, you can’t be sure whether you are correcting or biasing the overall trend. In that case, you appear to be better off correcting documented changes in observing conditions without using these techniques, and describing adjustments for undocumented breakpoints as hypotheses.
Considerate Thinker, If the software of the MMTS systems had a line stating: T_out = T_cal + dT, I do not think that this would “allayed sceptical interpretations”. I think the “sceptics” would repeat their daily slogan: the final nail in the coffin of CAGW.
And it would also not work. The difference between the Cotton Region Shelters and the MMTS systems depends on the local climate. And we are also not just interested in the annual means, which you could correct with such a constant, but also in the annual cycle, seasonal trends and changes in extreme weather. The corrections have a seasonal cycle and depend on weather conditions. It is best to leave the raw data alone and homogenize the data with respect to the problem you want to study.
@Frank.
a) GHCN prefers raw data that is not homogenized by the NWS. If only because homogenizing multiple times can introduce biases. HadCRU uses data that is homogenized by the NWS, but then climate “sceptics” complain that the data processing is not transparent.
Break points introduced by equipment changes have a different effect depending on the local climate, see above. Thus you would need parallel measurements at every single station where this change is made. It is a WMO recommendation to perform several years of parallel measurements, but unfortunately not always done in praxis. Often the reason for the change is not known several years in advance. Furthermore, AWS are, for example, often introduced to reduce labour costs in times of economic hardship, in that case asking for a budget increase for several years of double measurements is difficult.
b) TOB can be corrected before applying relative homogenization as you suggest and this is typically done, also in the GHCN. By the way, part of the bias in the Alpine data was also due to a TOB.
c) The examples you give would not produce sudden changes, but rather gradual ones. I do not know about BEST, but if you perform a normal relative homogenization, you also remove gradual trends that are not seen in the neighbour stations, not just sudden jumps.
d) There are many more reasons for inhomogeneities as just TOB (and urbanization). Especially improvements in the radiation protect (screens and ventilation) are important as reasons for biases.
Your suggestion to only corrected documented breakpoints is dangerous. Gradual trends are typically not documented (UHI, less ventilation or more shade due to vegetation, etc.), while changes that “reflect correction of deteriorating conditions and restoration of the original observing environment” and also relocations to suburbs will be documented. Thus by only correcting documented breakpoints, you may actually produce a bias in the trend. Therefore you always have to perform relative homogenization as well.
Victor Vemema,
…part of the bias in the Alpine data was also due to a TOB.
Part of the bias means how much?
I do not know about BEST, but if you perform a normal relative homogenization, you also remove gradual trends that are not seen in the neighbour stations, not just sudden jumps.
Why do you say that you do not know for BEST? It has already been said to you, BEST does not correct trends. And why are you still talking about trends corrections and jumps corrections as if they were made ​​with the same efficiency? You know very well that it is by far not the case. BEST nothing, probably nothing for CRUTEM and perfectly negligible for GHCN.
phi, having a bad day?
Is it just me, or do the others also have the impression that the tone at WUWT is getting more and more aggressive and desperate the last year?
The paper I know about the Alpine dataset (HISTALP) did not specify which parts of the trend bias was due to the TOB, radiation errors and deurbanization of the network.
What is the point of these unprovoked and constant digs directed at WUWT and “skeptics”? You are coming across like you have an agenda other than arguing your point. Do you?
GHCN makes no claims about the data that it receives from it sources, i.e. whether it has already been adjusted or not. It runs all received data through its homogenization algorithm. As I showed in a post above the amount of adjusment that GHCN does varies greatly depending on country.
GHCN makes no claims about the data that it receives from it sources, i.e. whether it has already been adjusted or not. It runs all received data through its homogenization algorithm. As I showed in a post above the amount of adjusment that GHCN does varies greatly depending on country.
##############
just look at the sources and you can tell that some come from adjusted records.
phi (Comment #109361)
“Why do you say that you do not know for BEST? It has already been said to you, BEST does not correct trends. And why are you still talking about trends corrections and jumps corrections as if they were made with the same efficiency?”
It is my understanding that while BEST does not adjust exactly like GHCN, it does in its scalpel method apply a temperature for each scapelled series at each station location based on its relationship to its neighboring stations by way of weighting process and a modified kriging process. I do not see why that an adjusted station temperature could not be derived from this process by putting all the pieces back together.
GHCN and BEST use the same general breakpoint methods for finding non homogeneities, although recent benchmarking tests have shown that those methods differed sufficiently to proced different performances and especially when documented data was not used.
Frank
‘Breakpoints detected by PHAs suggest that modern temperature records contains many more unrealistic cold shifts than warm shifts that are assume to be due to changes in observation conditions. ”
huh? that hasnt been established.
what you know is that adjustments will never be equal. The rarest result would be one where the adjustments averaged zero.
For Berkeley we dont assume any cause for the shift.
records are ‘broken’ when
1. The stations changes position. This avoids adjustments due to position changes. we call it a new station because it is a new station.
2. Stations have a gap in reporting.
3. Stations have an empirical break in their series.
there isnt any analytical adjustment made, rather an empirical
adjustment is made. The station exhibits a break. split the station and call it a new station. then all stations are re weighted to minimize the variation in weather. There is no human deciding to bump down the past because of an instrument change or TOBS change.
is this algorithm fair is the question.
There isnt any human to accuse of fraud here. no hansen to blame for adjusting, no NOAA to slime. Just an algorithm that identifies breaks and minimizes the error of the fit.
is this algorithm fair? does it move the answer closer to the truth or away from the truth.
How do we test that? The only way is a double blind test. That’s what we did. The test showed that we move the answer toward the truth not away from the truth. You cant test that algorithm by throwing mud at folks or citing unrelated papers.
Also, your opinions about splitting are wrong.
a) Breakpoints introduced by equipment changes may be handled by the NWS making the changes. (If their records haven’t been homogenized, adjustments are needed.)
If the NWS makes the adjustment then you have no breakpoint.
b) Breakpoints due to documented changes in time of observation can be eliminated before splitting or using PHAs.
Our breakpoint approach removes the necessity of doing a separate TOBS adjustment. basically we do the TOBS adjustment on the fly. Do you understand how the TOBS adjustments work?
c) If we hypothesize that more care was taken with the initial siting of a station than with its ongoing condition, some sudden changes might reflect correction of deteriorating conditions and restoration of the original observing environment: more effective ventilation, cleaner (more reflective) shelter, appropriate surrounding vegetation and surfaces. Even some station moves away from the center of urbanizing locations could reflect restoration of the original observing conditions.
If a station moves we call it a new station because it is a new station. if a station gets upgraded it is a new station. understand that splitting the record many times has no effect.
In all of these cases, the splitting of records by BEST or adjustment by PHAs could be inappropriate and would probably introduce a warm bias to the trend.
Unproven speculation. Spliting the record just splits the record.
If the station moves 10 miles, we call it a new station because it is. Sometimes those moves result in cooling, sometime warming.
factually, then tend to cause warmings. shift happens.
d) Undocumented changes in time of observation certainly require adjustment or splitting, but the breakpoints associated with these can’t be identified. Multiple large breakpoints in the same direction can’t be caused by TOB
You dont understand TOBS. multiple breaks in the same direction are very likely to be associated with TOBS because folks went the same direction in changing time, and that direction happens to be a warming direction. historical fact. sorry.
Victor Venema,
I had a good day but bad faith put me in a bad mood.
Otherwise, say that part of the bias comes from TOB without specifying the order of magnitude is not really informative.
I do not know why you mention WUWT but it is clear that with too much attention to climatology we may despair of humanity.
Kenneth Fritsch,
I’m not sure I understand you. What I mean is that BEST does not pretend to correct any perturbation increasing continuously. VV claims that normal homogenization methods can do it. In practice, it is almost impossible, because it is essentially a problem of attribution.
Steven Mosher,
huh? that hasnt been established.
Huh. There is a good amount of examples that show this characteristic. Never seen opposite case. So give the reference of a regional case where homogenization would cause artificial cooling.
There isnt any human to accuse of fraud here. no hansen to blame for adjusting, no NOAA to slime. Just an algorithm that identifies breaks and minimizes the error of the fit.
It is Hansen, very precisely Hansen, who says that this method is invalid (Hansen et al. 2001).
If a station moves we call it a new station because it is a new station. if a station gets upgraded it is a new station. understand that splitting the record many times has no effect.
This is exactly what causes the artificial warming: cut and fit.
phi (Comment #109377)
“Kenneth Fritsch,
I’m not sure I understand you. What I mean is that BEST does not pretend to correct any perturbation increasing continuously. VV claims that normal homogenization methods can do it. In practice, it is almost impossible, because it is essentially a problem of attribution.”
I think most of those people constructing homogenization algorithms would provide the same caveat for detecting breakpoints. My point remains: How realistic are the expectations of the occurrence of these types of non climate changes in the historical temperature records?
phi:
If the source of the perturbation has exactly the same characteristics as the signal, then what you claim here is true.
In fact that rarely happens in practice, as with this case where the signal of interest varies in a complex fashion in both time and space.
What you do in science/engineering, is propose a specific mechanism that produces an artifactual signal. When you model this mechanism using your network of sensors, it will produce its own characteristic signature.
This allows you decompose the measurements into a portion that is associated with signal associated with the artifact from that which is associated with the underlying signal of interest.
This can still cause problems due to noise amplification from the inverse process if two signals overlap too much, but what we have here is a climate signal that is varying in a complex manner temporally-spatially, and I doubt in practice there is much overlap between that any any reasonable artificatual signal.
What you can’t do is propose an “effect” that varies from site to site in a way that is unmodelable and has no calculable underlying physical mechanisms associated with it and then set any meaningful limits on it. I call these “Easter bunny” models (picture an Easter bunny hopping around laying “eggs” on people’s equipment).
I don’t find such “models” very interesting, since all you’re proposing really in that case is things that are unknowable are unknown.
Victor:
Assume that deteriorating observation conditions that produce a trend bias of +0.01 degC/year. The condition is corrected by repair or maintenance after two decades, producing breakpoint of -0.2 degC. The sharp breakpoint will be easy to detect and adjust, but the biased trend will be much harder to detect and correct. If you correct the breakpoint, but not the trend, you will bias the trend upward. (If I’ve chosen unreasonable values for this scenario, please substitute realistic ones – if they exist.)
If realistic, this scenario demonstrates that all inhomogeneities should not be corrected. Without evidence for what caused a breakpoint, you are making assumptions or hypotheses by automatically correcting it (or splitting the record). Such hypotheses need to be tested.
Kenneth Fritsch:
Or put another way, provide us with an analytic model that we can use to predict the frequency of occurrence and the variation of magnitude of the effect over time.
Kenneth Fritsch,
How realistic are the expectations of the occurrence of these types of non climate changes in the historical temperature records?
The increase more or less continuous of perturbations is certain. It is the important change in human environment during the twentieth century and physics that tell us. Energy consumption has increased tenfold, urban drainage has probably evolved in the same proportions. Currently these only two factors make that an urbanized area in a temperate climate produces twice as much heat as an equivalent rural area.
Huh. There is a good amount of examples that show this characteristic. Never seen opposite case. So give the reference of a regional case where homogenization would cause artificial cooling.
################
if you have never seen the opposite then you need to look more closely.
“There isnt any human to accuse of fraud here. no hansen to blame for adjusting, no NOAA to slime. Just an algorithm that identifies breaks and minimizes the error of the fit.
It is Hansen, very precisely Hansen, who says that this method is invalid (Hansen et al. 2001).”
Too bad Hansen is wrong. he after all has an algorithm that can make rural sites warmer than Urban.
“If a station moves we call it a new station because it is a new station. if a station gets upgraded it is a new station. understand that splitting the record many times has no effect.
This is exactly what causes the artificial warming: cut and fit.”
If a station moves from a mountain top to a valley 10 miles away it IS A DIFFERENT STATION. in the past people have handled this by homogenizing. We dont do that. we say. Station 1 ends and station 2 begins. there is no artificial warming, there is NO ADJUSTING.
Currently these only two factors make that an urbanized area in a temperate climate produces twice as much heat as an equivalent rural area.
#############
this depends entirely on the specific area ( the last 100 meters ) in which the temperature sensor is placed in the city. The urban landscape is heterogeneous. In terms of produced heat it depends up the size of the urban area. Lets put it this way, the vast majority of urban sites in the land temperature record are extremely small urban areas.
Steven Mosher,
if you have never seen the opposite then you need to look more closely.
Eh, I was hoping your help. Well, I will not look for something that does not exist, right?
Too bad Hansen is wrong.
Wouhaouuu!
he after all has an algorithm that can make rural sites warmer than Urban.
He is not the only one. And this is not an argument.
there is no artificial warming, there is NO ADJUSTING.
Any method based on relative temperatures must adjust in order to average. Any adjustment can produce artificial trend.
Steven Mosher,
Lets put it this way, the vast majority of urban sites in the land temperature record are extremely small urban areas.
Effectively. However, the influence of a heat source on a sensor is roughly proportional to the inverse of the square of the distance. By integrating this relation, we find a logarithmic law. The relevance of the argument is thus reduced. In addition, we are not interested in the absolute value of the perturbation but in its increase. This increase is primarily related to the growth rate of the urban area and not to its size. Finally, we do not expect a significative difference between big urban area, small urban area and rather rural site.
Layman Lurker:
Yes, I have an agenda. I think the world would in the long run be better of if people accept reality. And I have an emotional dislike of irrationality and denial. Sorry, also scientists are humans.
A “beautiful” example is the WUWT post of today that claims that all of climate change, 0.8°C in the last 150 years, is natural variability. That requires pretty strong natural variability. At the same moment natural variability is supposed to so weak that a stagnation of the trend over the last 15 years is meaningful. How can you get both ideas in one head?
.
phi:
Why I mention WUWT?
People here constantly assume bad faith when it comes to me or my colleagues.
If that is okay? Then I can point to the aggressive tone at WUWT and its misinformation, which warrants bad faith in my perspective.
It would be nice if people would see some symmetry here. If you have a prejudice against scientists (and it has to be a prejudice, you do not know me), then I will show my prejudice against “sceptics”. If I am not treated friendly, I see no reason to be friendly myself.
The best resolution would be that everyone uses a civilised tone and discusses the facts, which was one theme of this post.
Previously it was claimed that the bias was due to deurbanization (of the network). This little fact is sufficient to say that this is not right. Dive into the literature if you want to know what the contribution of the TOB in HISTALP is. There is likely no number for the bias due to deurbanization. While metadata is very complete in this region, you do not know the reason of every break. You could also be happy, that I acknowledge the limits of my knowledge.
.
steven mosher, what would happen in the BEST processing, which by the way is just as automatic as the PHA of NOAA, in the case of a saw tooth signal? Irrespective or the discussion of how often this occurs and how important it is for the global trend, it is interesting to understand the sensitivity of the methods to such a scenario.
In case of relative homogenization, the worst what would happen would be that you do not correct for part of one time going up (one saw tooth), because of limited detection power. Just as in normal homogenization, I presume that you would also detect breaks (scalpel) in the trend parts and not just the jumps. However, this would still mean that all pieces have the local artificial trend, right? Would this thus bias the trend in the BEST average signal stronger as in case of relative homogenization or is there somewhere a trick to remove this problem again?
.
Frank:
The numbers are okay, but not your assumption of what a relative homogenization algorithm would do.
0.2°C is a quite small break, especially over such a short period. Thus if the density of the network is average or low, it could well be that the inhomogeneity is not detected at all. If the inhomogeneity was at the beginning of the time series, the trend estimate would be too low. If the inhomogeneity was at the, the trend estimate would be too high.
If it would detect this inhomogeneity, if would not detect the jump only. Image that that would happen, then the part before this jump would be 0.2°C lower as the rest of the series. This would lead to a local trend in the time series of 0.2°C over the entire length of the time series, because the length is in this case much larger, you would likely detect such a trend as an inhomogeneity (the neighbouring stations do not have this trend).
Thus if this triangular inhomogeneity is detected and the homogenization method uses only breaks, then it would set at least two break points, one near the jump and one somewhere in the upward slope. Then it would subtract the mean inhomogeneity between these two break points. The beginning of the trend up to the first break point would be undetected and uncorrected and its influence on the long-term trend would again depend on the position of this inhomogeneity in the series (begin or end).
.
Phi:
I wonder why Steven Mosher did not respond to this claim. He should know this better, but I thought that energy consumption, even in a city, is insignificant relative to insolation.
It is not my topic, but at far as I know, the UHI is caused by factors such as the increase in the surface (additional vertical walls), which store heat during the day and warm at night, that the surface does not “see” the cold sky at night as well as without buildings will lead to a reduced cooling at night and depending on the climate that the soil is often sealed and cannot evaporate moisture.
Victor Venema,
Previously it was claimed that the bias was due to deurbanization (of the network). This little fact is sufficient to say that this is not right.
As long as you do not give numbers, your argument is worthless. If you had the numbers, you would find that TOBS adjustments are negligible and that the value of the bias of about 0.5 ° C for the twentieth century still can be explained almost entirely only by perturbations due to urbanization (according to Böhm or Hansen, as you like).
I wonder why Steven Mosher did not respond to this claim.
Maybe because he has a better understanding of this issue than you? Very roughly and from memory:
– Urban area completely sealed (roofing, pavements, squares, etc.)
– Rural area (meadow)
Respectively, in W/m2
Solar gain 150,150
Energy consumed 50 0
Evaporation 0 -50
Totals 200 100
I do not specify water height and I neglect marginal values​​. This is just to give orders of magnitude valid for a temperate climate.
The causes you mention are probably negligible in terms of annual averages, but they have effectively an impact on extremes.
phi:
That neatly summarizes nearly every argument you’ve give here.
Carrick,
I appreciate at its fair value your highly constructive participation.
re: Victor Venema (Comment #109396)
February 1st, 2013 at 5:27 pm
Thanks for clearing that up for us Victor.
phi:
I sincerely doubt that you are capable of appreciating criticism in any form.
Victor Venema, could you confirm something for me? Could you confirm when you refer to “the WUWT post of today that claims that all of climate change, 0.8°C in the last 150 years, is natural variability,” you’re referring to this post? If so, could you confirm that post says:
If you want people to accept reality, I think it’s important we clarify whether or not “vast majority of warming” equals “all of climate change” in your “reality.”
Brandon Shollenberger, you are right, I did not reread this brilliant post and I should have written “almost all”.
Victor Venema:
I think you should try to refrain from (almost constantly) making things up about what is said by WUWT if you’re going to say they make tons of factual errors and don’t accept reality. Or at least admit (all, rather than just some of) your errors when they’re pointed out.
It just seems silly to make things up while saying other people don’t accept reality. How could they possibly accept reality if some of the time reality is a figment of your imagination?
Brandon Shollenberger, and I think you should not nitpick. Whether “all” or “almost all” or “the vast majority” of the temperature increase is explained by natural variability, makes no difference to the argument I made. It is still schizophrenic to assume that natural variability is extremely large when you explain the long-term temperature trend and assume that natural variability is minimal when want to claim that a 15 year temperature slowdown is significant. A rational being has to chose.
Such a minor citation deviation is nothing compared to the “sceptic” Forest Mims who gave the impression that there is no trend in water vapor, by citing only one sentence, while the the full paragraph clearly states that no trend can be computed because the data is likely inhomogeneous.
Or take Alec Rawls, who made the Second Order Draft of the AR5 public and misquoted this draft to claim that the IPCC had changed its stance on the influence of the sun. Anyone downloading the draft he had linked, could see that this was not true.
That is a kind of misquotation that changes the argument. That is distorting the truth. And anonymous “sceptic” Layman Lurker just demonstrated the same strategy in small by citing one sentence out of context from my comment.
You must have a weak case, if you need to resort to such strategies.
Victor Venema,
A rational being has to chose.
Just as Zeke for TLT and Ts. He chose to take argument of TLT to defend US values, he must now recognize that at the global level temperatures are badly overstated.
You have a very weak case there.
Re: Victor Venema (Feb 2 04:40),
You’re incorrectly assuming that natural variability is something like gaussian white noise or low order ARMA and missing the elephant in the room of quasicyclic oscillations as typified by the AMO with an apparent period of about 65 years. The peaking of that oscillation is sufficient to explain the recent slowdown and would predict a continuation of slow temperature increase for another 15-20 years.
Victor
Of course a rational being has to chose. You may be confusing two different individuals having two different opinions that don’t conform with each other as one individual holding both opinions simultaneously.
Bob Tisdale wrote that post. If you want to show that what Bob says today is inconsistent with what Bob said in the past, fine. But just because Bob wrote that doesn’t mean every reader of WUWT agrees with every statement Bob wrote nor does it mean that people here agree with it, and it certainly doesn’t mean I agree with everything in Bob’s posts. (I’ve now skimmed this one because Brandon linked it. It’s 8 am– I haven’t even had my coffee! I didn’t think 0.8C rise is mostly due to natural factors before I skimmed the post; I don’t think it does now. )
As a general rule, complaints that the fictional ‘individual’ named “the-borg-mind-of-WUWT” holds individual views that are inconsistent with each other are pretty vacant. Only real, true, non-fictional individuals are required to hold consistent views. While I am sure some visitors to WUWT do hold inconsistent views simultaneously, I am also sure the same is true of some devotes of Real Climate, Open Mind, Rabett Run and any other blog you can name.
DeWitt:
Absolutely right.
Not only would it predict the current downtrend, it would add to the observed trend prior to its downturn:
HadCRUT + 60 years
HadCRUT4 without 60 years. No “slow down” observed there, but of course that temperature like quantity isn’t measured temperature.
Secular trend + 60 years
Note that in this scenario, the contribution of the 60-year component is larger than the secular trend (eventually this will fail to be true, if AGW warming continues, of course).
While we might question whether a 60-year cycle is “real” on such a limited time span, there is nothing “schizophrenic” about the idea that the large trend in the 1980s and the slow down in warming in the last decade can be explained in terms of natural variability.
(Of course the made-up argument that Victor specifically said was schizophrenic, may be schizophrenic, but no one person is actually arguing that.)
Victor: Could you point me to a publication (preferably not behind a paywall) that describes how effectively algorithms correct “triangle” inhomogeneities of the type I have postulated above could be created by correction of deteriorating observation conditions. Intuition suggests that it should be much easier to detect the breakpoint associated with restoring optimal conditions than detect the change in slope (which requires two variables, a starting date and a change in slope). IF I remember correctly, one of the USGHN papers I read showed that triangle inhomogeneities were handled poorly and possibly omitted from the final version of one paper. Your comparison paper looked at overall performance.
I picked an upward trend of +0.01 degC/yr for the slope bias due to deteriorating observing conditions and breakpoints of -0.2 degC every 20 years because I didn’t think these were negligible. Such phenomena biased all of the records continuously over a century and you only corrected the breakpoints, you’ve introduced a 1 degC/century error. If PHAs are finding about 5 (or more) breakpoints per century, how big are typical ones (average upward, average downward, average net)?
Victor Venema:
Why not? You say WUWT gets tons of things wrong while consistently misrepresenting what is said at WUWT. You say WUWT is biased while consistently misrepresenting things to make WUWT look worse than it is. Whether or not your behavior matters for any given point, it demonstrates a lack of credibility on your part. Nitpicking is appropriate when the nits consistently distort and bias. If you can’t be trusted to get simple things right, why should people trust you to get anything right?
The reality is your argument for WUWT’s schizophrenia was stupid (as DeWitt Payne, Carrick and lucia have shown), but I didn’t think you’d be willing to address that point. You’ve chosen not to admit plenty of errors already. For example, you claimed Anthony Watts broke a promise. It was a petty comment, but more importantly, it was wrong. You simply misrepresented what Watts said. At the same time, you failed to deal with the other, less obvious, misrepresentations that mattered much more.
The simple reality is you’ve given me the impression you won’t address your errors in any meaningful fashion, and you will attack WUWT/Watts for whatever reasons you can, no matter how wrong or foolish they are. You couldn’t even write a single sentence admitting your error without attacking WUWT.
Why would I do anything more than nitpicking? What could it possibly accomplish?
Victor Venema (Comment #109423)
February 2nd, 2013 at 4:40 am
Victor, in reading through the thread I noticed a strong tendency on your part to mix in comments about “skeptics” and WUWT which had nothing to do with the point you were arguing in discussion. So I asked succinctly , if your responses had an “agenda” other than arguing your point. Your response was this:
I have no problem showing the quote in the broader context. I did not intend to convey anything other than what you said. How does the more limited quote “distort” the context of your comment?
Carrick (Comment #109434),
Yes, but if one accepts a ~60 year oscillation, then underlying secular trend a) tracks GHG forcing altogether too well, implying smallish aerosol effects, and b) is only 0.08C per decade since 1980. These things are never going to be acceptable to some. 😉
.
Still, even if you accept a ~60 year cyclical contribution is plausible, someone needs to convincingly demonstrate the responsible physical mechanism, like a cyclical change in the velocity of thermohaline circulation, or a long term shift in dominant weather patterns driven by changes in ocean circulation. My personal guess would be modest fluctuation in thermohaline circulation that modulates the rate of heat transport from the tropics to high Northern latitudes.
.
If we consider fluctuation in the thermohaline circulation in the absence of a secular trend (that is no GHG driven warming), then when the thermohaline flow is higher, the temperature at high northern latitudes should increase significantly due to increased transport of heat northward by surface currents, while concurrently the temperature in the tropics should fall slightly. When the thermohaline flow is lower, the temperature at high northern latitudes should fall, while the temperatures in the tropics should rise slightly, because less heat would be transported to high latitudes. The temperature fluctuation should be larger at high latitudes in winter, because the surface area of the tropics is very large compared to the surface area at high latitudes, and because heat transported from the tropics (via both ocean and atmosphere) is the dominant heat source in the winter at high latitudes. The cyclical effect should be mainly in the northern hemisphere high latitudes because the pattern of warm surface ocean currents end up carrying more heat northward than southward. In a warming world (GHG driven warming) the oscillation would be superimposed on a secular trend.
.
Which suggests a test. If the above is right, then it should be evident in the temperature record: the slight globally averaged cooling between ~1945 and ~1975 should show greater cooling at high northern latitudes, especially in winter, and little or no cooling, or even some warming, in the tropics. The rapid globally averaged warming from ~1975 to ~2005 should show much greater warming at high northern latitudes, especially in winter, and very much less warming in the tropics.
Brandon.
Anthony used the wrong data. Mcintyre agreed.
How long does it take to switch out the data set and show the answer. This is a factual question so please just provide an estimate of time to do the job.
Brandon:
Yes, it would help Victor’s credibility if he were to quote people in context (since he suddenly thinks this is desirous) instead of paraphrasing what they say, possibly getting it out of context; or distorting or misstating what they actually meant.
Steven Mosher:
Careful what you ask for. We could start applying the same criterion to your BEST group.
People should report results when they are comfortable that they are accurate. That’s how long it should take.
Since we’re on to criticizing other people’s mistakes—especially those that haven’t gotten fixed—why is this piece of rubbish still on the Berkeley Earth website?
I think we’ve hashed over this enough already, but it’s net forcings that climate responds to, not just one or two forcings, and anyway it should be a fit to log(CO2 concentration) not just CO2 concentration.
SteveF:
Agreed. I think you need a plausible physical mechanism before you should take it as a serious model. If somebody could develop a model that could predict this, that would certainty nail it. Plenty of data with a decent model, otherwise we need a lot longer observation period to remove the possibility of coincidence.
The plausibility of such an oscillation is somewhat enhanced by the fact a similar oscillation has been noticed in longer-period proxies. At the moment though, its main value is as a curve fitting exercise.
If I get a chance, I’ll look into this…
Steven Mosher:
While not accounting for TOB adjustments is a flaw in Anthony’s paper, it is not a flaw that must be remedied by switching out data sets. As such, Anthony did not use “the wrong data.” Steve McIntyre did not agree Anthony used “the wrong data.”
Your question is predicated on a false premise. As such, I cannot answer it.
Carrick:
One of your criticisms is faulty. The caption of the figure says (from this page):
The part I made bold indicates they used log(CO2), not just CO2. You can verify that by looking at the data provided for the figure (though it uses ln(CO2) not log(CO2) like it says).
By the way, if you want to talk about that figure, you should mention it was published in BEST’s paper too (Figure 5). It’s accompanied by discussion I find hilarious:
CO2 was used as a proxy for all anthropogenic emissions. It had a calculated transient parameter value of 3.1 degrees over land. This is “broadly consistent” with an estimate for CO2 as CO2 (i.e. not a proxy), over land and ocean, equilibrium sensitivity.
And that’s a publishable conclusion.
Thanks Brandon. I’m glad to see it wasn’t quite as noobish as I thought it was. The legend on their figure is still wrong though.
Carrick, if you believe the data sheet provided with that figure, there is a greater than .99 correlation between anthropogenic forcings and CO2. That level of correlation would mean using CO2 as a proxy like BEST does is perfectly fine (though it would prevent directly calculating a sensitivity).
By the way, this reminds me of something that originally bothered me about the fit. That file says, “Per Gao et al., the 1982 eruption of El Chicon was missed in available ice cores. As instructed by Gao, add 14 Tg in 1982.” I’m a bit confused as to how El Chicon got missed in the ice cores while Pinatubo didn’t (especially since they’re at almost the same latitude). I’m quite confused as to how one could decide 14 Tg is the right amount to add to the record. But I’m incredibly confused how BEST could say this in its paper:
Reference 21 is a reference to the Gao volcanic record. The BEST paper never discusses the modification to this record. And while the BEST file claims to be following the advice of Gao et al, as far as I can see, the paper BEST cites never suggests modifying the record.
Re: SteveF (Feb 2 11:04),
Along those lines is the difference in behavior of Arctic and Antarctic sea ice. My prediction is that when the AMO reverses, we will also see something of a reversal in that, i.e. a reversal of the current trend of increased area with time in the Antarctic and a reduction in the rate of loss in the Arctic. This sort of thing happened in the early twentieth century when Svalbard became much less ice bound and coal mines were opened there. The timing was very close to the reversal in direction of the AMO from declining to increasing. Then in the 1940’s, when the AMO started to decline, it froze up again.
The problem is that I’m not sure anybody in the biz is looking for a mechanism. It’s somewhat reminiscent of continental drift. When I was an undergraduate, I was told by a geology TA that even the mention of the possibility of continental drift could threaten an academic career in geology.
DeWitt Payne:
Well we can see that it would seriously screw up the narrative if it were real. As we all know, screwing up the narrative really messes with the “reality based community”. It would also have negative funding repercussions for the entire climate community. People’s interests are clearly outweighing their ethical obligations.
It’s a good thing that Carrick and Brandon were not the alleged reviewers of the BEST paper for G&G. Couple of nit-pickers.
I have heard that the reviews were along these lines:
reviewer #1. Nice paper, guys! Please explain “nuggets”, if you feel like it.
reviewer #2. Nice paper, guys.
reviewer #3. Sweet paper, guys. Our first! We were wondering if anybody was ever going to give us a chance to be peer reviewers. Does this mean we are really peers? Thanks, and this one is on us.
Don Monfort:
And I haven’t even examined the latest code/data dump. My internet connection is bandwidth limited, and I haven’t gotten around to downloading the files while out and about. It’s a shame because I’ve already found a couple undeniable problems. I get the impression nobody (outside the BEST team) has examined BEST in much detail. I mean, even a number of simple things have slipped through.
Heck, Mosher’s R code for downloading BEST doesn’t even work. BEST changed the location of its data files months ago, and Mosher’s code still uses the old URIs. That suggests nobody has used his code to download those files in quite a while (they’d have needed to update 15 URIs to use it). That doesn’t create high hopes for the feedback BEST may have gotten.
DeWitt Payne, I am assuming that natural variability is seen on all temporal scales and that at smaller scales the variability is strongest. The scientific debate is about how this function looks like (exponential or power law, at which range of scales) and its total strength.
.
Lucia, I am glad to hear that you do see an inconsistency. I would be surprised if Bob Tisdale (strong natural variability) would have agreed with David Rose (weak natural variability). What I find strange is that you do not find a significant number of words of caution below at least one of the stories. At least you would expect cautious comments. On the contrary below both types of posts you find aggression against scientists that hold the intermediate position.
Like cornered rats,the closer their scheme comes to failure,the more they squeal. Now is the time when they (eco-cultists) are the most dangerous,as they will do and say anything to maintain their place at the gubermint trough.
Mann, or Hansen, could write a peer reviewed paper about it – that would certainly be more relevant than their usual BS.
Devastating for activist “scientists†when a convenient hypothesis (based upon wishing rather than observation) is extinguished upon collision with stubborn, inconvenient facts.
At one time the folks walking around proclaiming the “end of the world†were regarded as nut cases. Dressed up in lab coats and business suits, we now call them climate scientists and politicians.
It makes a rather opportunistic impression on me. The enemy of my enemy is my friend. From people calling themselves sceptics you would expect better.
.
Frank, sorry, I do not have a reference for you. I would also expect that such an example would more likely be in training material as in an article. Is there anything in my explanation of how relative homogenization handles a saw tooth that sounds controversial? You could apply one of the freely downloadable methods (menu left) to an artificial dataset with one saw tooth or multiple ones.
.
Brandon Shollenberger (and Carrick), it is interesting that you do not distinguish between an inaccuracy that is inconsequential and one that invalidates the argument. I hope this does not reflect on the importance you attach to the strength of an argument.
I did not misrepresent what was written in the manuscript of Anthony Watts, I have explained which claims of Watts et al. were founded, were actually derived from the study he had performed and which ones came out of the blue.
.
Layman Lurker, why else would I be commenting here if I were not interested in getting more people to accept reality? That is what the full quote says. Quoting only the “agenda” part gives the opposite impression, that I would not care about reality and puts me in a bad light. At least from my perspective that looks like a misquotation.
.
Carrick:
My sentiment exactly.
Which is why I did not understand why Anthony Watts said in August 2012:
I’m hoping to post up a revised draft, addressing many of those comments and corrections in the next day or two.
NOAA puts out three USHCN datasets: raw data (used in Watts et al.), data corrected for the TOB and fully homogenized data using PHA. Replacing the raw data with the TOB corrected data should be easy.
The fundamental problem remains that the results only makes sense if based on the homogenized data. Otherwise, it is a huge problem that a trend over a period, while the surfacetemperatures project did not provide information on the quality over this period, but only at the end of the period.
.
Brandon Shollenberger: “though it uses ln(CO2) not log(CO2) like it says”
In theoretical physics and mathematics the natural logarithm is standard and they often write it as log(). If they would use another logarithm they would explicitly write so, e.g. log10(). It thus not an error, but only shows that climatology is a new topic in the Berkeley physics department.
Victor:
You don’t think I know the difference? You’d be wrong.
What exactly are you even referring to in any case, the use of log(CO2) to correlate temperature against? That’s obviously completely wrong and it looks makes Muller foolish as a result.
If it were proportional to total forcings, of course it wouldn’t matter, except for the inference wrt to climate sensitivity.
But it isn’t — compare the blue curve (CO2 only) to the green curve. These are GISS Model E forcings. Series used by other groups are similar. (Also, at least modelers don’t think CO2 is a proxy for net forcing, and there is of course no plausible physical reason to expect that it would be.)
Note that he said “he’s hoping”. Even if he promised it by a date, which as far as I can see he didn’t, he still has an obligation to get it right.
In my experience log and ln have always been interchangable (depends on the sub-branch of physics though). I’m pretty sure appearance of log10() came after high-level computer languages. Before that we wrote (and still do in papers) $latex \log_{10}()$.
Speaking of “cornered rats”, there’s this amusing piece by James Annan.
(My bold face.) Of course I’m not shocked by the lying, and “consensus” projects are always highly politicized in any case.
My opinion though is, when scientists aren’t honest with public, they shouldn’t complain when their credibility goes into the tank. They shouldn’t blame imaginary global conspiracies for the consequences of their own actions.
Anyway, I detect a certain amount of “shrillness” from certain corners as the globe hasn’t continued to warm at the same rate post 2000. Note the fight to keep reported ECS numbers high, even when we know they aren’t consistent with the best science.
Cornered rats indeed…
Re: Victor Venema (Feb 3 09:00),
I was under the impression that pretty much everyone agrees that the temperature series is a shade of red at longer time scales. That means that noise power increases with decreasing frequency. Koutsoyiannis, for one, thinks it’s best described by a fractionally integrated series, which means the noise power curve never flattens like it does for an AR(1) series. Surely you’re not referring to diurnal and seasonal fluctuation as noise.
“Heck, Mosher’s R code for downloading BEST doesn’t even work. BEST changed the location of its data files months ago, and Mosher’s code still uses the old URIs. That suggests nobody has used his code to download those files in quite a while (they’d have needed to update 15 URIs to use it). That doesn’t create high hopes for the feedback BEST may have gotten.”
most of the users use matlab. Others use C. Some just ask me to write code for them so they get special version. There is one R user R guru,major maintainer and a friend so he just fixed it himself. I’m refactoring all my packages, so will probably do an update in a few months after EGU poster is done. Its open source for a reason.
Victor Venema,
“…why else would I be commenting here if I were not interested in getting more people to accept reality?”
This is irony?
Bad idea, here, irony is poorly understood (which is to the credit of the place).
‘By the way, this reminds me of something that originally bothered me about the fit. That file says, “Per Gao et al., the 1982 eruption of El Chicon was missed in available ice cores. As instructed by Gao, add 14 Tg in 1982.†I’m a bit confused as to how El Chicon got missed in the ice cores while Pinatubo didn’t (especially since they’re at almost the same latitude). I’m quite confused as to how one could decide 14 Tg is the right amount to add to the record. But I’m incredibly confused how BEST could say this in its paper:”
#######################
pretty simple. We found the error in Gao’s data. We wrote to him.
He thanked us and told us to add 14Tg to the record or we wait until he made the update officially. So, as instructed by Gao, we made the change. We could have left the error there and then if somebody else found the same error we would be accused of using bad data. Or we could wait for Gao to make the update officially. Or we could make the change as instructed. Pretty simple. three choices. None of them good. None of them very important to the main result which is the temperature series.
Brandon
“While not accounting for TOB adjustments is a flaw in Anthony’s paper, it is not a flaw that must be remedied by switching out data sets. As such, Anthony did not use “the wrong data.†Steve McIntyre did not agree Anthony used “the wrong data.—
Funny, that is not what Steve Mc said to me.
there are two fixes to the issue both can be done quickly
1. Use TOBS adjusted data ( change a file name and re run )
2. Only use stations that dont require a TOBS adjustment.
I can tell you that at least one of those has been done and the results have not been reported.
Carrick
“Careful what you ask for. We could start applying the same criterion to your BEST group.
People should report results when they are comfortable that they are accurate. That’s how long it should take.”
############
Well, if anthony made his station data and code available I would just do it myself. I get requests from people to “do this” or “run with that data”. The code is there for people who want to test whatever. You should know that.
I have never, ever heard a scientist say that he has lied on purpose. If he did, it would severely hurt his reputation and no one would be willing to work with him anymore.
It is a pity that the person is not mentioned and that we can thus not check its accuracy. If this statement was indeed made, I can only assume that it was a cynical remark to illustrate that a poll is not a good way to derive a prior.
“I think we’ve hashed over this enough already, but it’s net forcings that climate responds to, not just one or two forcings, and anyway it should be a fit to log(CO2 concentration) not just CO2 concentration”
Well, the first suggestion I made when we looked at this was to look at all the forcings that went into AR5. Looked at that, looked at C02, looked at lnC02, looked at a bunch of stuff. there was no difference between ln(c02) and C02 and no difference between using c02 and the other forcings.
So, c02 was used as a proxy for all positive forcings. Given that we were not putting a lot of weight on the result the simplification was seen by the physicists as being elegant. Of course other folks thought we should do as you ( and I ) suggested, that was looked at, same answer basically, so the people who like detail said more detail and the guys with nobel prizes said simplicity is better. Go figure.
Re: Carrick(#109522) – Annan’s comment about the dishonesty in expert elicitations doesn’t actually change my opinion of elicitations. As I wrote at BH, I lost respect for this method as a scientific mode of inquiry with Kriegler et al PNAS 2008, which discusses possible tipping points in climate. They interviewed various scientists and came up with collective assessments of the likelihood of occurrence of various climate “tipping points”. One such question was:
The authors combined responses and determined the likelihood of such an event by 2200 under low, medium, and high warming scenarios, arriving at 10-40%, 30-70%, and 70-90% respectively. [Individual responses indicate up to 90% for the scenario with less than 2 degrees of average warming.] “Error bars” and all, appears very objective and alarming.
.
Then one looks at the responses, and finds that 2 of the 15 interviewees did not provide probability estimates. One said it would take at least 600 years, and another said that such an event would be too far in the future for elicitation of probabilities to be appropriate. [Those dissents agree with various other opinions I have seen expressed which said that GIS disappearance would take millennia. For example AR4 WG1 talks of millennia.]
.
So despite the fact that some of their experts believe that it’s not physically possible to melt GIS over that time span, the authors discard those opinions, and average the remaining ones. I stopped reading the paper at that point.
.
Edit: Victor (#109535), “A poll is not a good way to derive a prior.” Yes. I’m not sure what it is good for, besides polemics.
Brandon
“Carrick, if you believe the data sheet provided with that figure, there is a greater than .99 correlation between anthropogenic forcings and CO2.”
ya imagine how bad I felt when I suggested that we do as carrick suggested and the answer came back that it made no difference because of the correlation. You know that feeling you get when you tell somebody to do work to test your speculation, work that you could do yourself before raising the issue, and they go away and do the work and you realize… shit I just wasted his time.
And then you realize.. shit I wonder if he feels like I do when folks waste my time
DeWitt Payne, maybe my statement was not clear. I was referring to the fact that the day to day variability is larger than the year to year variability, which is again larger than the decade to decade variability, etc. If you add it all up, yes, then the variability increases with time scale.
One of the models would be long range dependence also used Koutsoyiannis (a power law autocorrelation function). This model sounds reasonable to me, I only do not agree with Koutsoyiannis estimates of the size of the natural variability. Part of what he sees as natural variability are actually non-climatic changes. This is especially a problem in hydrology, were discharge is estimated using water levels, but this relationship changes continually, especially after periods with high discharge.
.
Steven Mosher, are you also coming to EGU in Vienna yourself? Hope to see you there.
SteveF (Comment #109445)
February 2nd, 2013 at 11:04 am
Comparison of NH SST trends by latitude for 1940 to 1975 vs 1976 to current. SST data is ERSST v3b courtesy of KNMI.
Victor Venema:
Say what? I’m confident Carrick distinguishes between the two, and I know I do. Where do you get this idea from?
What you “explained” was wrong. I pointed this out, and you failed to justify your “explanation.” Heck, you practically didn’t respond to the points I raised. On the one point you did respond to, I explained how you were wrong. At that point, you promptly said nothing.
Oh, and in that last comment of yours, you completely misrepresented something Watts said in order to attack him. You conveniently stopped responding before you would have to deal with that point. Just like you’ve conveniently avoided addressing the fact you completely misrepresented Watts when I’ve brought it up since then.
Steven Mosher:
Try correlating with number of lap poodles next time.
If you get a correlation of 99% and somebody says well that’s the wrong variable to correlate with, (regardless of whether you look like an idi*t for using it), and then you use the right physical variable and still find a high correlation (that would be amazing to use the right variable and get a good correlation, wouldn’t it?), feel free to vent over the “waste of time.” 🙄
It’s a terrible proxy for total forcings, so there isn’t anything “elegant” about using it.
And anyway, because there is so much uncertainty in them, total forcings by construction match with temperature (especially if you use a box-model filtered version of them), so there’s absolutely nothing amazing about the fact the correlation is “so good”.
Which leads back to the totally banal and not at elegant correlation of a variable that is not predictive of temperature change with temperature change being not only useless but misleading.
Steven Mosher:
OK you’re just not being rational here. If I gave you my code six months before I published it, and let you publish it with your name, wouldn’t that sort of negate the purpose of me working on it?
Anyway, Anthony has tried being transparent in the past, and you know what happened there… people published his data without permission. Didn’t work out so great.
Berkeley’s in a different position because really they have no new data, just algorithms that haven’t been applied here yet. Since they introduced kriging for example, they have a certain priority over that idea.
I appreciate you putting the code on line, even if the online code is currently broken. However, I use yardsticks like comparing CO2 (or lap-poodles) to global mean temperature to tell me how reasonable people are, how willing they are to modify what they are doing in the face of criticism.
If they insist on sitting on really stupid ideas, like CO2 vs temperature, that greatly removes any interest on my part in what they do, let alone any interest in my part in providing any feedback to them.
I’ve got enough stubborn people in my field that I have to deal with on a daily basis without looking for more of them to do battle with.
I do understand where James Annan is coming from in his vent over BEST, though I disagree with some of the remarks he makes: I think the exercise they are doing is a good one. It’s unfortunate the execution is so spotty in so many places.
Nonetheless, since their real contribution will be a suite of new algorithms, IF these get adopted and improved over time, they will still have made a real contribution.
Steven Mosher:
First off, if you wrote to Gao and Gao advised you to do something, then you were advised by Gao. You were not advised by “Gao et al.” as has been claimed (by both Zeke and Robert Rhode).
Second, all of the options you list ignore one major option: Say what you did! The BEST paper doesn’t say what was done. It doesn’t have an SI that says what was done. Heck, even the BEST website doesn’t say what was done. The only way anyone could have any idea is to go to one page on the site, download one particular file and see a single line mentioning it in a back-handed way.
How do you modify a data set in a semi-arbitrary way without at least saying what you did? Did the reviewers of the BEST paper know what you did? If not, how can we trust their reviews? You hid data manipulation from them! You can say it “doesn’t matter,” but who are you to make that call? Who are you to decide what data manipulation people get to know about and what they don’t?
Carrick:
If we believe what Mosher said just a little while ago, it’s even worse. He said, “c02 was used as a proxy for all positive forcings.” I’m going to assume he misspoke as there are non-positive anthropogenic forcings, and there are positive non-anthropogenic forcings.
That said, I think you’re making a bigger issue of this than you ought to. The difference between the CO2 curve and the total anthropogenic curve is incredibly small if they’re scaled. The black curve is CO2 and the red total anthropogenic forcings. There is no practical difference between the two. If we accept the radiative forcing data (with it’s practically made up aerosol history), CO2 works as a proxy for anthropogenic emissions.
It doesn’t excuse comparing the results gotten by using CO2 as a proxy with sensitivity to CO2 as CO2 though. That’s all sorts of silly.
Brandon
If you look at the actual scaling factor (which is what matters if you want to use something as a proxy) rather than the difference, the comparison is not good at all
The ratio is near zero circa 1900, around 0.2 circa 1940 and around 0.5 since circa 1980.
Anyway, suppose I found another variable, say number of lap-poodles as a function of year that had a 99% correlation with log(pCO2)? Would I be warranted to correlate atmospheric temperature versus number of lap-poodles in a research paper?
I think the correct answer to that is “no”, you should use the physical variable that your model predicts a relationship to temperature with.
What we have here is a very poor proxy for total anthropogenic forcing, which we’re insisting on using instead of the readily available public number because .. um, frankly I have no idea why they insist on using it. It’s just a dumb thing to do.
The reason you use a proxy is because the original variable is not available. Here it is.
(And if you use the correct variable instead, it tells you less than you think because of tuning issues.. the test itself is actually pretty circular if you actually think about it.)
Carrick, I’m not sure how you came up with that graph. It doesn’t really matter though. I did a linear regression with the volcanic record and CO2. I then did a linear regression with the volcanic record and total anthropogenic forcings. Can you guess how much of a difference there was? Less than 10%. The r2 score was only different by ~2%. Exactly what we should expect given the graph I posted before.
Given there is that little difference between the two results, what bugs you so much about it?
It’s worth pointing out the results are changed far more if you do the linear regression over just the post 1900 period. Most importantly, the effect of volcanoes is greatly diminished. Which just goes to show how low quality the analysis by BEST was. The complete lack of in or out of sample testing is worrisome. Even the most basic of checking would have found the calculated strength of volcanic forcings is highly dependent upon time period chosen.
Not only that, but whether or not the modification of the volcanic record (to add El Chicon) matters is dependent upon the time period used for the regression. Use the entire record, and it causes basically no change. Use the 1950+ period, and it decreases the effect of volcanic forcings by ~15%.
Personally, I don’t get the idea of doing the regression over the entire record. Why use lower quality data to calculate your results? It will “improve” the image by forcing things to fit better, but the results will be less accurate.
Mosher will set you guys straight, as soon as the Super Bowl is over. If he is not too disappointed. I prefer that the Ravens win. It is bad enough that the 49er fans riot when they loose, but it’s worse when they win.
Brandon:
Take the ratio of total anthropogenic forcing to CO2 forcings from GISS Model E.
I think you’re missing the point though. If I had fit to number of lap-poodles and that gave a 0.99 correlation, you’d think that would be proof of AGW? (Or anything meaningful?)
If not, then why CO2 forcing? This is just as wrong as lap-poodle numbers to fit to.
It’s only net forcing that matters, and it’s totally irrelevant whether you get a good correlation to an individual forcing, because the underlying physical model isn’t that CO2 forcing by itself drives temperature change, but net forcing.
(I’m guessing you’ve had a physics course where you had to apply F = ma. “F” here is net force, not a single component of the forces acting on the body. What Muller did was the equivalent of using a single component of force instead of net force.)
Carrick:
I checked the listed values, and my value for total forcing for 1900 is 0.137 + 0.013 + 0.003 – 0.093 – 0.126 + 0.064 + 0.025 = .023. To get a ratio of ~-0.15 for 1900, CO2 forcing would need to have a significant, negative forcing component. I can’t imagine how you would get that.
So as I said, I don’t know how you came up with that graph. As far as I can see, there shouldn’t be any negative values in it at all.
It’s possible I’m missing your point. However, I don’t like using CO2 as a proxy. I think it is highly misleading (because of the interpretation of results). I just don’t see how it affects the linear regression BEST does in a meaningful way. It certainly affects the interpretation of that regression, but as far as I can see, it’s effect on the regression is less than 10%. That’s far less than other a number of other effects.
If lap-poodles provided a curve the same as CO2 does, I’d accept using it as a proxy. I wouldn’t say it is “good,” and I wouldn’t say it is meaningful, but I wouldn’t worry much about the error it introduces into the results. As long as I can quantify the error introduced by using it is a proxy, I can accurately interpret the results.
To put it bluntly, the regression BEST does stands or falls on points far more significant than the less than 10% error introduced by using CO2 as a proxy. Use lap-poodles, CO2 or anything else. As long as the error is less than 10%, I can be reasonably confident in the results. And if I can introduce a 50% error just by examining a reasonable subset of the data, a 10% error isn’t going to matter much.
In other words, I’m not arguing about what is “right.” I’m arguing about what matters. If you can show using CO2 as a proxy has a substantial effect on the results, I’ll care. Otherwise, there are far more important fish to fry.
Brandon, I was using http://data.giss.nasa.gov/modelforce/RadF.txt, which doesn’t appear to be available any more, but the numbers are slightly different than in your version of the table (my figures end in 2010).
If you *really* want to double check my numbers, I’ll put it where you can snag it, but I think that’s missing the point in any case.
The fundamental flaw is that it is the wrong parameter to regress against, and if you tried to use that parameter, whether it accidentally correlated well with net forcing, you’d still get zero credit for that problem on a physics test.
But it would still be as pointless. You know the original series, so there’s nothing you’ve learned by substituting a proxy for it, how well or how poorly it is a representation of the original series.
Moreover, the original series contain quantities that are very uncertain, like anthropogenic aerosols, so unlike pCO2 they are very poorly known, especially before say 1950.
By replacing a series that has a large uncertainty with one that doesn’t, effectively Muller is playing a game of smoke and mirrors here. Effectively he gets a good fit with the wrong series, but in the process manages to obscure the fact that largely the good fit between temperature and the correct physical quantity has a good deal of uncertainty with it, and is likely itself based, or made to fit, the instrumental temperature record (hence my comment about it being circular).
Wrong method = right answer is still wrong. Nor has he described what he has done is use CO2 as a proxy for net forcings. Where does he actually say that?
(At best you are giving an explanation for why he gets a good correlation using the wrong method, but that is a different thing that demonstrating that he understands that what he is doing is wrong.)
You should care if somebody is being sloppy and done something wrong. If they don’t care any more than this on something this visible, what does it say about the nuts and bolts of what they have done, where nobody is likely to review their work?
That’s why I care. It’s a stupidly made graph, and the fact it’s still on their website tells me something important about the quality of work produced by that group.
Seriously though, this is worn out.
Carrick:
If you want me to care about a difference in values, you’ll have to show me a meaningful difference in those values. You said I was looking at the wrong values to judge that by. I can’t see the values you got. That makes me doubt the ones you showed.
I agree the BEST method is wrong. I just think there are degrees of wrong. If something is wrong by less than 10%, I’m only going to worry by ~10%. I’m not going to throw out something just because it didn’t do one thing right. Instead, I’ll look at how much of an effect that one thing had and keep it in mind when I look at the results.
Sure. BEST sucks.* But if you’re going to criticize BEST, why criticize them for something that makes almost no difference when there are much larger problems? How much should I really care about a bad choice by BEST that makes almost no difference? The choice isn’t good, but… if it doesn’t change the results, how bad can it really be?
*I’m currently working on a write up discussing some preliminary findings even the most basic of reviews should have caught. I’m not sure where I’ll post them, but I think they are interesting.
Brandon:
You doubt my numbers because I got different numbers using different numbers?
Well here goes:
The data are here.
This reproduces the results:
awk '{ if ($1 >= 1880 && $2+0 != 0) print $1, ($2 + $3 + $4 + $6 + $9 + $10 + $11)/$2 }' RadF.txtIf you look at the output, you’ll clearly see negative values:
1881 0.453901

1882 0.446809

1883 0.421836

1884 0.383698

1885 0.346218

1886 0.346853

1887 0.298969

1888 0.233046

1889 0.175501

1890 0.144273

1891 0.114907

1892 0.10058

1893 0.0242014

1894 -0.0159325

1895 -0.06814

1896 -0.0947741

1897 -0.145597

1898 -0.193133

1899 -0.157064

1900 -0.129575

1901 -0.0826667

1902 -0.0582765

1903 -0.0347625

1904 -0.00107124

1905 0.024012

1906 0.0406043

1907 0.0519946

1908 0.0750105

1909 0.0870088

1910 0.0982792

1911 0.115357

(etc)
But as I said this isn’t even germane to the real argument. Whether it’s a poor proxy or a great proxy, it’s completely stupid to use it in place of the real data, nor is there any evidence that Muller understands why what he did is fundamentally wrong. It turns out it isn’t even a great proxy, but who cares. That’s just a red herring that Mosher raised to fend off criticism of Muller’s jacked-up method.
We definitely have different standards then. If what they are doing is wrong, it should be fixed, especially if it is as fundamental as this.
You don’t use the excuse I got 90% of the answer right so I’ll stick with a clearly erroneous method, especially when the correct one isn’t any harder to implement.
If they are indifferent, as they are, to sloppy work, that makes me view them as an unreliable source of information. Anyway, this has been beaten into the ground. Enough on it (from me anyway, feel free to monologue if you like). My weekday is going to be busy. Not likely to get a chance to blog in any case.
Carrick:
I doubt anything until I’ve been given sufficient reason to stop doubting it. In this case, you give numbers that don’t match anything I’ve seen. You now offer code to reproduce your results, but that code doesn’t incorporate column seven, SnowAlb. The GISS file I linked to lists that as a “Human-Made Aerosol.” Assuming we accept GISS’s forcings, you need to include that. If you do, you shouldn’t have any negative values. That means my impression was right.
I’m pointing out the decision doesn’t materially impact the results. That doesn’t mean I say it shouldn’t be fixed. It means I accept that while it is a flaw, it is a flaw that doesn’t change the results in any meaningful way. Or to put it simply, you’re making a bigger deal of it than you ought to. It is a problem, but it is a small problem.
(Victor Venema, eat your heart out.)
I’ll take your word on snow albedo forcing. At least you see where I got my numbers from. It’s a red herring in any case. Mosher was being clever and diverting attention from the real issues by raising it.
How big of a deal I should make of it isn’t an issue you get to decide.
It’s not whether the result is that far off that is the issue, it’s that it’s wrong and they don’t correct a problem when it’s pointed out to them. This is relates to responsible conduct in research. Obviously I see a problem, but I have a different perspective perhaps, because I’m a practicing researcher myself.
Laterz.
Carrick:
Fair enough. I wouldn’t have harped on this so much except BEST’s results are extremely dependent upon the period one regresses over. When there’s a point that changes results by ~50%, focusing on a point that changes results by ~10% seems pointless.
Your criticism is definitely legit. It just seems trivial by comparison (to me).
Toodles. Sorry for dragging this out!